
Linux BCC Instance Lagging Issue
If the BCC instance is running slowly or experiences sudden network disruptions, it may be due to high CPU and network usage on the BCC instance. This document will guide you in diagnosing the causes of high usage and resolving related issues independently to enhance self-maintenance capabilities. Overall troubleshooting steps:
- Identify the specific processes impacting CPU usage or causing significant CPU load.
- Determine whether the processes affecting CPU usage or causing high CPU load are normal, and address them accordingly.
- For normal processes: Consider upgrading the instance specifications or optimizing the relevant processes/programs.
- For abnormal processes: Manually terminate such processes or consider using third-party security tools.
Location of high CPU usage
First, log in to the BCC instance. If you are unable to use SSH or SmartTerm for login, refer to the instance login section in the product documentation and log in using VNC instead.
You may use the top command to analyze processes.
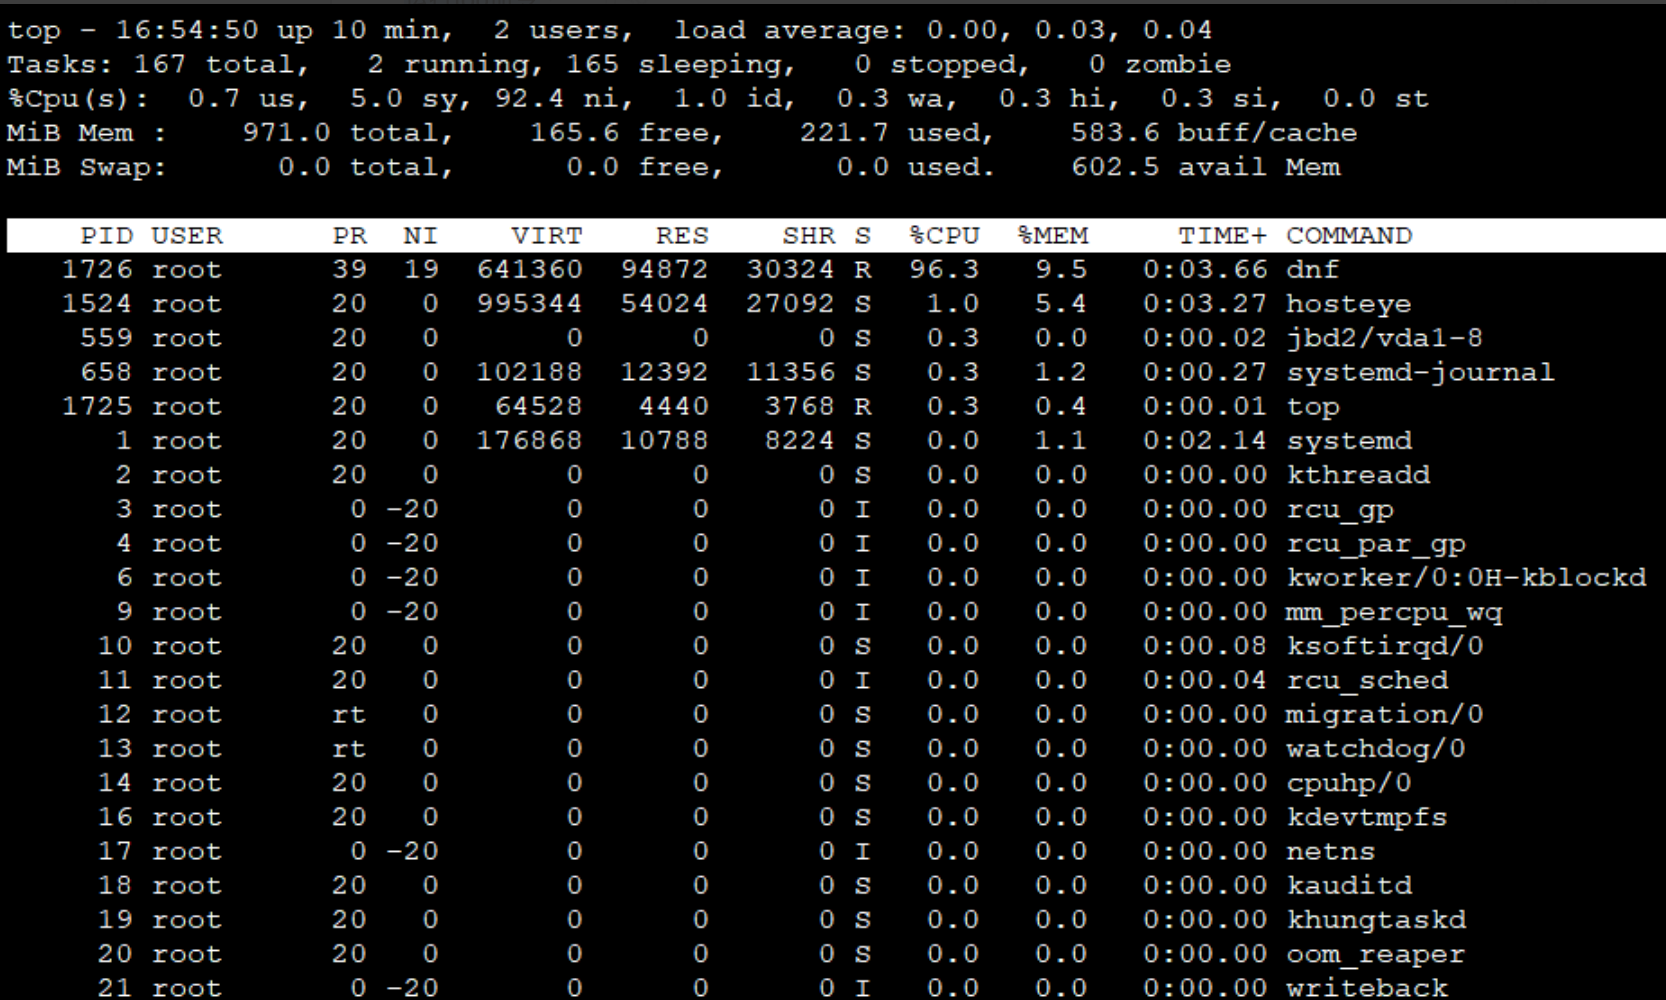
Response result description:
Above, static display:
1First line: The current system time, including the uptime of this BCC instance, logged-in user status, and CPU load averages for the past 1 minute, 5 minutes and 15 minutes.
2 Second line: Task execution status in the current system.
3 Third line: Overall CPU resource usage.
4 Fourth line: Overall memory resource usage.
Dynamic display: Resource usage by each process. Use the following command to view the program file associated with each process ID:
ls -l /proc/PID/exe

Troubleshooting of high CPU usage
Abnormal process handling
- For specific processes with high CPU usage, if they are abnormal processes, you can terminate them directly using the
killortopcommand.
Terminate the processes with high CPU usage with the kill command
kill -9 PID
Terminate the process with high CPU usage with the top command
- While the top command is running, press lowercase "k" and enter the PID of the process to terminate
Common process handling
- For the issue of high CPU usage caused by the kswapd0 process, you need to optimize the application or upgrade the system specifications by increasing the memory. kswapd0 is the virtual memory management program of the system. If the physical memory is not enough, the system will wake up the kswapd0 process, and the disk swap space will be allocated by kswapd0 as a cache, thus occupying a large amount of CPU resources.
When you find that the kswapd0 process is busy causing high CPU usage in the instance, you can troubleshoot the memory usage of the process by following steps:
-
View the resource usage of the kswapd0 process with the
topcommand.Plain Text1 If the kswapd0 process continues to be in a non-sleep state and runs for a long time, it can be preliminarily determined that the system is continuously performing page swapping operations, and the issue should be investigated by examining potential causes of insufficient memory. -
Further view the system's virtual memory usage with the Use the
vmstatcommand. If the si and so values are also high, it indicates that the system frequently performs page swapping operations, suggesting insufficient physical memory.Plain Text1 si: The size written from swap area to memory per second, transferred from disk to memory. 2 so: The size written from memory to swap area per second, transferred from memory to disk.
If there is insufficient memory, analyze system and process memory usage further using commands like free and ps. Reboot the application or clear system memory during idle periods of the service.
Analysis of high network usage
When network usage is high, use a traffic monitoring tool like nethogs to monitor and measure real-time network usage by process. For example, in CentOS 8:
- Install nethogs
yum install -y nethogs
- View the network usage of network interface card
nethogs eth0 Taking the Network Interface Card Named eth0 as An Example