
Configure Linux Analysis Tools atop and kdump
atop
atop is an exceptionally robust monitoring tool for Linux servers.
It periodically records the system's status, collecting data on resource usage (CPU, memory, disk, network) and process activity.
The data is stored as log files on disk. In case of server issues, you can analyze the situation using these atop logs.
Install atop
Taking CentOS 7/8 as an example, run the following commands:
yum install -y atop
atop configuration
The atop configuration file is /etc/sysconfig/atop,
Parameter description:
LOGINTERVAL: Monitoring interval in seconds. By default, data is collected every 600 seconds. It's recommended to set it to 15 seconds for more frequent updates.
LOGGENERATIONS: Log retention duration in days. The default is 28 days. It's advisable to reduce it to 7 days to conserve disk space.
LOGPATH: Log save path. The default path is /var/log/atop/ You can modify the monitor period and log retention time according to the actual situation.
Start and stop atop
After atop installation, it defaults to a stopped status. Execute the following command to start atop:
systemctl start atop It is not recommended to run atop for an extended period in a production environment. You can stop atop after troubleshooting with the following command:
systemctl stop atop
Analyze atop
Once atop starts, its logs are saved in the /var/log/atop directory. Use the following command to review the log files.
atop -r /var/log/atop/atop_20210910 The common commands for atop are as follows.
c: Sort processes by CPU usage in descending order.
m: Sort processes by memory usage in descending order.
d: Sort processes by disk usage in descending order.
a: Sort processes by overall resource usage in descending order.
n: Sort processes by network usage in descending order. Note that this requires installing an additional kernel module, as it's not enabled by default.
t: Move to the next monitoring checkpoint.
T: Move to the previous monitoring checkpoint.
b: Provide a timestamp.
Description of System Resource Monitor Field
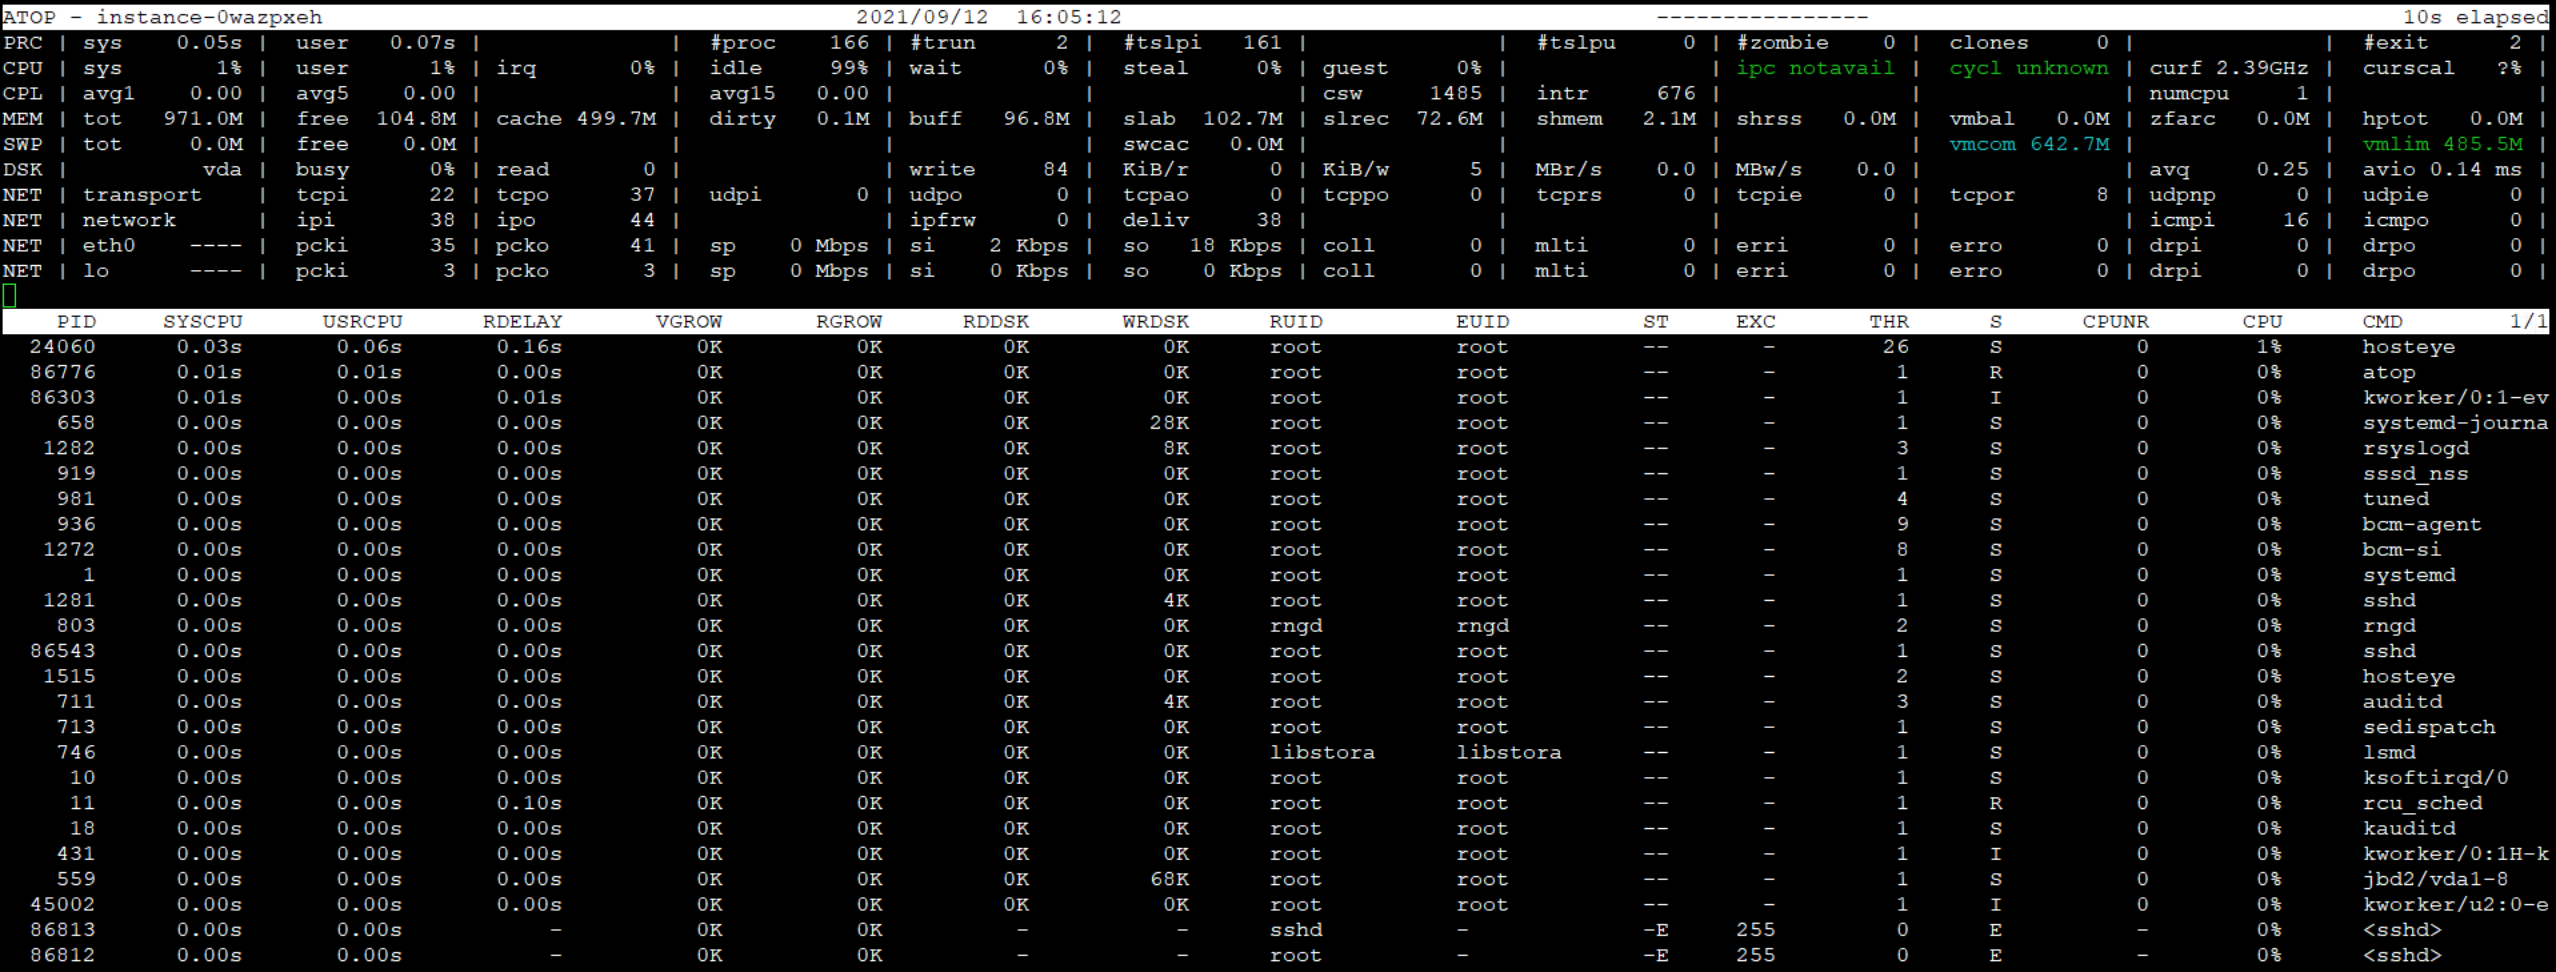
ATOP line: Displays the hostname, sampling date, and timestamp.
PRC line: Shows the overall process execution status.
sys and user: Percentage of CPU time spent by processes in kernel and user modes.
#proc: Total number of processes.
#zombie: Count of zombie processes.
#exit: Number of processes that exited during the ATOP sampling period.
CPU line: Overall CPU usage (i.e., multi-core CPUs as a whole CPU resource). The sum of the values in each field is N00%, where N is the CPU core count
sys and user: Percentage of CPU time spent in kernel and user modes when executing processes.
irq: Percentage of CPU time used for handling interrupts.
idle: Percentage of time the CPU remains completely idle.
wait: Percentage of time the CPU is idle due to processes waiting for disk IO.
CPL line: Represents CPU load status.
avg1, avg5 and avg15: Average number of processes in the running queue over the last 1, 5, and 15 minutes, respectively.
csw: Indicates the total number of context switches.
intr: Indicates the total number of interrupt occurrences.
MEM line: Details memory usage status.
tot: Total capacity of physical memory.
cache: Memory size allocated for page caching.
buff: Memory size allocated for file caching.
slab: Memory size used by the system kernel.
SWP line: Usage of swap space.
tot: Total capacity of the swap space.
free: Amount of available swap space.
PAG line: Virtual memory pagination status
swin and swout: Number of memory pages swapped in and out.
DSK row: Disk usage, with each disk device corresponding to a column. If there is an sdb device, add a line DSK information.
sda: Identifier for the disk device.
busy: Percentage of disk usage.
read and write: Number of read and write operations.
Net row: Multiple columns in the NET section show network status, covering the transport layers (TCP and UDP), IP layers, and active network port details.
XXXi: Number of packets received by each layer or active network port.
XXXo: Number of packets transmitted by each layer or active network port.
kdump
Kdump is an advanced crash dump tool for the kernel that utilizes kexec. It captures crash dumps during kernel failures. When a kernel error occurs (such as system crashes, deadlocks, or freezes), kdump exports the memory as a vmcore file and saves it to disk.
Configure kdump
Take centos 7/8 as an example:
Install kexec-tools
Check if kexec-tools is installed
rpm -qa | grep kexec-tools If not installed, execute the following command to install kexec-tools.
yum install -y kexec-tools
Enable kdump to start at boot
systemctl enable kdump
Set the craskkernel parameter
First, confirm whether the parameter has already been configured.
cat /proc/cmdline | grep crashkernel If displayed, it means that it has been set. If not displayed, it needs to be reset. Edit the /etc/default/grub file
1GRUB_TIMEOUT=5
2GRUB_DISTRIBUTOR="$(sed 's, release .*$,,g' /etc/system-release)"
3GRUB_DEFAULT=saved
4GRUB_DISABLE_SUBMENU=true
5GRUB_TERMINAL_OUTPUT="console"
6GRUB_CMDLINE_LINUX="console=tty0 console=ttyS0,115200 nopti nospectre_v2 nospec_store_bypass_disable"
7GRUB_DISABLE_RECOVERY="true"
Add crashkernel=auto to the GRUB_CMDLINE_LINUX line.
Update grub
Execute the Update grub command for the configuration to take effect:
grub2-mkconfig -o /boot/grub2/grub.cfg
Set the vmcore save path
By default, vmcore files are stored in the /var/crash directory. To save them in a different directory, edit /etc/kdump.conf and change the path line to the desired directory.
1path  vmcore_directory
2 ## Please ensure that the specified path has sufficient space to save vmcore, with recommended free space no less than the size of physical memory (RAM).
Set vmcore dump level
Check the /etc/kdump.conf file to see if the following settings exist. If they exist, do not add them
core_collector makedumpfile -d 31 -c
-c: Compress the vmcore file,
-d: Exclude invalid memory data. This can be adjusted as needed, with a value of 31 typically being sufficient. This value is derived from the following options.
1zero pages   = 1
2cache pages   = 2
3cache private = 4
4user  pages   = 8
5free  pages   = 16
Set kernel parameters
Update the /etc/sysctl.conf file and add the listed parameters.
1kernel.hardlockup_panic=1
2kernel.panic=5
3kernel.panic_on_oops=1
4kernel.softlockup_panic=1
5kernel.unknown_nmi_panic=1
6kernel.nmi_watchdog=1
7 ---The following are optional parameters---
8kernel.panic_on_io_nmi=1
9kernel.panic_on_warn=1
Reboot the system
reboot