
View Cluster
Updated at:2025-10-27
Once the cluster is created, you can access its details page to view and manage cluster information, including basic details, connectivity, advanced configurations, and monitoring.
View basic cluster information
Operation steps
- Log in to Cloud Container Engine Console (CCE).
- In the left navigation bar, click on the cluster list.
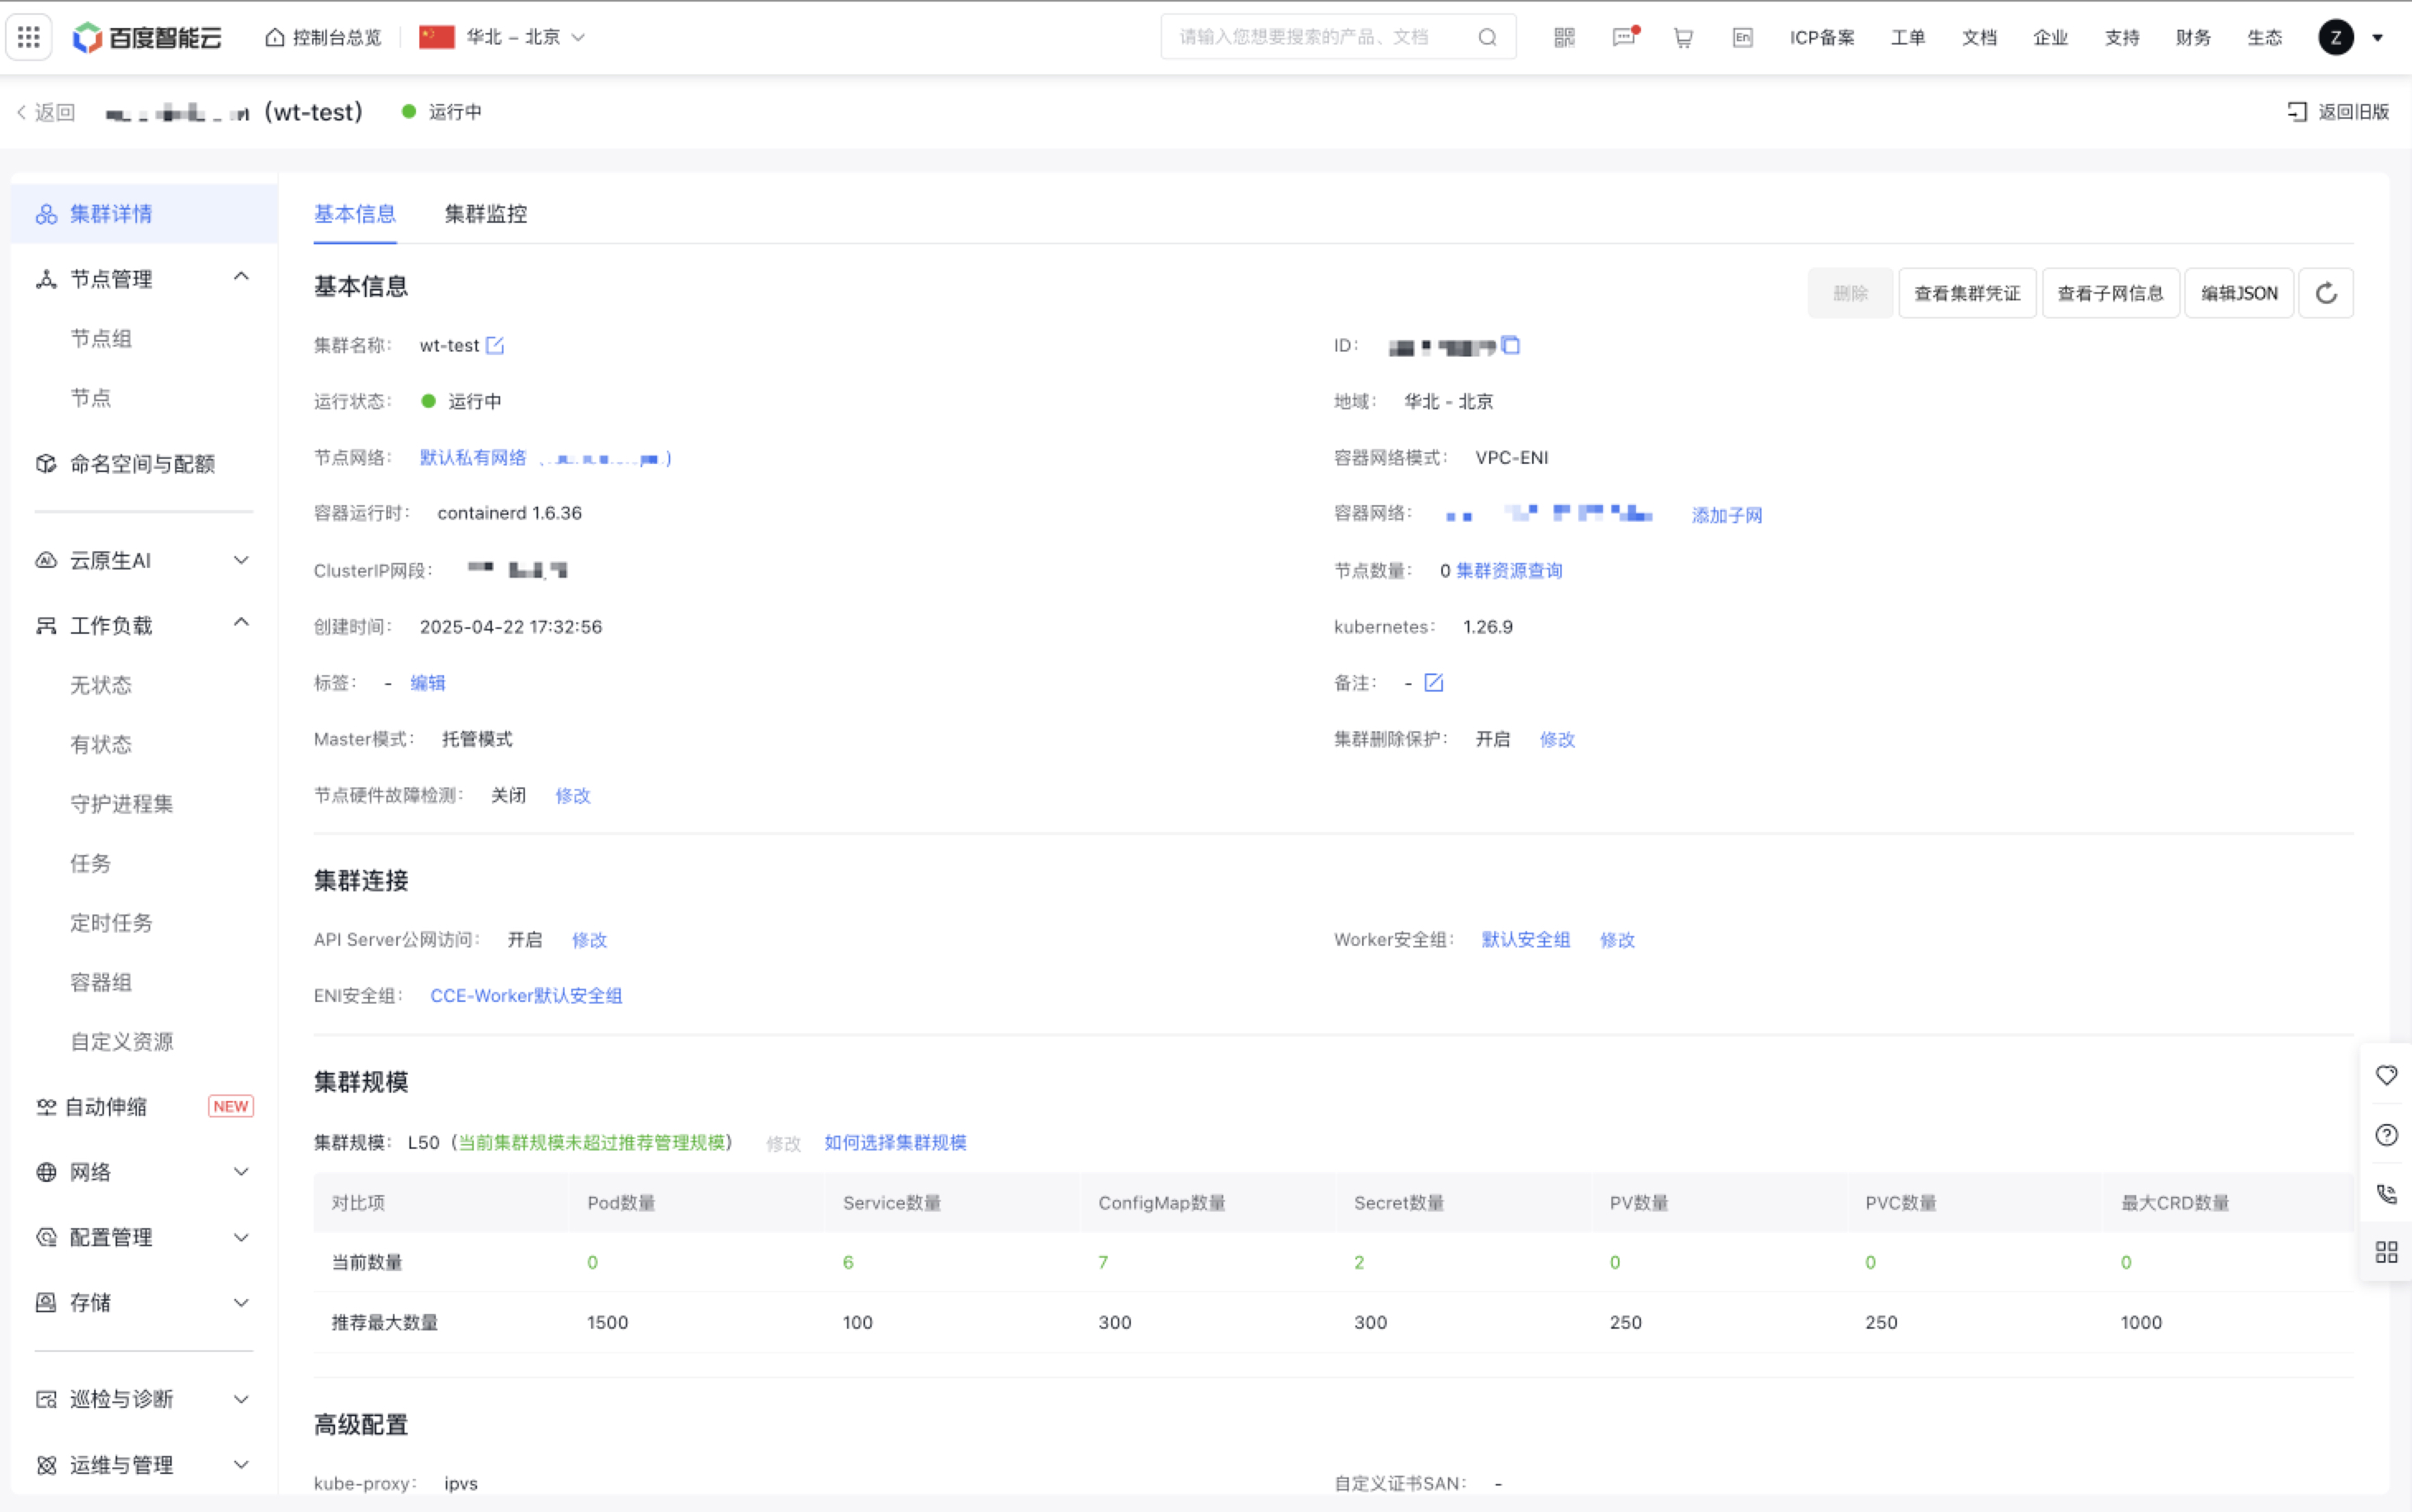
- In the cluster list page, click the Target Cluster to access the Cluster Details page, then select the Basic Information tab to view basic information.
View cluster monitoring
Prerequisites
- The CCE cluster has been successfully created. For the creation methods, refer to Create Cluster.
- The Baidu AI Cloud Prometheus Service has been activated. You may log in to the Prometheus Service Console to confirm its activation status.
Operation steps
- Sign in to Cloud Container Engine Console (CCE).
- In the left navigation bar, click on the cluster list.
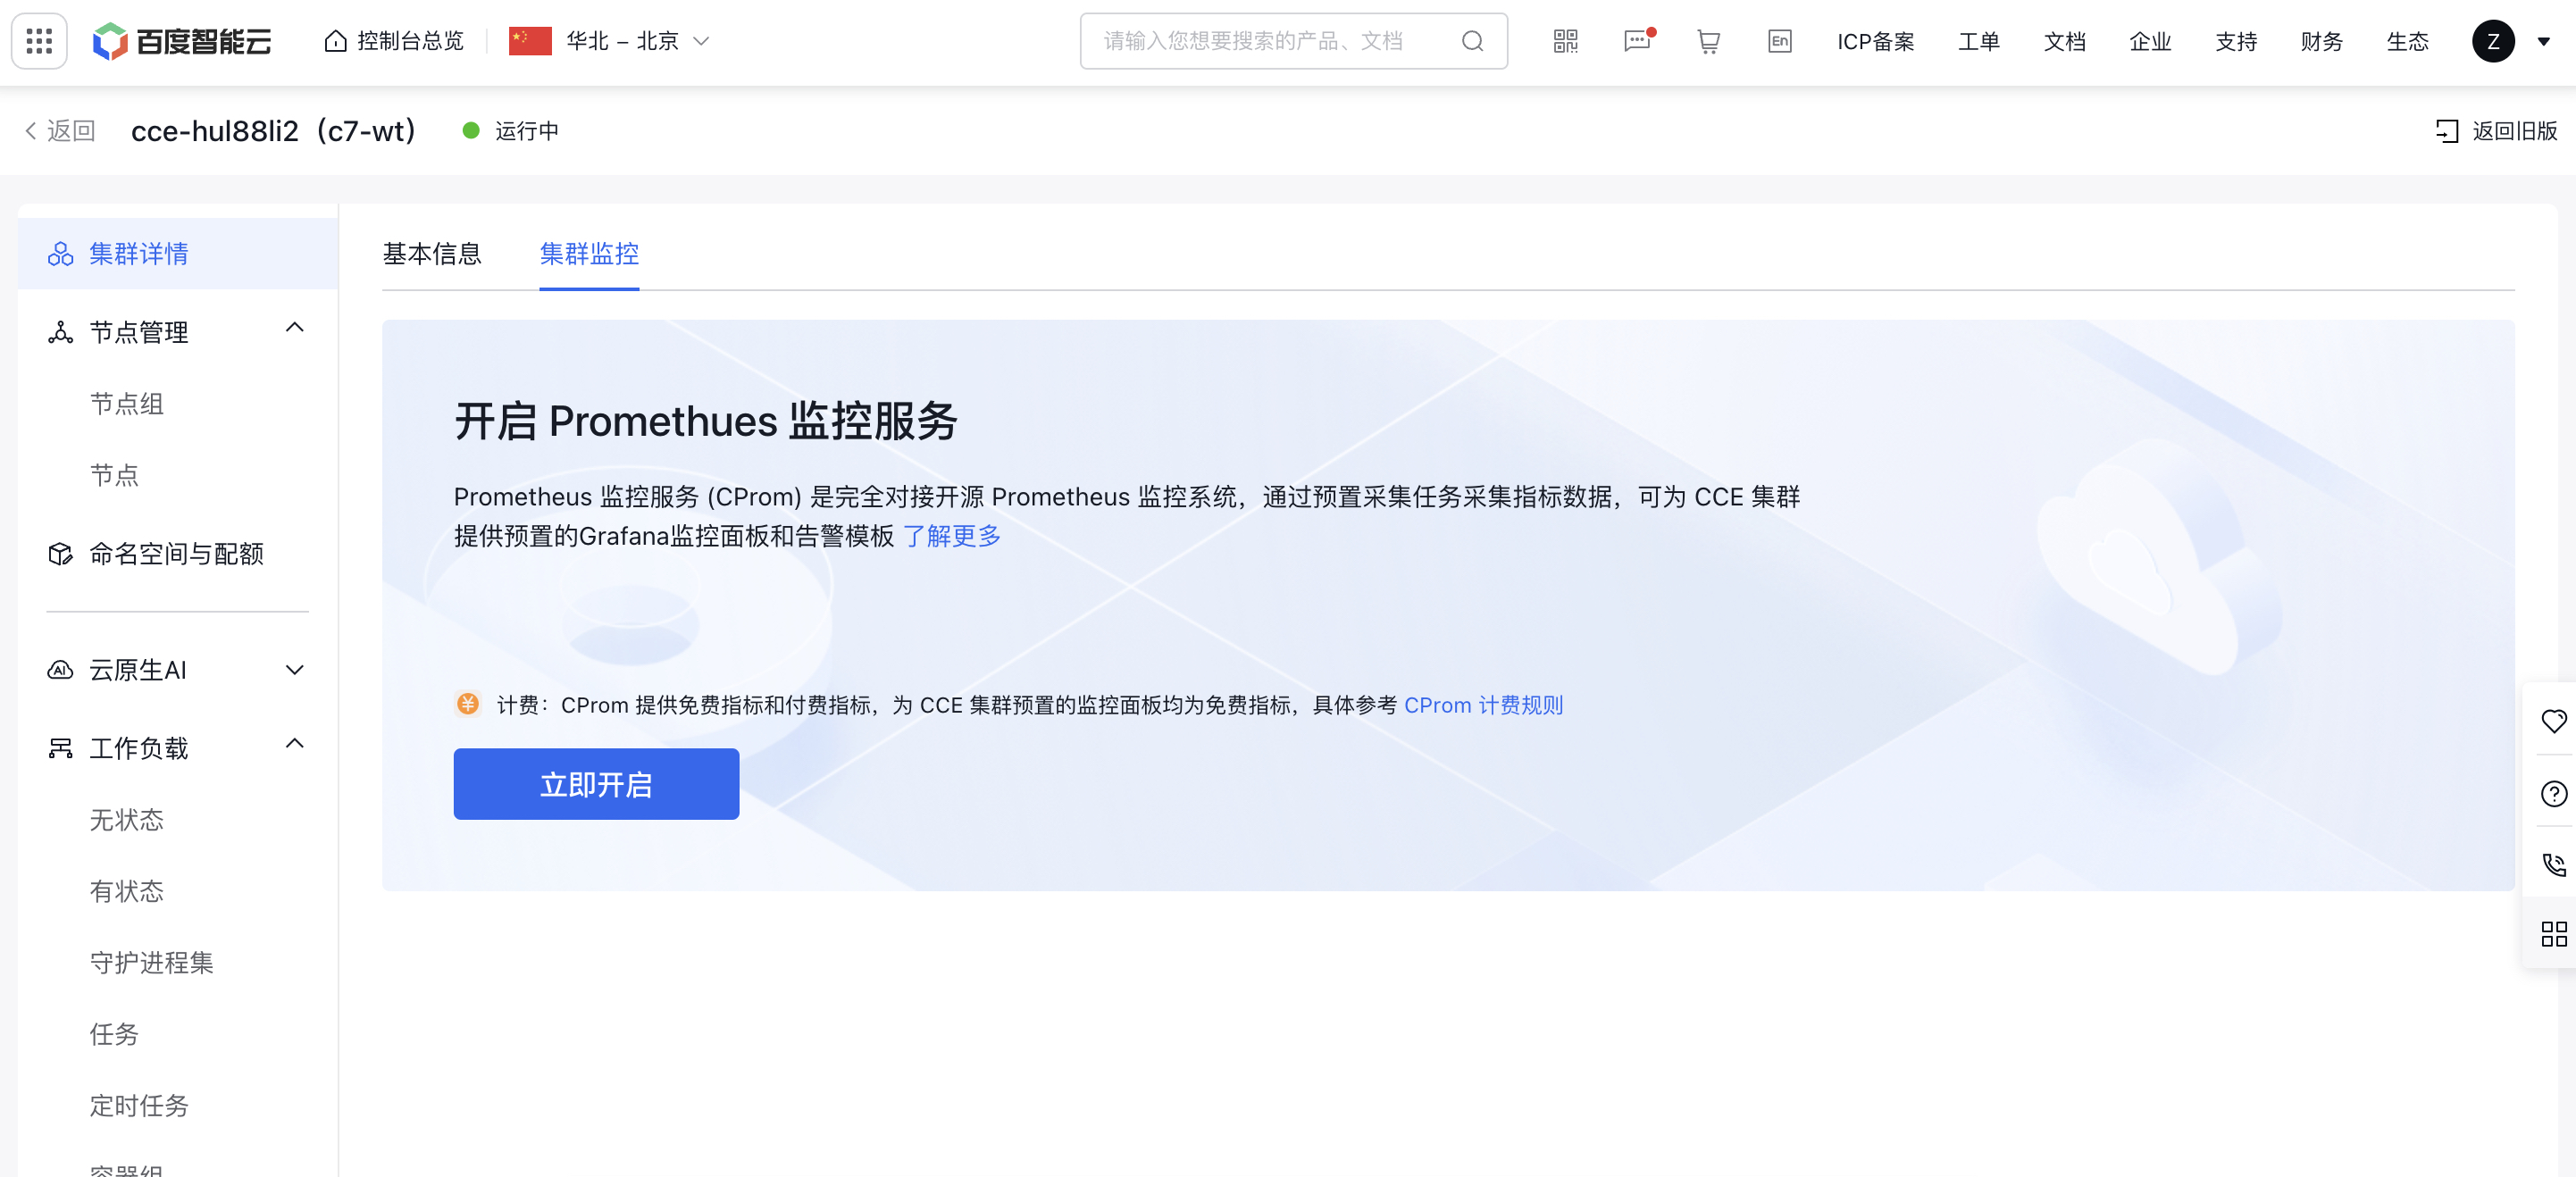
- In the cluster list page, click the Target Cluster to access the Cluster Details page, then select the Cluster Monitoring tab.
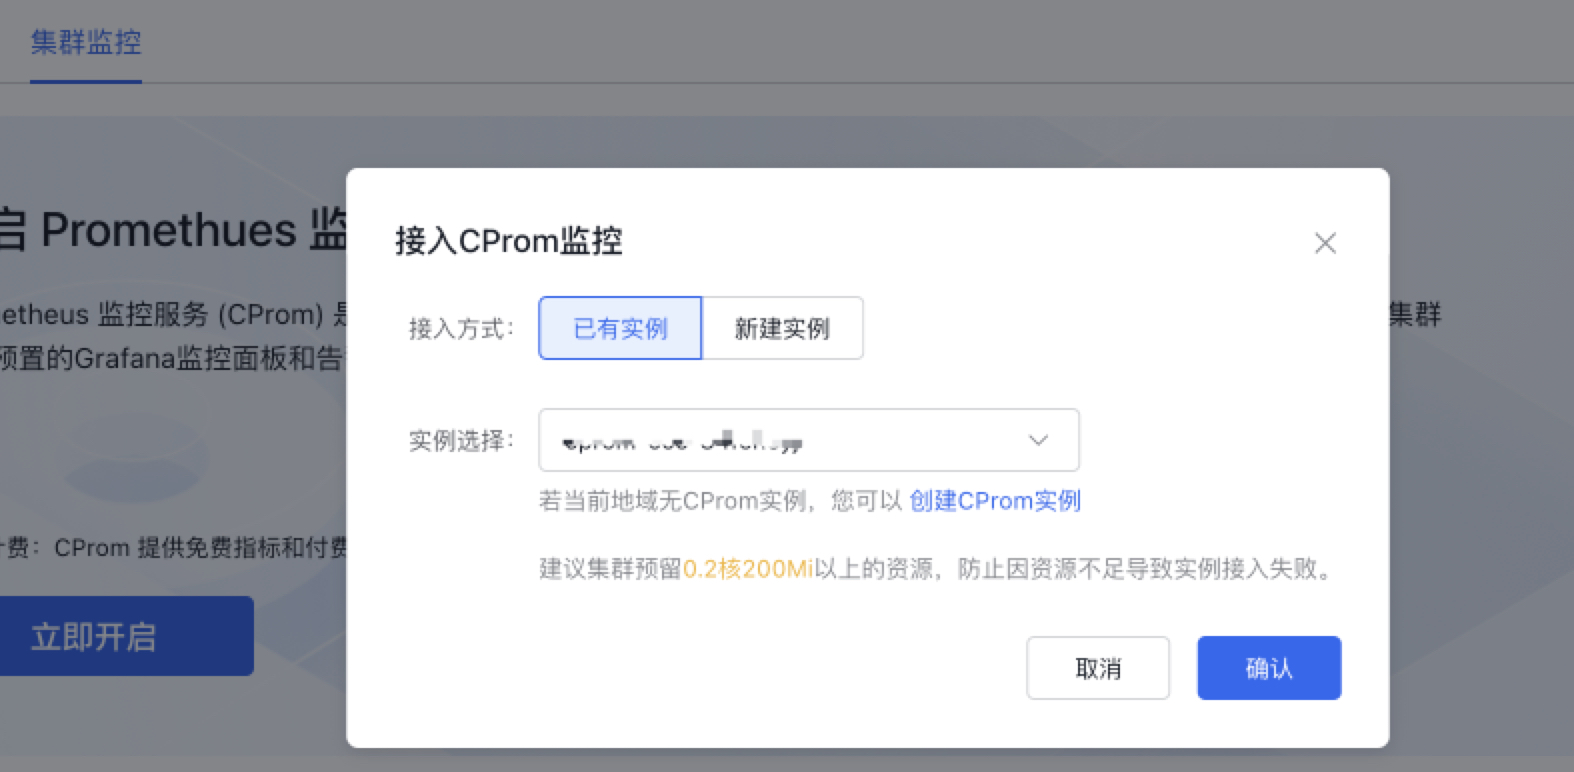
- Click Enable Now to open the CProm Monitor pop-up window. You can either integrate with an existing monitor instance in the same region as the CCE cluster or create a new monitor instance. Click OK to complete the configuration.
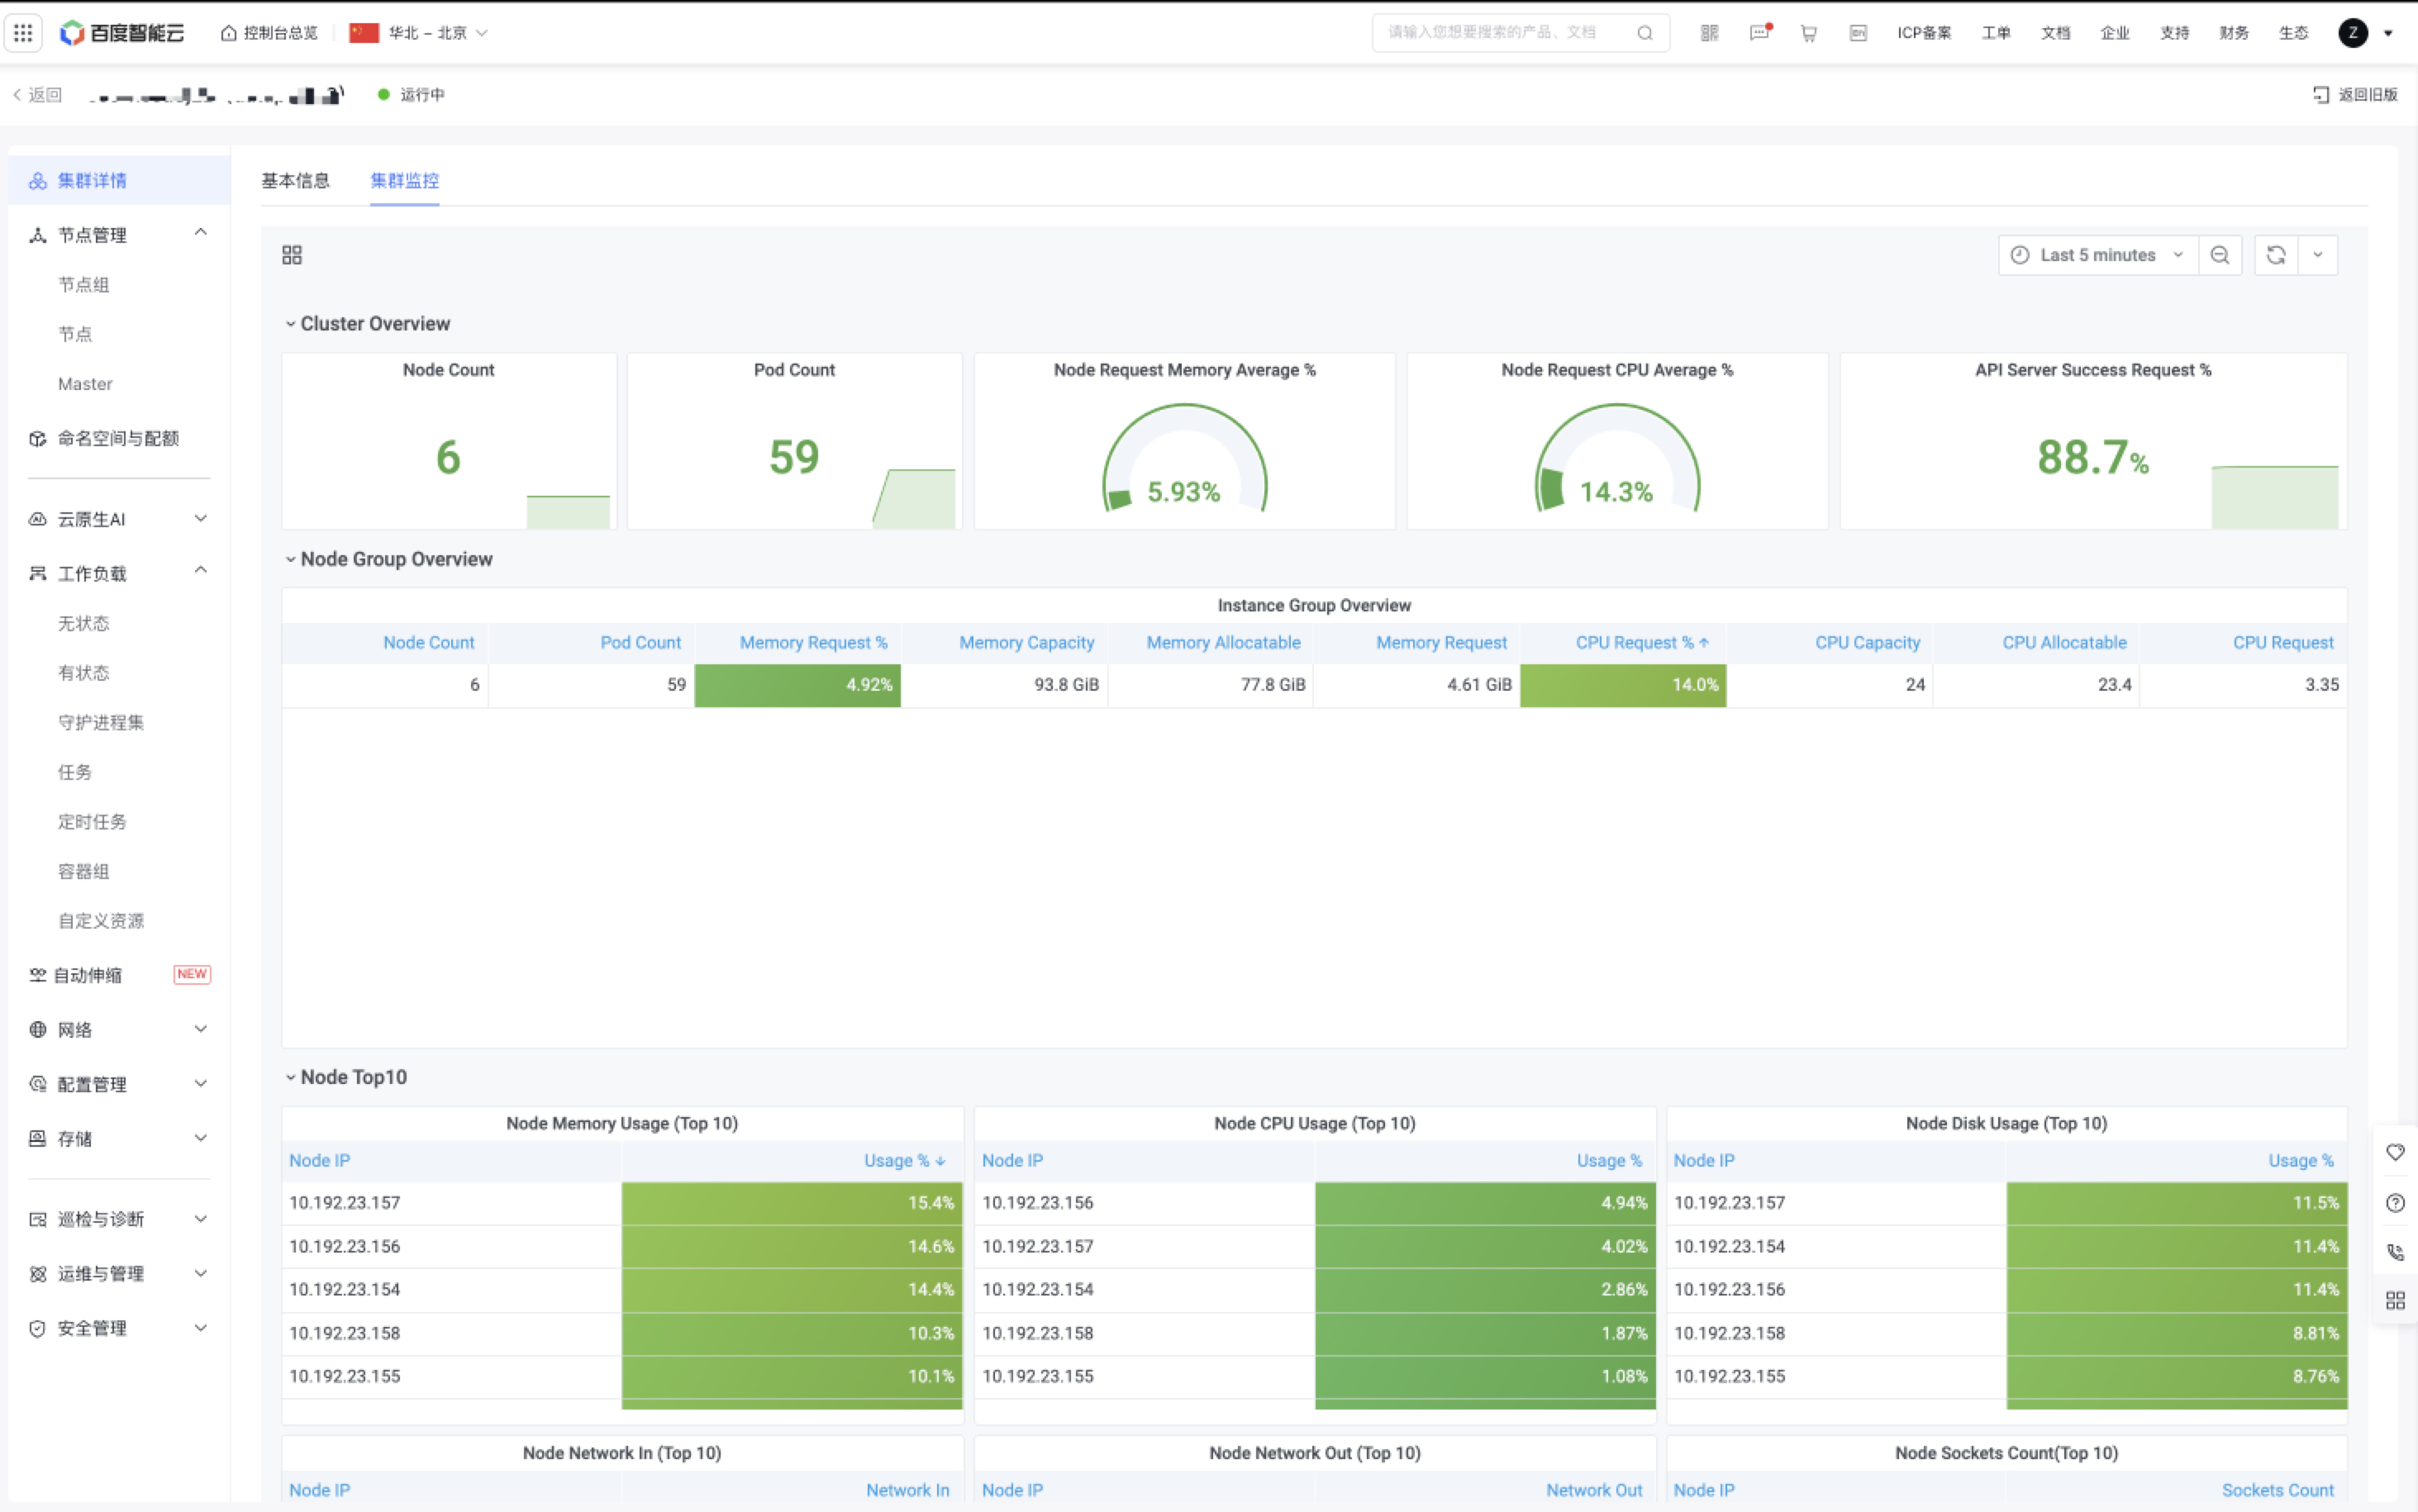
- After connecting to the CProm instance, the console will automatically install the necessary components and check the monitoring dashboard. Once installed, you can click on each tab to view the relevant monitoring data.
Description
- When connecting to a CProm instance, the system will automatically install monitoring components in the CCE cluster. These components collect various metrics from the CCE cluster. Note that installation will consume some resources, so it's recommended to allocate resources of at least 0.2 cores and 200Mi to avoid access issues caused by insufficient resources.
- Alternatively, you may log in to the Prometheus Service Console to associate CProm instances with CCE clusters. For details, refer to CProm Monitoring Instance Cluster Association.
- After integrating to the CProm instance, collection rules are enabled by default. If you want to collect custom service metrics, you can create custom collection tasks to meet your needs. For details, see Collection Configuration.
View monitor
You can customize the time period to view visualized monitor charts of cluster-related metrics, facilitating mastering cluster status.
Subsequent operations
To configure alert policies for the cluster, you can set up cluster-related alerts in the managed Prometheus alert center. For details, refer to Alert Configuration.