
CCE Node Problem Detector Description
Component introduction
In real Kubernetes cluster usage, nodes may experience various issues that impact overall service availability. Additionally, by default, the Kubernetes control plane does not promptly detect node anomalies, leading to instances being scheduled to unavailable nodes. Cluster users often are not immediately aware of node or instance failures, delaying corrective actions. When such failures occur, users expect the platform to enable automatic fault recovery, such as migrating instances from fault nodes.
Node-Problem-Detector enhances the cluster's node fault detection capabilities. When users install this component in the cluster, it operates as a DaemonSet to monitor real-time node anomalies and reports results to the upstream Kube-APIServer.
Component function
- Provide node fault detection capabilities
-
Supported fault reporting methods include
- Node condition: Pod may not be able to run on this node
- Event: Temporary issues affecting the node, but meaningful for system diagnosis
- Metrics: Prometheus metrics are generated for both of the above scenarios, available for collection and display
Limitations
- Cluster version 1.18.9 or higher
Install component
- Sign in to the Baidu AI Cloud official website and enter the management console.
- Go to Product Services - Cloud Native - Cloud Container Engine (CCE) to access the CCE management console.
- Click on Cluster Management > Cluster List in the left navigation bar.
- Click on the target cluster name in the Cluster List page to navigate to the cluster management page.
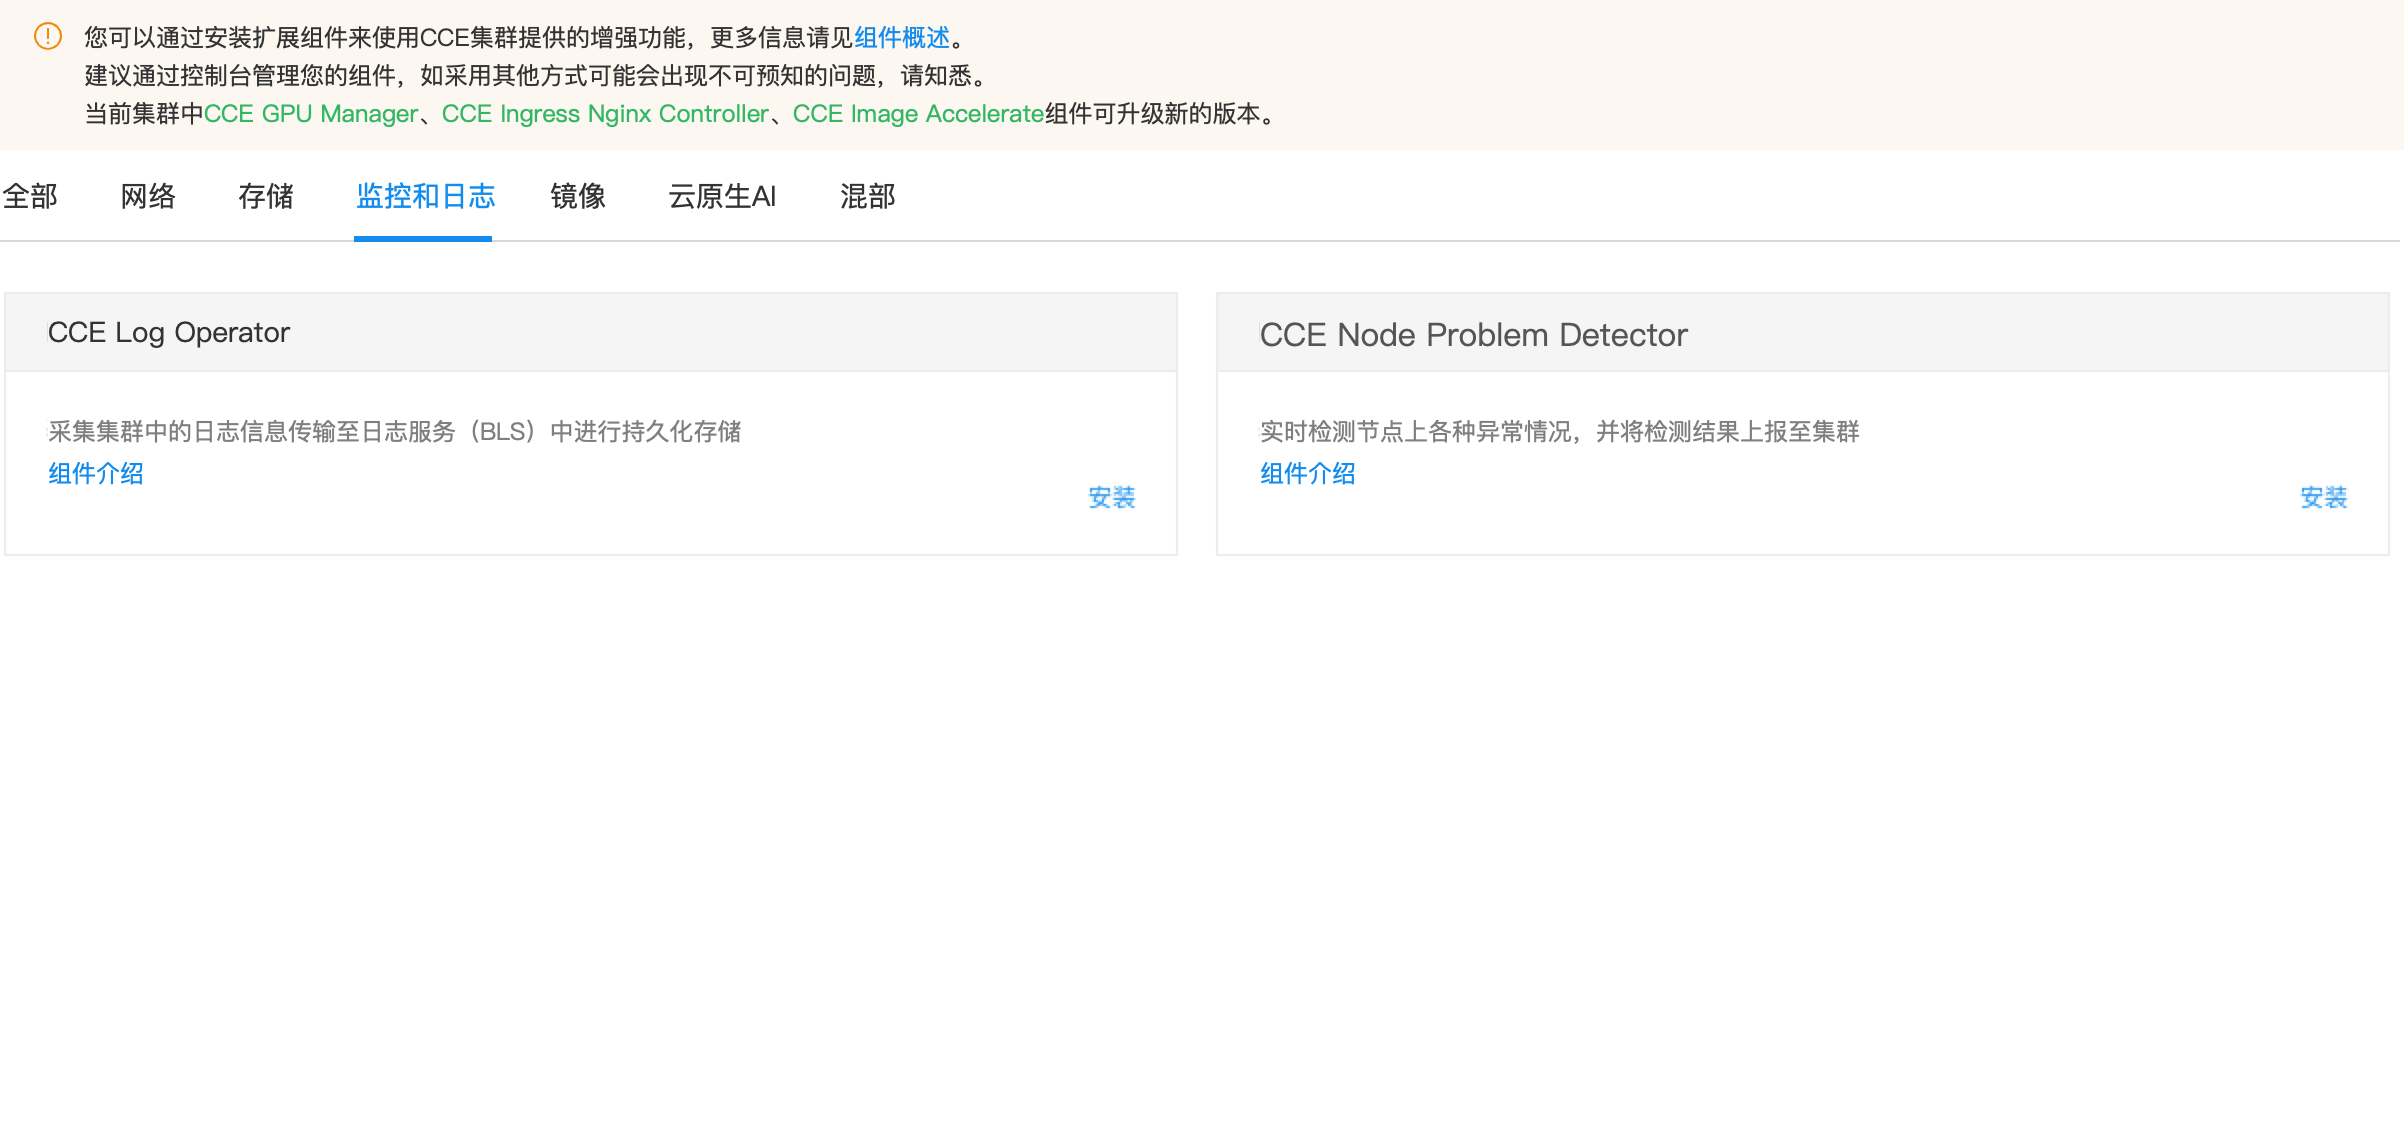
- On the Cluster Management page, navigate to Component Management.
- In the component management list, find the CCE Node Problem Detector component and click Install.
- Click the OK button to finalize the component installation.
View cluster health check status
After installing the component, you can view fault statuses on the node health check interface.
- Sign in to the Baidu AI Cloud Official Website and enter the management console.
- Go to Product Services - Cloud Native - Cloud Container Engine (CCE) to access the CCE management console.
- Click on Cluster Management > Cluster List in the left navigation bar.
- Click on the target cluster name in the Cluster List page to navigate to the cluster management page.
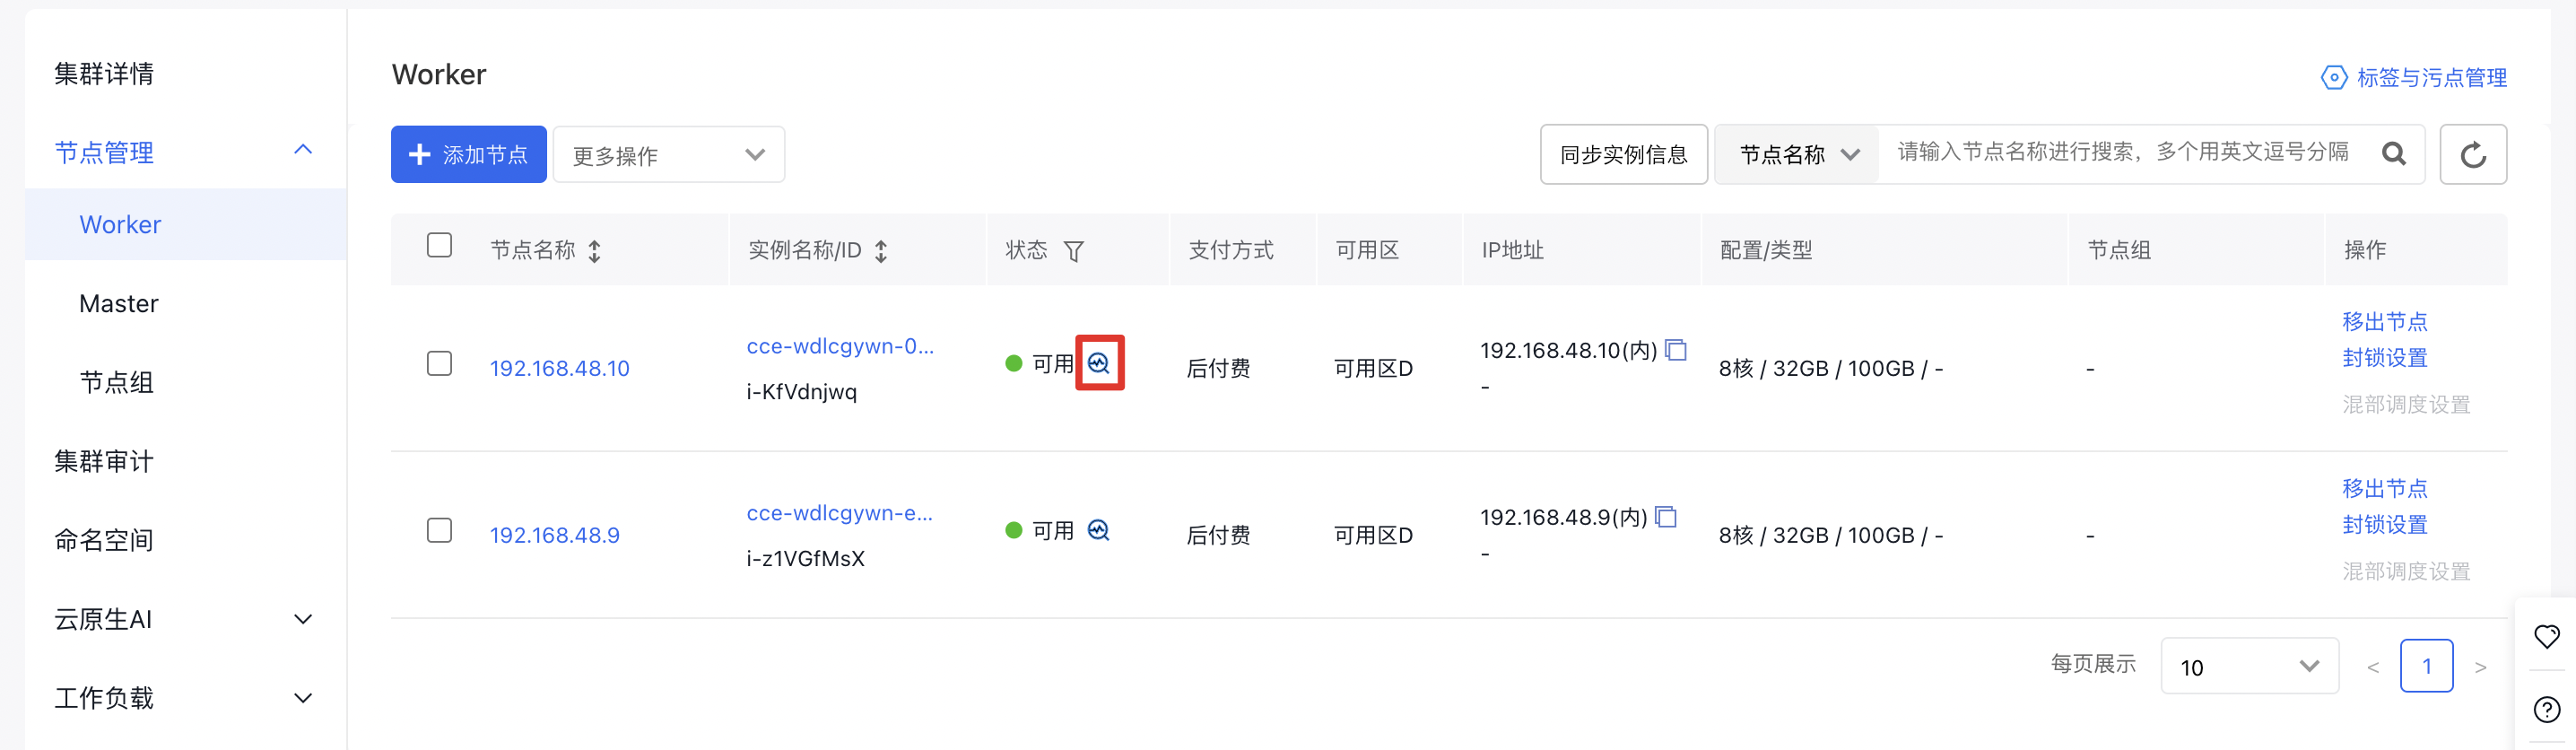
- On the Cluster Management page, go to Node Management > Worker to access the node management interface.
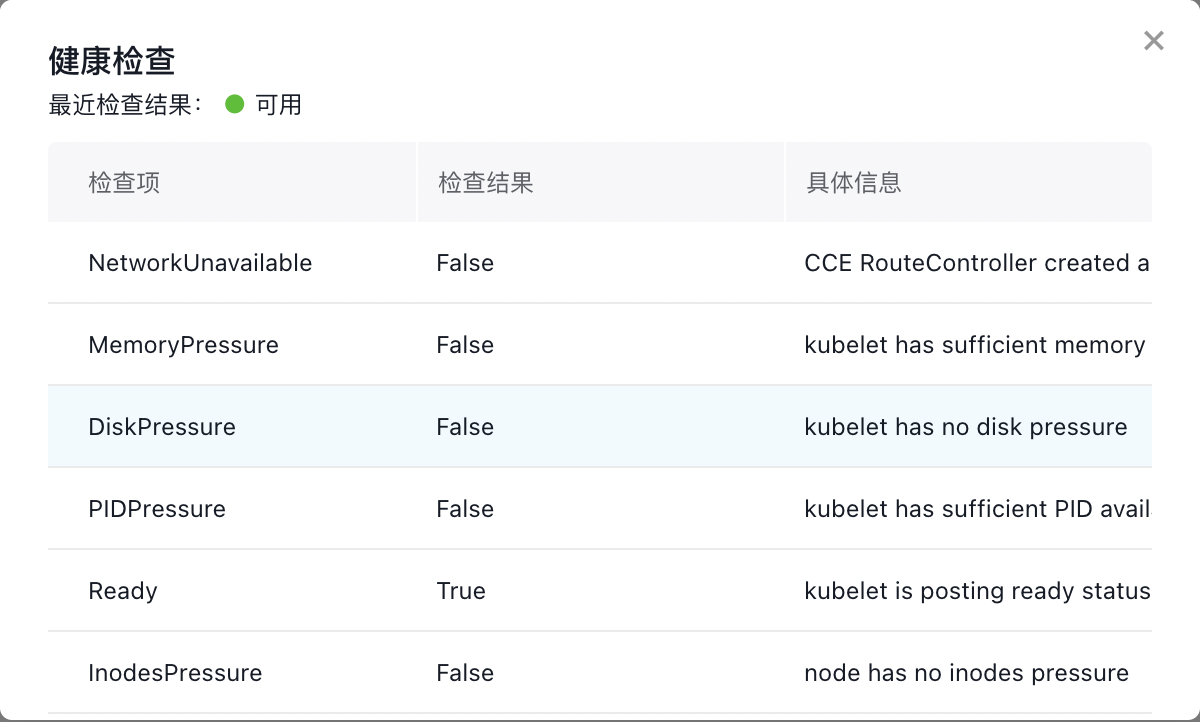
- Click the Health Check icon to display the node’s health check status:
- Review the health check statuses. Currently, only NetworkUnavailable and Ready states affect node availability.
Fault status
Node Conditions
After installing CCE-Node-Problem-Detector, the following conditions will be added to nodes:
| Condition Type | Default value | Description | Impact |
|---|---|---|---|
| FrequentKubeletRestart | False | Whether Kubelet has restarted more than 5 times within 20 min | Affect container creation |
| FrequentContainerRuntimeRestart | False | Whether Docker or Containerd has restarted more than 5 times within 20 min | Affect container creation |
| ContainerRuntimeUnhealthy | False | Whether the node's container runtime is available | Affect container creation |
| CorruptDockerOverlay2 | False | Docker Overlay2 file system errors | Affect the normal operation of Docker runtime |
| InodesPressure | False | Whether node Inode usage exceeds 80% | Affect directory/file creation |
| KernelDeadlock | False | Whether there is a deadlock in the kernel | Container creation, deletion and operation may be affected |
| ReadonlyFilesystem | False | Whether the file system is read-only | Processes cannot create new directories/files or perform write operations |
| GPUUnhealthy | False | Whether there is GPU fault (EBC models with GPUs only) | 1. GPU fails and unavailable; 2. GPU training/inference tasks may be interrupted |
| NICUnhealthy | False | Whether there is a network interface card fault (EBC models with GPUs only) | 1. Network communication may be interrupted between nodes/Pods; 2. GPU training/inference tasks may be interrupted |
| MemoryUnhealthy | False | Whether there is a memory fault (EBC models only) | Memory unavailable, task interrupted |
Introduction to the EBC model fault detection
For elastic baremetal compute (EBC), Node-Problem-Detector integrates with Baidu AI Cloud’s hardware awareness component HAS-agent, adding hardware health detection capabilities for GPU/RDMA network interface cards/CPUs/memory, etc.
Prerequisites
- The Baidu AI Cloud’s hardware awareness component HAS-agent is installed on the machine.
GPU detection
| Detection dimension | Description | Handling methods |
|---|---|---|
| GPU drop out | GPU drop out, with GPU scenario unrecognized | Update Node Condition, GPUUnhealthy: True |
| GPU memory | Scenarios such as EccError and RemappedPending | Update Node Condition, GPUUnhealthy: True |
| GPU chain | Scenarios such as Nvlink failure or bandwidth anomalies | Update Node Condition, GPUUnhealthy: True |
| XID | Xid fault of Nvidia GPU | Handling varies by XID as follows: 1. For XIDs 48, 62, 64, 74, 79, 95, 109, 122, 123, 124: Update Node Condition (GPUUnhealthy: True); 2. For other XIDs not listed above: Only print events |
| Other faults | Scenarios like overheating, abnormal power consumption, or drive anomaly | Update Node Condition, GPUUnhealthy: True |
CPU/memory detection
| Detection dimension | Description | Handling methods |
| CPU | Common scenarios such as CPU Cache read/write errors | Only print events |
| Memory | Common scenarios like unrecoverable ECC faults | Updates Node Condition, MemoryUnhealthy: True |
| Scenarios like recoverable ECC error storms and isolatable faults | Only print events |
Network interface card detection
| Detection dimension | Description | Handling methods |
|---|---|---|
| RDMA network interface card up/down | Frequent RDMA network interface card up/down | Update Node Condition, NICUnhealthy: True |
| RDMA network interface card slowdown | RDMA network interface card pcie slowdown, failing to reach design speed | Update Node Condition, NICUnhealthy: True |
Implement a fault alarm using monitor metrics
Introduction to Node-Problem-Detector metrics
Node-Problem-Detector exposes the following Prometheus metrics:
| Metric name | Metric type | Metric description |
|---|---|---|
| problem_counter | counter | The number of faults that have occurred at the current moment |
| problem_gauge | gauge | Whether a specific type of fault exists at the current moment |
The LabelSet included in the metric is as follows:
- instance: Fault node
- namespace: The namespace where the NPD instance is deployed
- type: Fault type, corresponding to Node Condition Type
- reason: Fault reason, corresponding to Node Condition Reason
- region: The region where the node is located
Users can configure Prometheus monitors and alerts based on the above metrics as needed;
Add metric collection task for Node-Problem-Detector in CProm
Before adding metric collection rules for Node-Problem-Detector in CProm, you need to associate the K8S Cluster CCE with a CProm instance and add a metric collection task first. Operation references:
Add the following metric collection task:
1job_name: node-problem-detector
2scrape_interval: 3s
3kubernetes_sd_configs:
4  - role: endpoints
5relabel_configs:
6  - source_labels: [ __meta_kubernetes_service_annotation_npd_prometheus_scrape ]
7    action: keep
8    regex: true
9  - source_labels: [ __meta_kubernetes_service_annotation_npd_prometheus_scheme ]
10    action: replace
11    target_label: __scheme__
12    regex: (https?)
13  - source_labels: [ __meta_kubernetes_service_annotation_npd_prometheus_path ]
14    action: replace
15    target_label: __metrics_path__
16    regex: (.+)
17  - source_labels: [ __address__, __meta_kubernetes_service_annotation_npd_prometheus_port ]
18    action: replace
19    target_label: __address__
20    regex: ([^:]+)(?::\d+)?;(\d+)
21    replacement: $1:$2
22  - source_labels: [ __meta_kubernetes_endpoint_node_name ]
23    action: replace
24    target_label: node
25  - source_labels: [ __meta_kubernetes_namespace ]
26    action: replace
27    target_label: namespace
28  - source_labels: [ __meta_kubernetes_service_name ]
29    action: replace
30    target_label: service
31  - source_labels: [ __meta_kubernetes_pod_name ]
32    action: replace
33    target_label: pod
Version records
| Version No. | Cluster version compatibility | Update time | Update content | Impact |
|---|---|---|---|---|
| 0.8.25 | v1.18+ | 2024-03-21 | The component adds fault detection for machine gid sequence jumps | -- |
| 0.8.24 | v1.18+ | 2024-03-01 | The component adds Kubelet fault detection ; support configuring to disable bce-instance-id in Metrics Labels ; optimize component configuration |
-- |
| 0.8.23 | v1.18+ | 2024-01-08 | Adapt to ubuntu 22.04 OS ; update the base image to reduce the image size 2 G -> 278 M ; remove dependencies on the systemctl command ; optimize dependencies on container runtime (docker and containerd) |
-- |
| 0.8.22 | v1.18+ | 2023-12-28 | Optimize MPS fault detection performance, and support detection based on the user who starts the mps-server ; provide an MPS fault detection switch (disabled by default, can be enabled on demand) ; users who have already used MPS detection need to re-enable MPS detection after upgrading |
-- |
| 0.8.21 | v1.18+ | 2023-12-27 | The data source for network interface card fault detection is connected to has-agent ; support configuring to ignore expected Xids when detecting GPU Xid faults |
-- |
| 0.8.20 | v1.18+ | 2023-12-07 | Support MPS fault detection and monitor | -- |
| 0.8.19 | v1.18+ | 2023-11-30 | Fault detection collection tasks support collecting the short ID of the instance corresponding to the node | -- |
| 0.8.18 | v1.18+ | 2023-11-23 | Optimize NPD deployment affinity configuration and monitor configuration | -- |
| 0.8.17 | v1.18+ | 2023-11-20 | Optimize the timeout duration for memory fault monitor ; fix the error when accessing has-agent on non-EBC nodes where NPD is deployed but no HAS service exists |
-- |
| 0.8.16 | v1.18+ | 2023-10-17 | The data source for GPU Xid fault detection is connected to has-agent, and kernel log retrieval is canceled ; custom ignoring of Xids is not supported in GPU fault detection |
-- |
| 0.8.15 | v1.18+ | 2023-08-11 | Support CPU and memory fault detection, available only for EBC models. Add fault types: CPUUnhealthy and MemoryUnhealthy ; optimize GPU Xid fault detection logic ; optimize RDMA network interface card fault detection logic |
-- |
| 0.8.14 | v1.18+ | 2023-06-03 | Bugfix for network interface card fault detection logic | -- |
| 0.8.13 | v1.18+ | 2023-04-08 | NPD supports GPU fault detection and network interface card fault detection, available only for EBC models. Add fault types: GPUUnhealthy and NICUnhealthy{-1-; introduce community optimization and bugfixe |
-- |
| 0.8.12 | v1.18+ | 2023-03-07 | NPD is released through the component center. The following fault detections are supported: 1. FrequentKubeletRestart 2. FrequentContainerRuntimeRestart 3. ContainerRuntimeUnhealthy 4. CorruptDockerOverlay2 5. InodesPressure 6. KernelDeadlock 7. ReadonlyFilesystem |
-- |