AI Job Scheduler component
Updated at:2025-10-27
The AI Job Scheduler component provides insights into key metrics, queue backlogs, cluster/queue overages, Pod scheduling performance, task scheduling efficiency, and scheduler stage latency.
Prerequisites
- The CCE AI Job Scheduler component has been installed and its version is ≥ 1.7.9
- Accessed monitoring instances
- Collection tasks need to be enabled. For details, refer to the document: Access Monitoring Instance and Enable Collection Tasks
Application method
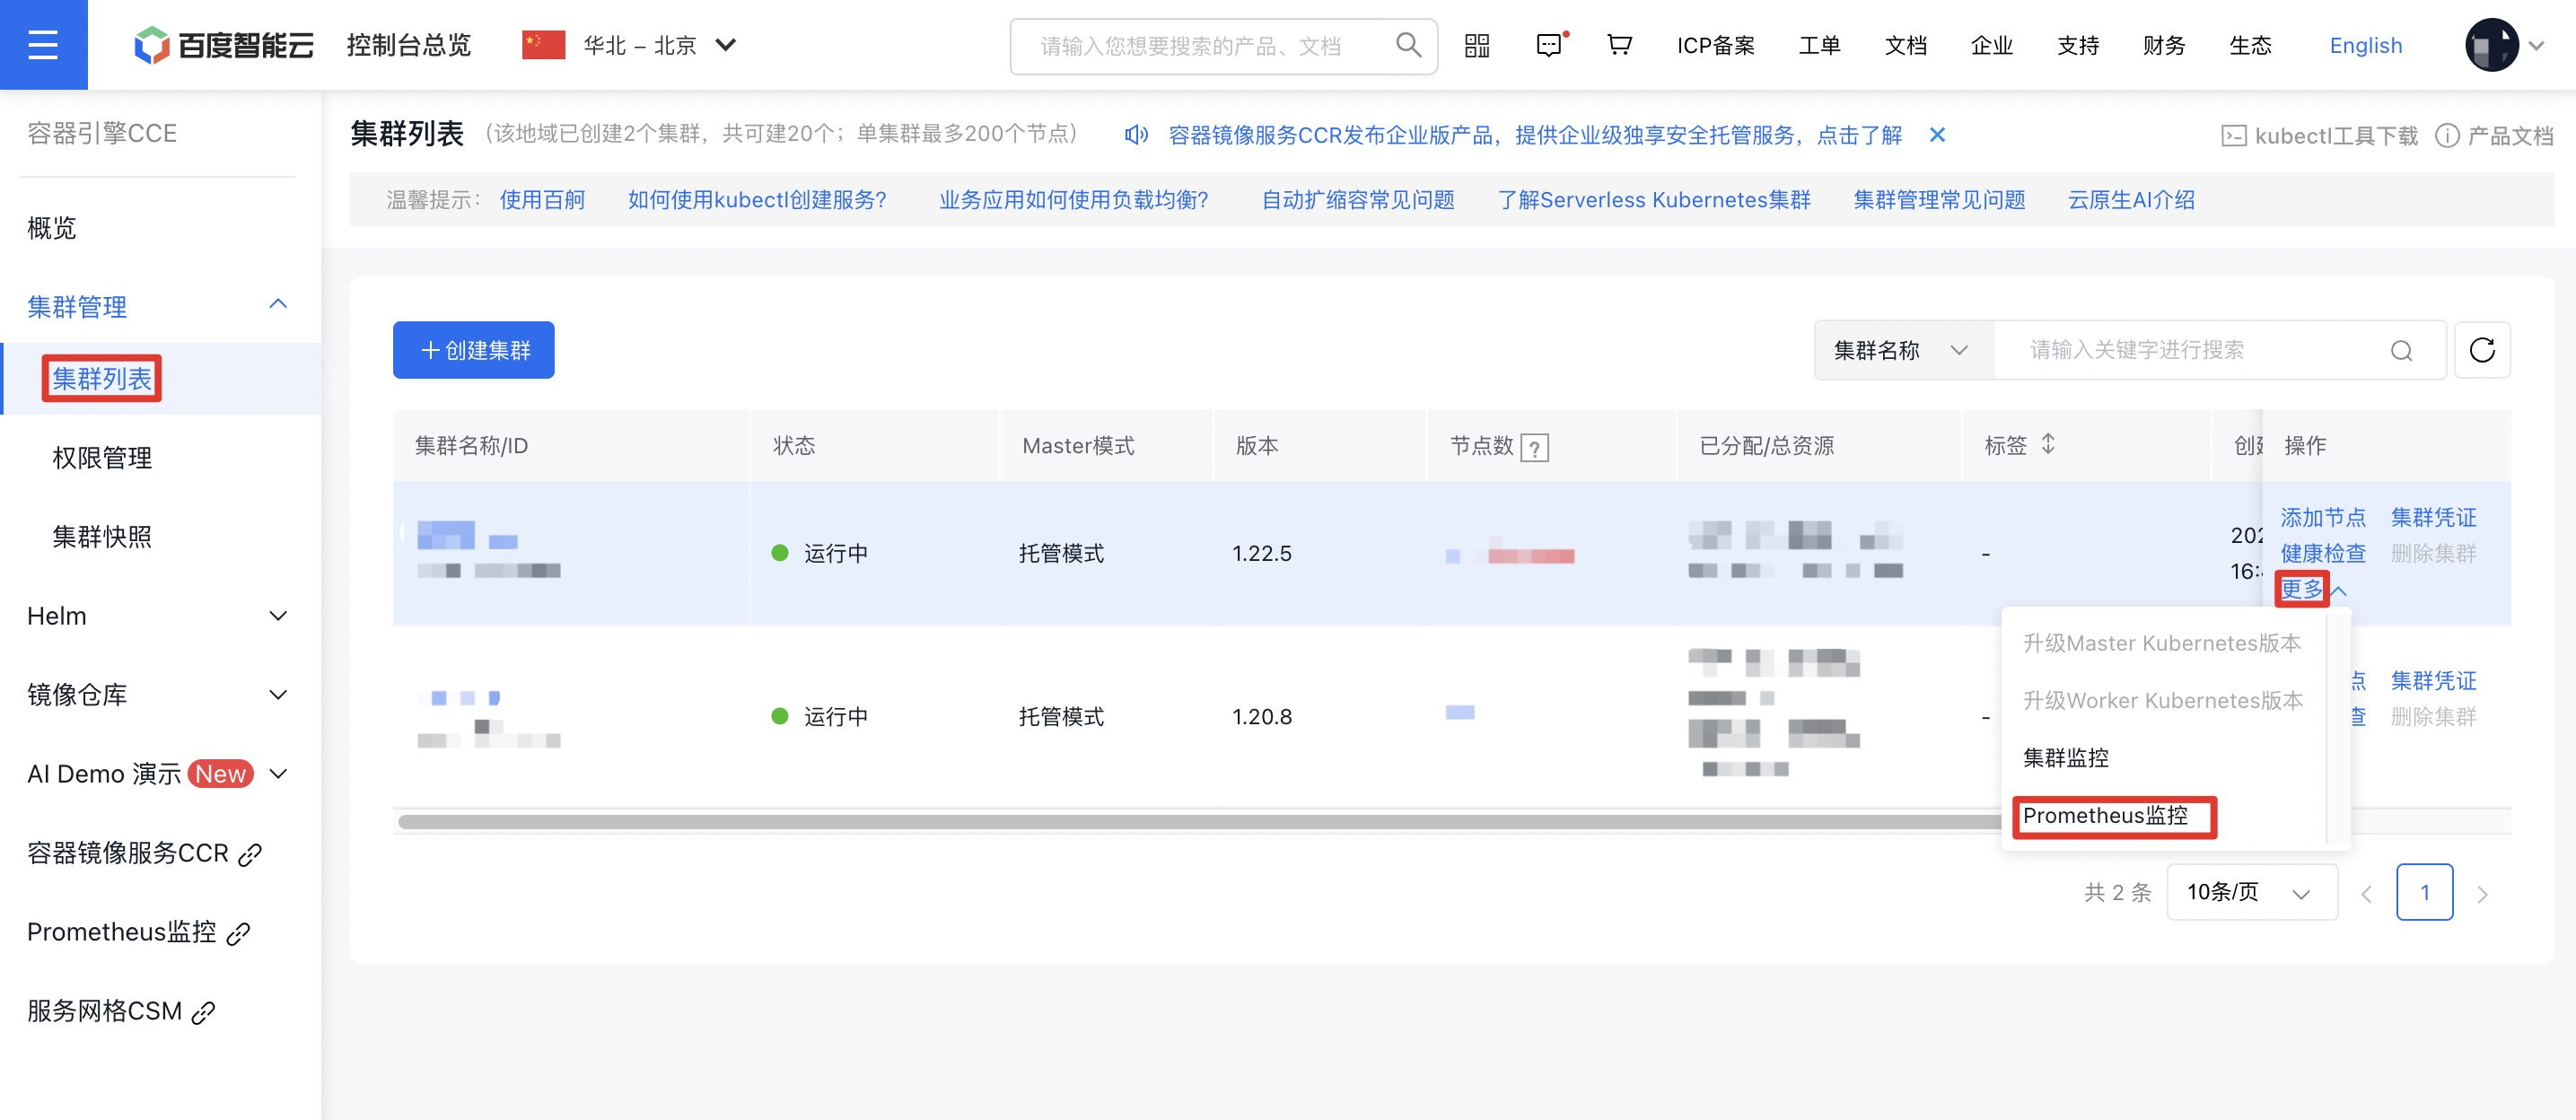
- Sign in to Cloud Container Engine Console (CCE).
- Click Cluster Management on the left sidebar. In the Cluster List, select the Cluster Name you need. Under Actions - More on the right, click Prometheus Monitoring to navigate to the Prometheus Monitoring Service.
- In the options at the bottom of the Prometheus Monitoring Page, select Cloud-Native AI Monitoring, then select AI Job Scheduler Component.
The AI Job Scheduler component is shown as follows
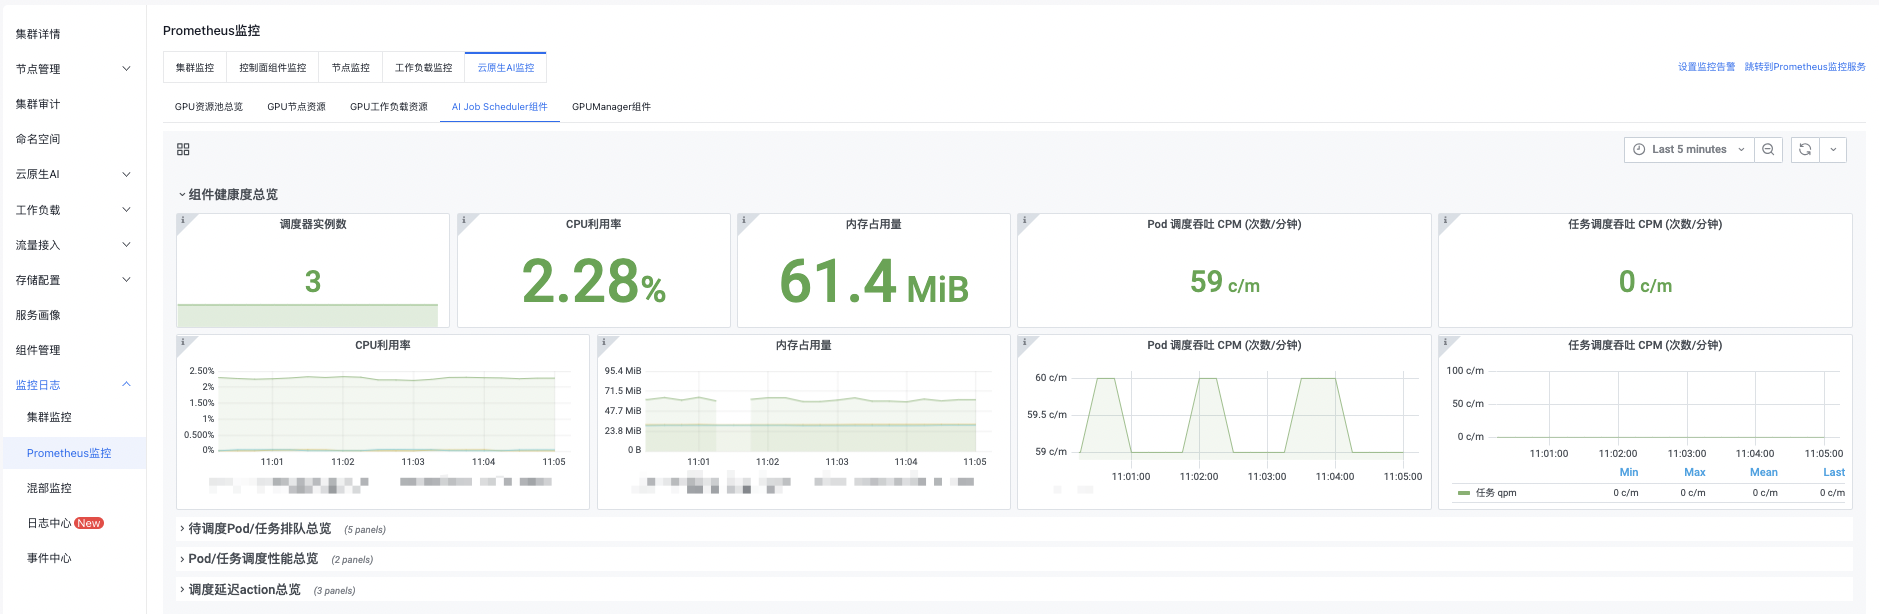
You can click the button in the upper right corner to set monitoring time, manual refresh, and automatic refresh by yourself.
Detailed description of AI Job Scheduler component
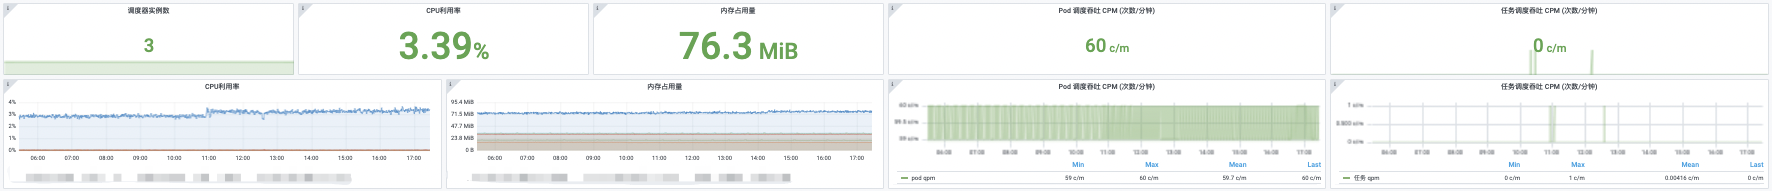
Component health overview
| Monitoring items | Description |
|---|---|
| Scheduler instance count | AI Job Scheduler Pod instances, defaulting to 3 replicas. Metric anomaly: 1-3 scheduler instances indicate normal status, while 0 indicates abnormality. |
| CPU utilization rate | CPU utilization rate of AI Job Scheduler master instance |
| Memory usage | Memory usage of AI Job Scheduler master instance |
| Pod scheduling throughput CPM (counts/minute) | Number of Pods scheduled by the scheduler per minute |
| Task scheduling throughput CPM (counts/minute) | Number of tasks scheduled by the scheduler per minute |
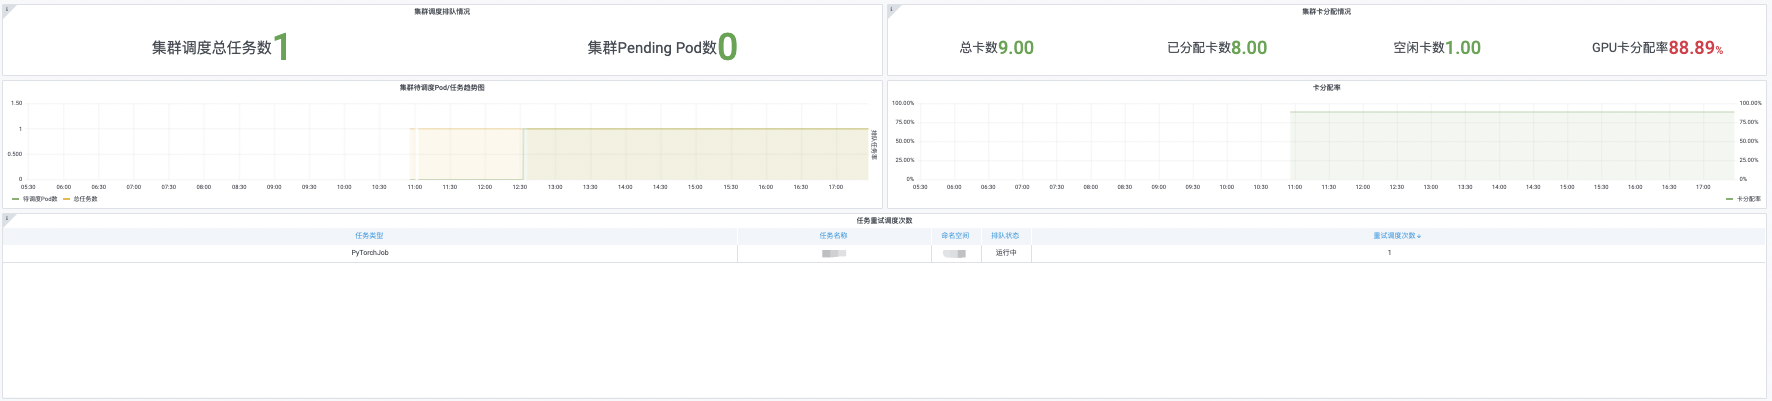
Overview of pending Pod/task queue
| Monitoring items | Description |
|---|---|
| Cluster scheduling queue status | Cluster scheduling task queuing status, which shows pending tasks, queued tasks, total scheduling tasks, pending Pods, and task queuing rate of the cluster. |
| Cluster card allocation | GPU card allocation in the cluster, which shows total GPU cards, allocated GPU cards, idle GPU cards, unavailable GPU cards, and GPU card allocation rate. |
| Cluster pending Pod/task trend chart | Detailed pending Pod/task trends in the cluster, which displays pending Pods, pending tasks, queued tasks, total tasks and task queuing rate. |
| Card allocation rate | Detailed GPU card allocation rate in the cluster. |
| Task retry scheduling count | Number of continuous task scheduling tries by the scheduler, which also includes task type, task name, namespace and queue status. |
Overview of Pod/task scheduling performance
| Monitoring items | Description |
|---|---|
| Task scheduling latency | Time from task creation to task scheduling completion |
| Total Pod scheduling latency | Time from Pod creation to Pod scheduling completion |

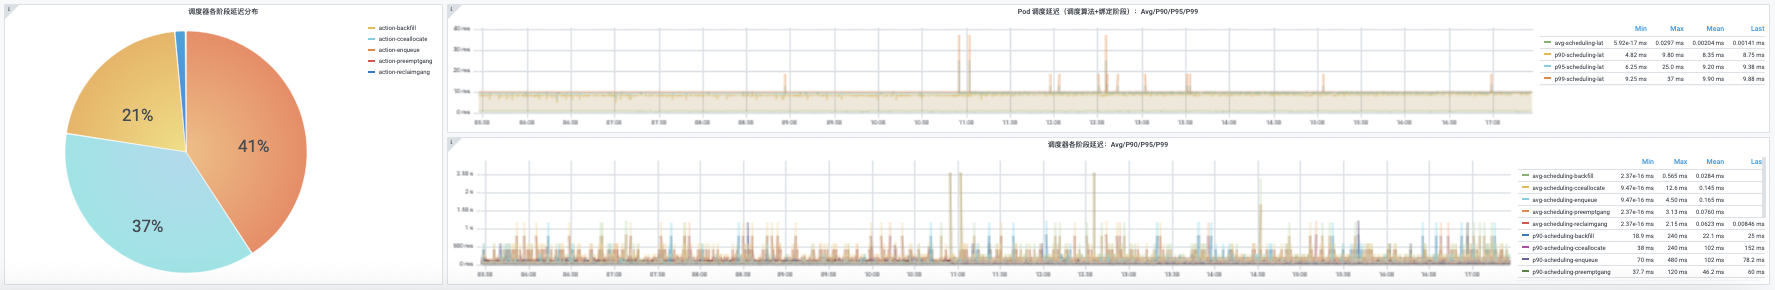
Overview of scheduling latency action
| Monitoring items | Description |
|---|---|
| Scheduler phase latency distribution | Range of scheduler phase latency distribution |
| Pod scheduling latency | Sum of Pod scheduling algorithm + binding phase time |
| Scheduler phase latency | Scheduling time for scheduler phase |