
CCE Dynamic Scheduling Plugin Description
Component introduction
CCE Dynamic Scheduler is a dynamic scheduler plugin implemented based on Kubernetes native Kube-scheduler Extender mechanism. It enables dynamic Pod scheduling based on the actual CPU/memory utilization of nodes. After installing the plugin in a container service K8S Cluster CCE, it uses the scheduler extender mechanism to register Filter and Prioritize hooks with Kube-Scheduler, thereby interfering with the scheduling behavior of the default scheduler. This avoids the problem of uneven node load caused by the native scheduler’s scheduling mechanism based on request and limit. This component requires the Prometheus monitor component and corresponding recording rule settings to function properly. Therefore, you can follow the operations in the Dependency Deployment section of this document to prevent issues where the plugin fails to work correctly.
Functions
The Kubernetes-built-in scheduler, kube-scheduler, is to bind newly created Pods to an optimal node. To achieve this, the scheduler performs a series of filtering and scoring (pre-selection and preference strategies) for one-time scheduling. However, this scheduling has limitations: It cannot make scheduling decisions based on the current and historical actual load of the node, which may result in unreasonable scheduling. The node utilization-related strategies provided in the community scheduler (such as LowNodeUtilization and HighNodeUtilization) use the Pod’s request and limit data instead of the actual node utilization. For example, some nodes in the cluster have more remaining schedulable resources (calculated based on the Pod’s request and limit running on the node), while other nodes have less remaining schedulable resources, but their actual load is relatively low. In such cases, Kube-scheduler will prioritize scheduling Pods to the nodes with more remaining resources (based on the LeastRequestedPriority strategy).
CCE Dynamic Scheduler adds a new strategy for dynamic scheduling "based on actual node load." After installing this component in a cluster, it enables dynamic Pod scheduling based on node metrics collected from Prometheus and user-specified load thresholds.
Application scenarios
Dynamic changes in cluster resources:
- The resource utilization of cluster nodes changes at all times, requiring the CCE Dynamic Scheduler for dynamic scheduling
Limitations
- The cluster version is 1.18.9 or above, and only independent clusters are supported
- The cluster has implemented metric collection through Prometheus
- If you need to upgrade the Kubernetes master version, the upgrade will reset the configurations of all components on the master, thereby affecting the configuration of the Dynamic Scheduler plugin as a Scheduler Extender. Therefore, the Dynamic Scheduler plugin must be uninstalled and reinstalled
Install component
Dependency deployment
The CCE Dynamic Scheduler component bases its dynamic scheduling on nodes' actual loads from current and historical periods. It relies on monitoring tools like Prometheus to gather load information from system nodes. Ensure Prometheus monitoring is configured before using the CCE Dynamic Scheduler component.
Configure Prometheus collection rules
- When using a self-built Prometheus as the monitor data source, users need to deploy two components by themselves, and can refer to the official documentation of the components to complete the deployment:
- After deploying the components, users need to add monitor metric collection tasks for cAdvisor and NodeExporter in Prometheus, as well as configure metric aggregation rules. For specific configurations, please refer to:
1crape_configs:
2  - job_name: "kubernetes-cadvisor"
3    # Default to scraping over https. If required, just disable this or change to
4    # `http`.
5    scheme: https
6
7    # Starting Kubernetes 1.7.3 the cAdvisor metrics are under /metrics/cadvisor.
8    # Kubernetes CIS Benchmark recommends against enabling the insecure HTTP
9    # servers of Kubernetes, therefore the cAdvisor metrics on the secure handler
10    # are used.
11    metrics_path: /metrics/cadvisor
12
13    # This TLS & authorization config is used to connect to the actual scrape
14    # endpoints for cluster components. This is separate to discovery auth
15    # configuration because discovery & scraping are two separate concerns in
16    # Prometheus. The discovery auth config is automatic if Prometheus runs inside
17    # the cluster. Otherwise, more config options have to be provided within the
18    # <kubernetes_sd_config>.
19    tls_config:
20      ca_file: /var/run/secrets/kubernetes.io/serviceaccount/ca.crt
21      # If your node certificates are self-signed or use a different CA to the
22      # master CA, then disable certificate verification below. Note that
23      # certificate verification is an integral part of a secure infrastructure
24      # so this should only be disabled in a controlled environment. You can
25      # disable certificate verification by uncommenting the line below.
26      #
27      insecure_skip_verify: true
28    authorization:
29      credentials_file: /var/run/secrets/kubernetes.io/serviceaccount/token
30
31    kubernetes_sd_configs:
32      - role: node
33
34    relabel_configs:
35      - action: labelmap
36        regex: __meta_kubernetes_node_label_(.+)
37
38  - job_name: 'node-exporter'
39      kubernetes_sd_configs:
40        - role: pod
41      relabel_configs:
42      - source_labels: [__meta_kubernetes_pod_name]
43        regex: 'node-exporter-(.+)'
44 action: keep-
For self-hosted Prometheus setups, configuring metric aggregation rules resembles managed cluster setups. The key difference is that you don't need to include the clusterID dimension in the aggregation rules since it is automatically added by managed Prometheus. Therefore, you can reference the recording rules as follows:
This rule performs automated recording calculations for metrics such as machine_cpu_usage_5m and machine_memory_usage_5m, which the CCE Dynamic Scheduler relies on.
1spec:
2  groups:
3    - name: machine_cpu_mem_usage_active
4      interval: 30s
5      rules:
6        - record: machine_memory_usage_active
7          expr: 100*(1-node_memory_MemAvailable_bytes/node_memory_MemTotal_bytes)
8    - name: machine_memory_usage_1m
9      interval: 1m
10      rules:
11        - record: machine_memory_usage_5m
12          expr: 'avg_over_time(machine_memory_usage_active[5m])'
13    - name: machine_cpu_usage_1m
14      interval: 1m
15      rules:
16        - record: machine_cpu_usage_5m
17          expr: >-
18            100 - (avg by (instance)
19            (irate(node_cpu_seconds_total{mode="idle"}[5m])) * 100)
Install CCE Dynamic Scheduler via Helm
- Log in to the Baidu AI Cloud official website and access the management console.
- Go to Product Services - Cloud Native - Cloud Container Engine (CCE) to access the CCE management console.
- In the left navigation menu, go to Helm > Helm Templates.
- On the Helm Template page, click Baidu AI Cloud Templates to enter the Template Management page.
- On the Template Management page, choose the cce-dynamic-scheduler template and click Install.
- Fill in the necessary settings on the Install Template page, then click OK to finish the component installation.
- Log in to the Master Node and set up the Kube-Scheduler startup parameters to activate the component.
Operation steps
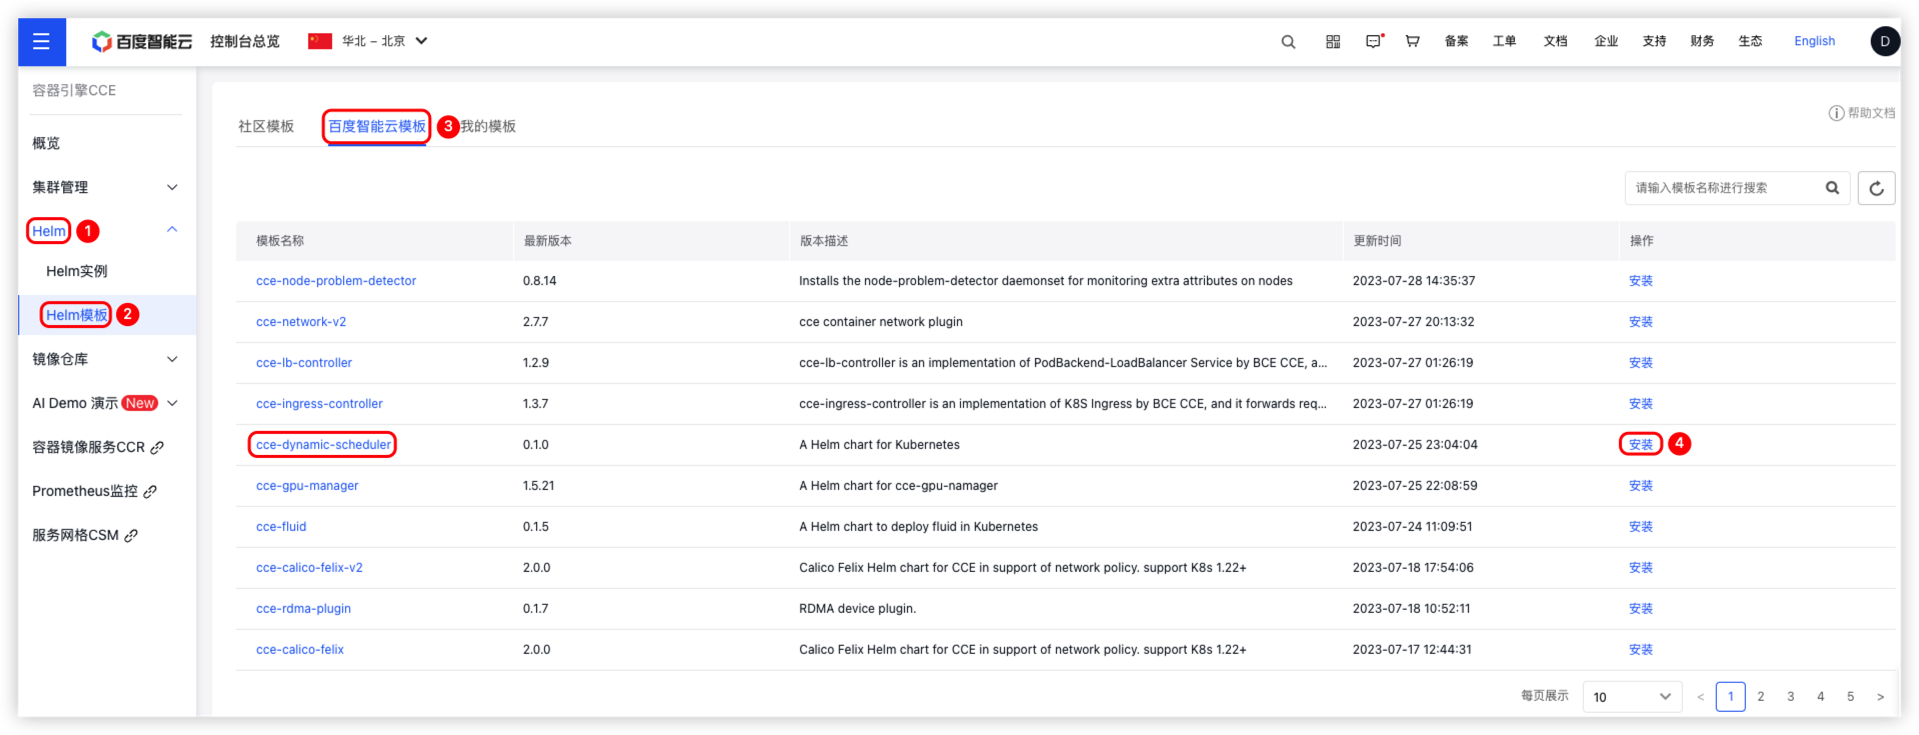
- Users need to click Helm > Helm Templates in the left navigation bar. On the Helm Templates page, click Baidu AI Cloud Templates to enter the Template Management page. Find the component cce-dynamic-scheduler and click Install. The process is shown in the figure below:
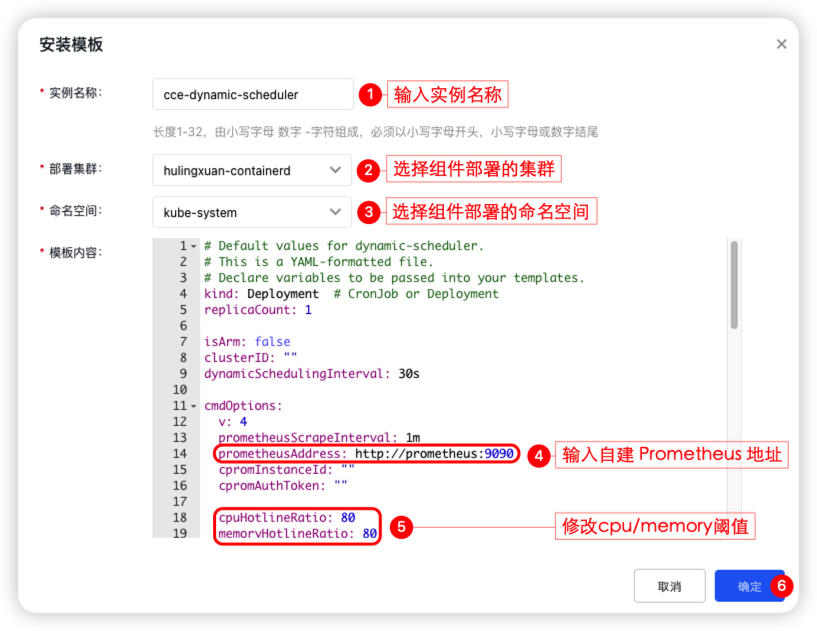
- On the Template Installation page, you need to fill in [Instance Name], [Deployment Cluster], [Namespace], [Prometheus Address] and [CPU/Memory Threshold], then click OK to complete component deployment.
- Sign in to the Master Node and configure Kube-Scheduler startup item
- Enter the command
cd /etc/kubernetes/ && vim scheduler-extender.yamlto createscheduler-extender.yaml. The content of -5-}scheduler-extender.yamlis as follows:
1apiVersion: kubescheduler.config.k8s.io/v1beta2
2kind: KubeSchedulerConfiguration
3clientConnection:
4  kubeconfig: "/etc/kubernetes/scheduler.conf"
5extenders:
6 - urlPrefix: "http://dynamic-scheduler.svc/dynamic/extender" ## Actual svc address of dynamic-scheduler
7  filterVerb: "filter"
8  prioritizeVerb: "prioritize"
9  weight: 1
10  enableHTTPS: false
11  nodeCacheCapable: true
12 ignorable: true- Enter the command
cd manifests/ && vim kube-scheduler.yamlto modify the configuration file ofKube-Scheduler.yaml. Add the startup parameter -- --config=/etc/kubernetes/scheduler-extender.yaml. The content ofKube-Scheduler.yamlis as follows:
1apiVersion: v1
2kind: Pod
3metadata:
4  annotations:
5    scheduler.alpha.kubernetes.io/critical-pod: ""
6  creationTimestamp: null
7  labels:
8    component: kube-scheduler
9    tier: control-plane
10  name: kube-scheduler
11  namespace: kube-system
12spec:
13  containers:
14    - command:
15        ## ...
16 - --config=/etc/kubernetes/scheduler-extender.yaml ## Modify the kube-scheduler configuration file and add startup parameters
17
Usage cases
1. Real load scheduling strategy for hotspot avoidance:
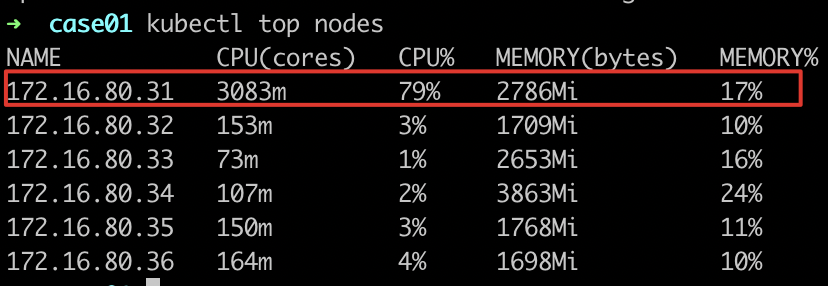
Description: When a node exceeds the safety utilization, newly deployed pods will not be scheduled to nodes that exceed the threshold
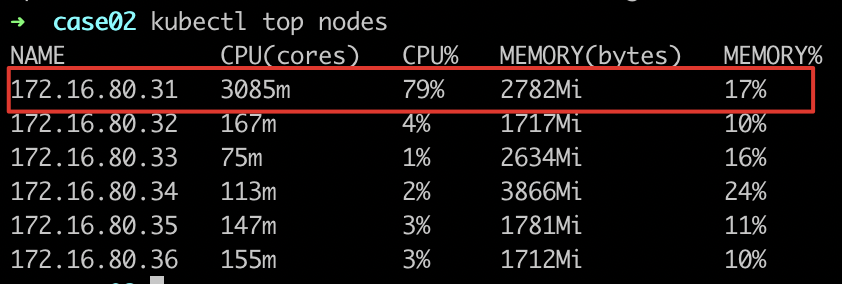
- Observe the load of nodes where workloads are located
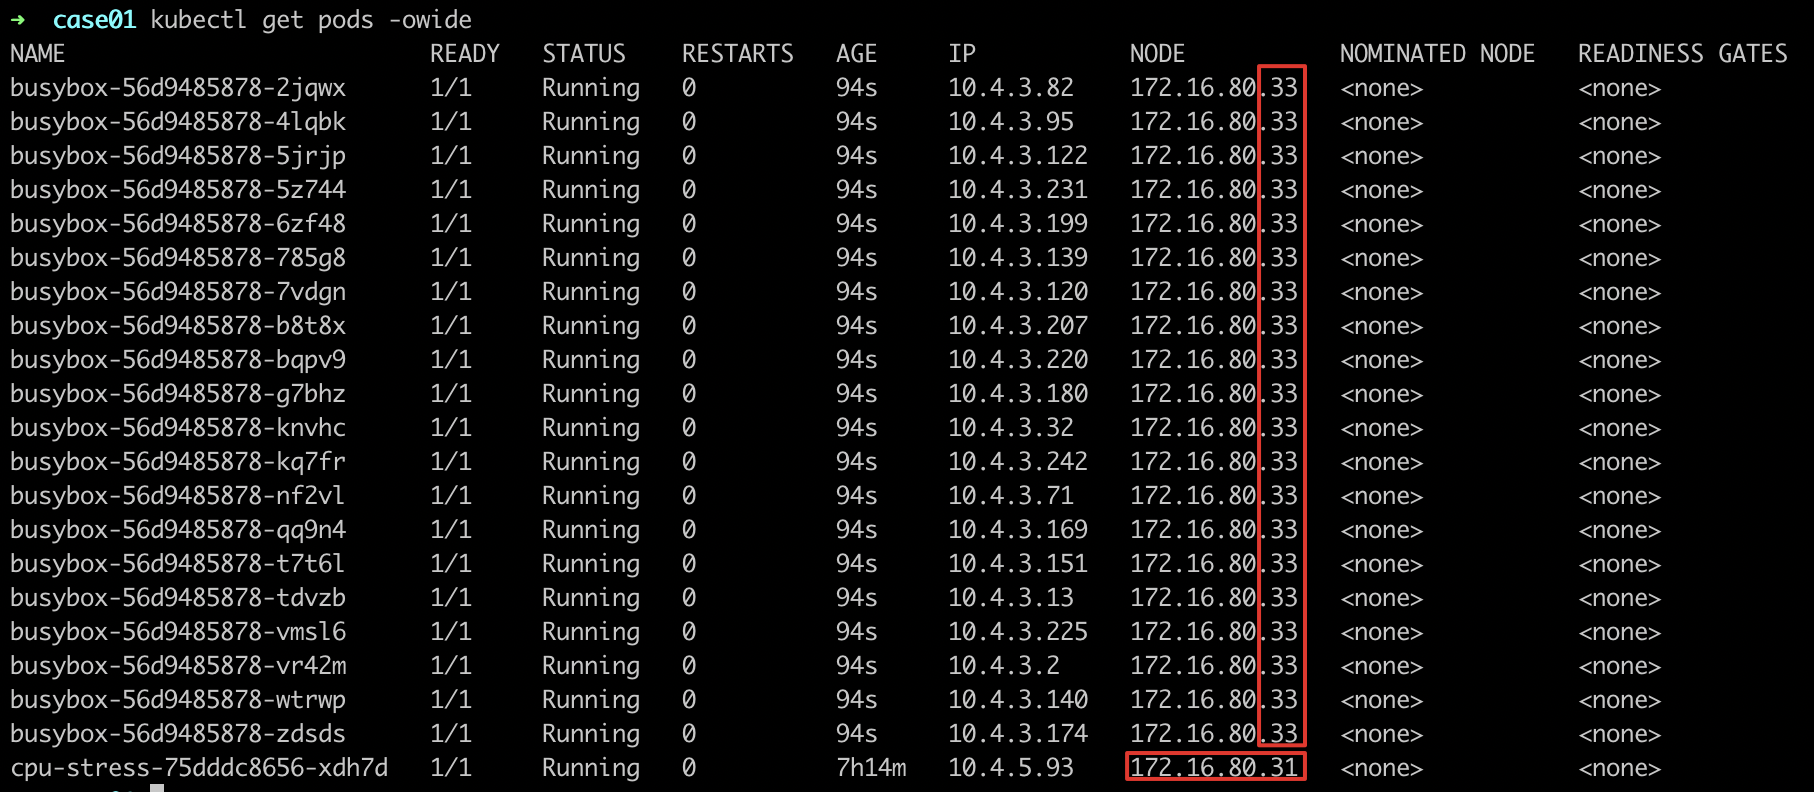
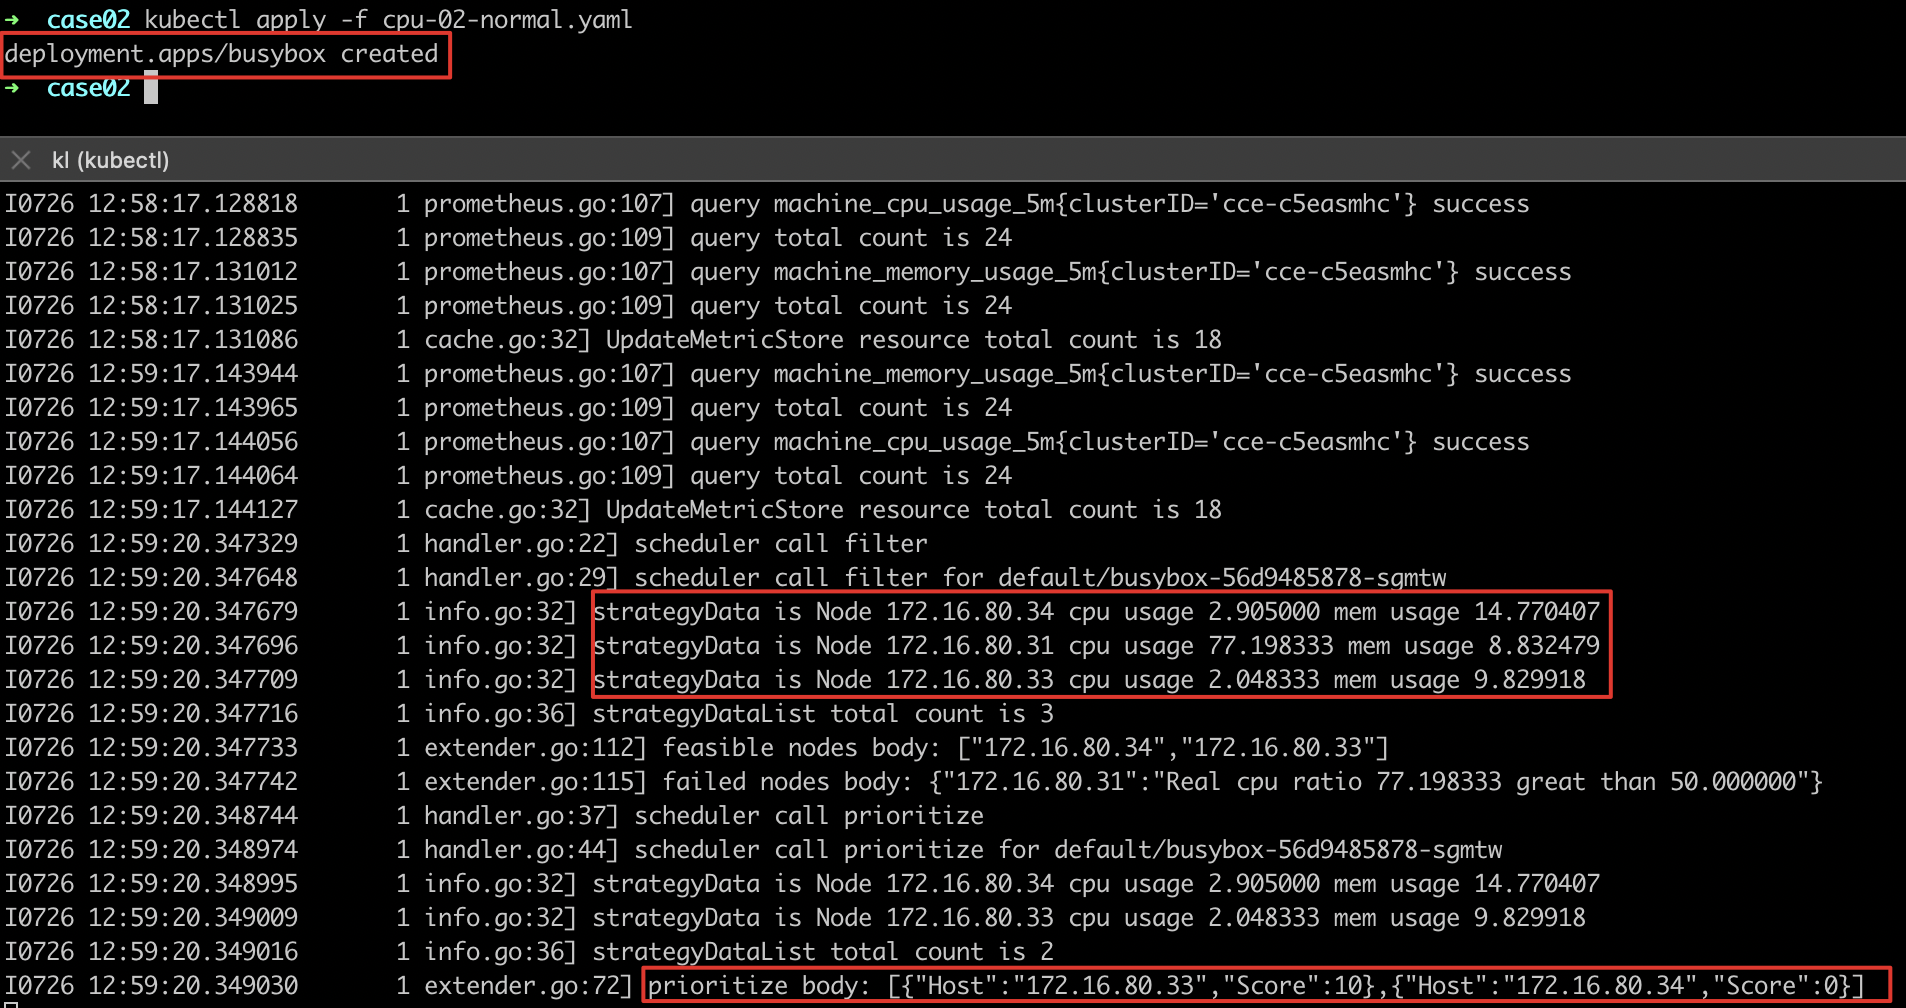
- Deploy other services for scheduling
- Observe the scheduling and deployment of services and find that the deployed services will not be scheduled to
node-172.16.80.31.
- View component logs
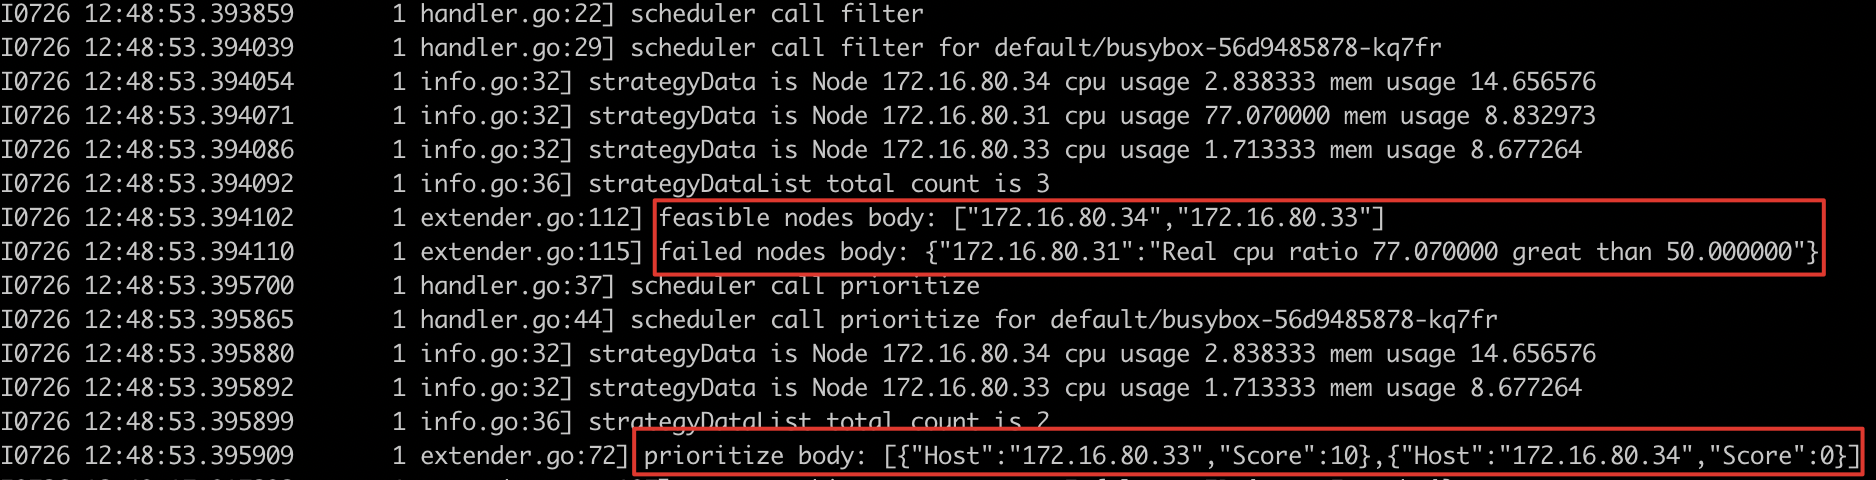
- Expected result
- Nodes with load exceeding the threshold will no longer have other services deployed, thus avoiding scheduling to nodes that actually exceed the threshold. The scheduling results and scheduling logs are as expected
2. Scheduling strategy based on actual load:
Description: When nodes do not exceed the safety utilization, newly deployed pods will be scheduled to the node with the optimal actual load among all current nodes
- Observe the load of nodes where workloads are located
- Deploy other services for scheduling and observe the scheduling logs. It is found that node-172.16.80.33 has the lowest actual load and the highest score
- Observe the scheduling and deployment of services and find that the deployed services are scheduled to the nodes with the lowest load (highest score)
node-172.16.80.33.

- Expected result
- Nodes with load exceeding the threshold will no longer have other services deployed. The deployed services will be scheduled to node-172.16.80.33, which has the lowest actual load. The scheduling result is as expected