
CCE Descheduler Description
Component introduction
CCE Descheduler is a component developed by Cloud Container Engine (CCE) based on the Community Descheduler, with an additional implementation of Pod rescheduling based on the actual CPU/Memory utilization of nodes. The actual resource utilization of nodes relies on Prometheus for collecting node resource utilization information, supporting two data sources: user-built Prometheus and Baidu AI Cloud-managed Prometheus.
Functions
In Kubernetes, the kube-scheduler handles scheduling Pods in the pending state and binding them to specific nodes. Whether a Pod can be scheduled depends on a set of configurable policies, known as predicates and priorities. The scheduler makes decisions based on the cluster’s resource status when the Pod to be scheduled appears. However, this one-time scheduling has limitations: changes in the number of nodes, labels, taints, tolerations, etc., might make previously scheduled Pods suboptimal, necessitating the migration of some running Pods to other nodes.
The node utilization-related policies (like LowNodeUtilization and HighNodeUtilization) available in the community descheduler rely on Pod’s request and limit data instead of the actual resource usage of nodes. For instance, memory-optimized and compute-optimized tasks may be allocated similar resources, even though their actual resource consumption during runtime can differ significantly.
CCE Descheduler introduces a rescheduling policy using the actual resource utilization of nodes. It collects load statistics of each node through Prometheus and triggers Pod evictions on high-load nodes based on user-defined thresholds.
Application scenarios
Pod rescheduling is carried out in accordance with the actual CPU/Memory usage of nodes.
Note
- By default, critical Pods are not evicted., that is, priorityClassName is configured as system-cluster-critical or system-node-critical;
- Pods not managed by workloads (Deployment, StatefulSet, Job, etc.) are not evicted, as such Pods will not be rescheduled after eviction;
- Pods managed by DaemonSet are not evicted by default;
- Pods using local storage are not evicted by default;
- Pods mounting PVC are not evicted by default;
- Pods of system components are not evicted by default;
- You can use PodDisruptionBudget to protect Pods from eviction. For example, users can configure to control the count or proportion of unavailable replicas under a workload.
1apiVersion: policy/v1
2kind: PodDisruptionBudget
3metadata:
4  name: zk-pdb
5spec:
6  maxUnavailable: 1
7  selector:
8    matchLabels:
9 app: zookeeper- Eviction is a high-risk operation. Please pay attention to node affinity, taint-related configurations, and the Pod’s own requirements for nodes to prevent situations where no nodes are available for scheduling after eviction;
- Except for the above limit conditions, all Pods can be evicted by default;
Install component
Dependency deployment
The CCE-Descheduler component relies on the actual load of nodes in the current and past period to make scheduling decisions, requiring monitoring components such as Prometheus to obtain the actual load information of system nodes. Before using the CCE-Descheduler component, you can use Baidu AI Cloud-managed Prometheus or a self-built Prometheus for monitoring.
Use Baidu AI Cloud-managed Prometheus
If using Baidu AI Cloud-managed Prometheus as the monitoring data source, you need to create a Prometheus instance, link it to a Kubernetes Cluster CCE, and configure metric aggregation rules. For detailed operations, please refer to the documentation.
- Create Prometheus Instance
- Associate K8S Cluster CCE
- Configure Metric Collection Task
- Configure Metric Aggregation Rules
After creating the managed Prometheus instance and associating the K8S Cluster CCE, the managed Prometheus will automatically complete the configuration of the metric collection task, which mainly includes monitoring of cluster control plane components (such as kube-apiserver and kube-scheduler), as well as the collection of metrics required by Descheduler for cAdvisor and NodeExporter. Therefore, users do not need to configure metric collection tasks by themselves.
In the stage of configuring metric aggregation rules, users need to add the following rules:
1spec:
2  groups:
3    - name: machine_cpu_mem_usage_active
4      interval: 30s
5      rules:
6        - record: machine_memory_usage_active
7          expr: 100*(1-node_memory_MemAvailable_bytes/node_memory_MemTotal_bytes)
8    - name: machine_memory_usage_1m
9      interval: 1m
10      rules:
11        - record: machine_memory_usage_5m
12          expr: 'avg_over_time(machine_memory_usage_active[5m])'
13    - name: machine_cpu_usage_1m
14      interval: 1m
15      rules:
16        - record: machine_cpu_usage_5m
17          expr: >-
18            100 - (avg by (instance, clusterID)
19            (irate(node_cpu_seconds_total{mode="idle"}[5m])) * 100)
20    - name: container_cpu_usage_10m
21      interval: 1m
22      rules:
23        - record: container_cpu_usage_total_5m
24          expr: >-
25            sum by(namespace, pod,
26            clusterID)(rate(container_cpu_usage_seconds_total{pod!='',image=''}[5m]))
27            * 1000
28    - name: container_memory_working_set_bytes_pod
29      interval: 1m
30      rules:
31        - record: container_memory_working_set_bytes_by_pod
32          expr: 'container_memory_working_set_bytes{pod!='''',image=''''}'
This rule implements automatic aggregation calculation of metrics required by CCE-Descheduler, such as machine_cpu_usage_5m, machine_memory_usage_5m, container_cpu_usage_total_5m and container_memory_working_set_bytes_by_pod.
Use self-built Prometheus
When using a self-built Prometheus as the monitor data source, users need to deploy two components by themselves:
Check the official component documentation to carry out the deployment process.
After deploying the components, users need to add monitor metric collection tasks for cAdvisor and NodeExporter in Prometheus, and configure metric aggregation rules. For specific configurations, please refer to:
1scrape_configs:
2  - job_name: "kubernetes-cadvisor"
3    # Default to scraping over https. If required, just disable this or change to
4    # `http`.
5    scheme: https
6
7    # Starting Kubernetes 1.7.3 the cAdvisor metrics are under /metrics/cadvisor.
8    # Kubernetes CIS Benchmark recommends against enabling the insecure HTTP
9    # servers of Kubernetes, therefore the cAdvisor metrics on the secure handler
10    # are used.
11    metrics_path: /metrics/cadvisor
12
13    # This TLS & authorization config is used to connect to the actual scrape
14    # endpoints for cluster components. This is separate to discovery auth
15    # configuration because discovery & scraping are two separate concerns in
16    # Prometheus. The discovery auth config is automatic if Prometheus runs inside
17    # the cluster. Otherwise, more config options have to be provided within the
18    # <kubernetes_sd_config>.
19    tls_config:
20      ca_file: /var/run/secrets/kubernetes.io/serviceaccount/ca.crt
21      # If your node certificates are self-signed or use a different CA to the
22      # master CA, then disable certificate verification below. Note that
23      # certificate verification is an integral part of a secure infrastructure
24      # so this should only be disabled in a controlled environment. You can
25      # disable certificate verification by uncommenting the line below.
26      #
27      insecure_skip_verify: true
28    authorization:
29      credentials_file: /var/run/secrets/kubernetes.io/serviceaccount/token
30
31    kubernetes_sd_configs:
32      - role: node
33
34    relabel_configs:
35      - action: labelmap
36        regex: __meta_kubernetes_node_label_(.+)
37
38  - job_name: 'node-exporter'
39      kubernetes_sd_configs:
40        - role: pod
41      relabel_configs:
42      - source_labels: [__meta_kubernetes_pod_name]
43        regex: 'node-exporter-(.+)'
44        action: keep
When using a self-built Prometheus, configuring metric aggregation rules is similar to using a managed cluster, with the difference that there is no need to consider the clusterID dimension in the rules, as this dimension is added by the managed Prometheus. Therefore, for the aggregation rules, refer to:
1spec:
2  groups:
3    - name: machine_cpu_mem_usage_active
4      interval: 30s
5      rules:
6        - record: machine_memory_usage_active
7          expr: 100*(1-node_memory_MemAvailable_bytes/node_memory_MemTotal_bytes)
8    - name: machine_memory_usage_1m
9      interval: 1m
10      rules:
11        - record: machine_memory_usage_5m
12          expr: 'avg_over_time(machine_memory_usage_active[5m])'
13    - name: machine_cpu_usage_1m
14      interval: 1m
15      rules:
16        - record: machine_cpu_usage_5m
17          expr: >-
18            100 - (avg by (instance)
19            (irate(node_cpu_seconds_total{mode="idle"}[5m])) * 100)
20    - name: container_cpu_usage_10m
21      interval: 1m
22      rules:
23        - record: container_cpu_usage_total_5m
24          expr: >-
25            sum by(namespace, pod)(rate(container_cpu_usage_seconds_total{pod!='',image=''}[5m])) * 1000
26    - name: container_memory_working_set_bytes_pod
27      interval: 1m
28      rules:
29        - record: container_memory_working_set_bytes_by_pod
30          expr: 'container_memory_working_set_bytes{pod!='''',image=''''}'
Installing CCE-Descheduler
- Sign in to the Baidu AI Cloud Official Website and enter the management console.
- Select Product Tour > Containers > Baidu Container Engine and click to enter the CCE management console.
- Click Cluster Management > Cluster List in the left navigation bar.
- Click on the target cluster name in the Cluster List page to navigate to the cluster management page.
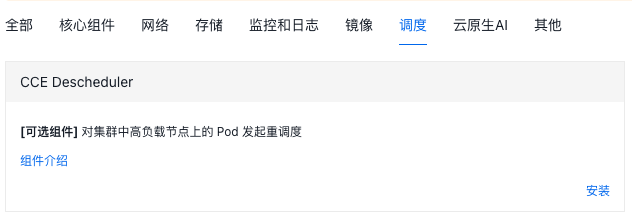
- On the Cluster Management page, click O&M & Management > Component Management.
- In the component management list, select the CCE Descheduler component and click Install.
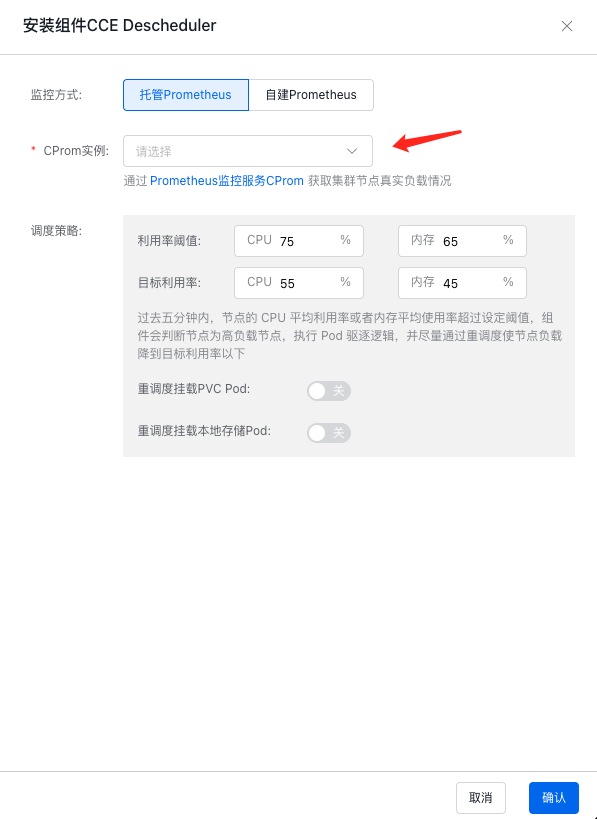
- Finalize the data source selection and rescheduling policy configuration on the Component Configuration page, then click the OK button to complete the component installation.
Users can choose Managed Prometheus or Self-built Prometheus as the data source according to their needs. When selecting managed Prometheus, users can select the Prometheus instance associated with the cluster from the drop-down box:
When selecting self-built Prometheus, users need to manually enter the address accessible within the cluster:
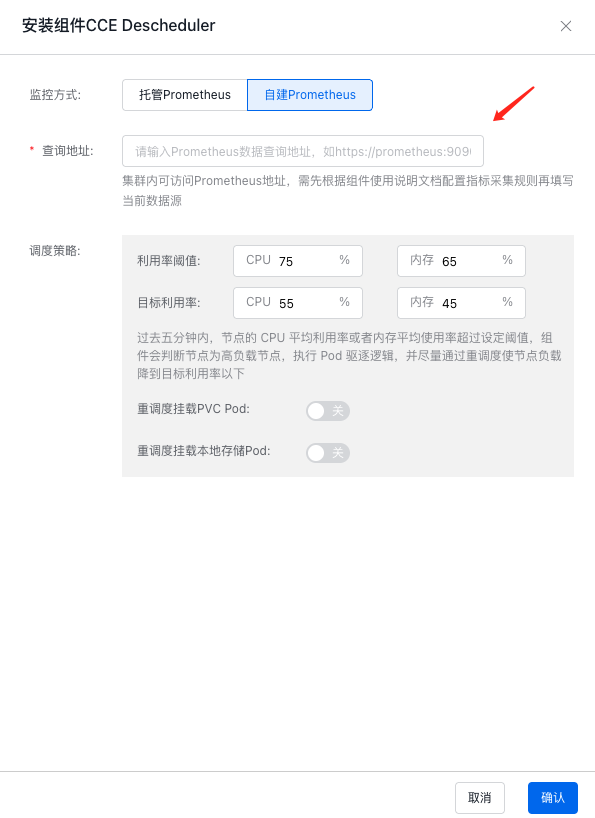
-
Other parameters include:
- Utilization threshold: When the CPU or memory utilization of a node reaches this threshold, eviction of Pods on the node will be initiated;
- Target utilization: After initiating eviction of Pods on a node, eviction will stop when the target utilization is reached;
- Reschedule PVC-mounted Pods: By default, eviction will not be initiated for Pods mounting PVC
- Reschedule local storage-mounted Pods: By default, eviction will not be initiated for Pods using local storage
- Click OK after configuring the parameters to finalize the component installation.
Version records
| Version No. | Cluster version compatibility | Update time | Update content | Impact |
|---|---|---|---|---|
| 0.24.2 | CCE/v1.16+ | 2023.06.21 | First release | - |
| 0.24.3 | CCE/v1.16+ | 2023.12.15 | Fix memory leak issue | - |