Monitor Cluster with Prometheus
Monitor overview
The CCE cluster enables the swift activation of Baidu AI Cloud Prometheus Monitor service (CProm), offering real-time health status monitoring of clusters and containers, along with access to visual Grafana monitor dashboards. Additionally, you can configure contacts to receive alerts and create custom monitoring metrics collection tasks as required.
Introduction to Baidu AI Cloud Prometheus Monitor
Baidu AI Cloud Prometheus Monitor service is committed to providing lightweight, stable, and highly available services. Retain native Prometheus features, support custom metric collection, enable reporting tens of millions of metrics, deliver excellent Grafana-based visualization with pre-configured default panels, and provide stable alert capabilities. Compared to self-built Prometheus environments, you do not need to manually download or configure Prometheus environments, nor consider the storage costs of maintaining massive data. Meanwhile, Prometheus monitor is compatible with open-source Prometheus API and the community Exporter ecosystem, offering a Prometheus integration environment free of setup and maintenance to reduce development and operation and maintenance costs.
Description
- For detailed information about Baidu AI Cloud Prometheus, refer to What is Prometheus Monitor .
- After enabling Prometheus, the Prometheus monitor will collect container monitor metrics in the cluster. The default collected metrics are basic metrics of Baidu AI Cloud Prometheus, which do not incur fees under normal circumstances. However, adjusting metric storage duration or reporting custom metrics will incur additional charges. For billing details of Baidu AI Cloud Prometheus monitor, refer to Billing Instructions.
Connect to a Prometheus monitor instance
Prerequisites
- The Cloud Container Engine (CCE), Baidu AI Cloud Prometheus service has been activated. You may log in to the Prometheus Service Console to confirm its activation status.
- You have successfully created a CCE cluster. For details, see Create CCE Cluster.
CCE cluster is connected to CProm instance
- Sign in to Cloud Container Engine (CCE) console.
- Select Cluster List in the left navigation bar.
- On the Cluster List page, click on the desired cluster to open the cluster management page.
- In the left navigation bar of the cluster management page, select O&M & Management - Prometheus Monitor.
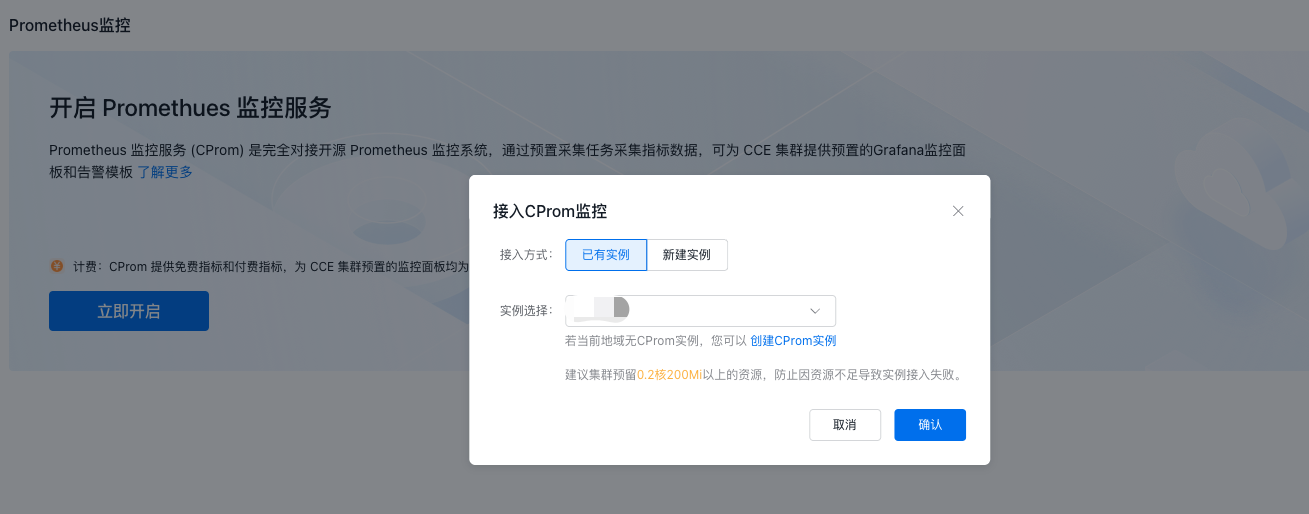
- Click Enable Now to open the CProm Monitor pop-up window. You can either integrate with an existing monitor instance in the same region as the CCE cluster or create a new monitor instance. Click OK to complete the configuration.
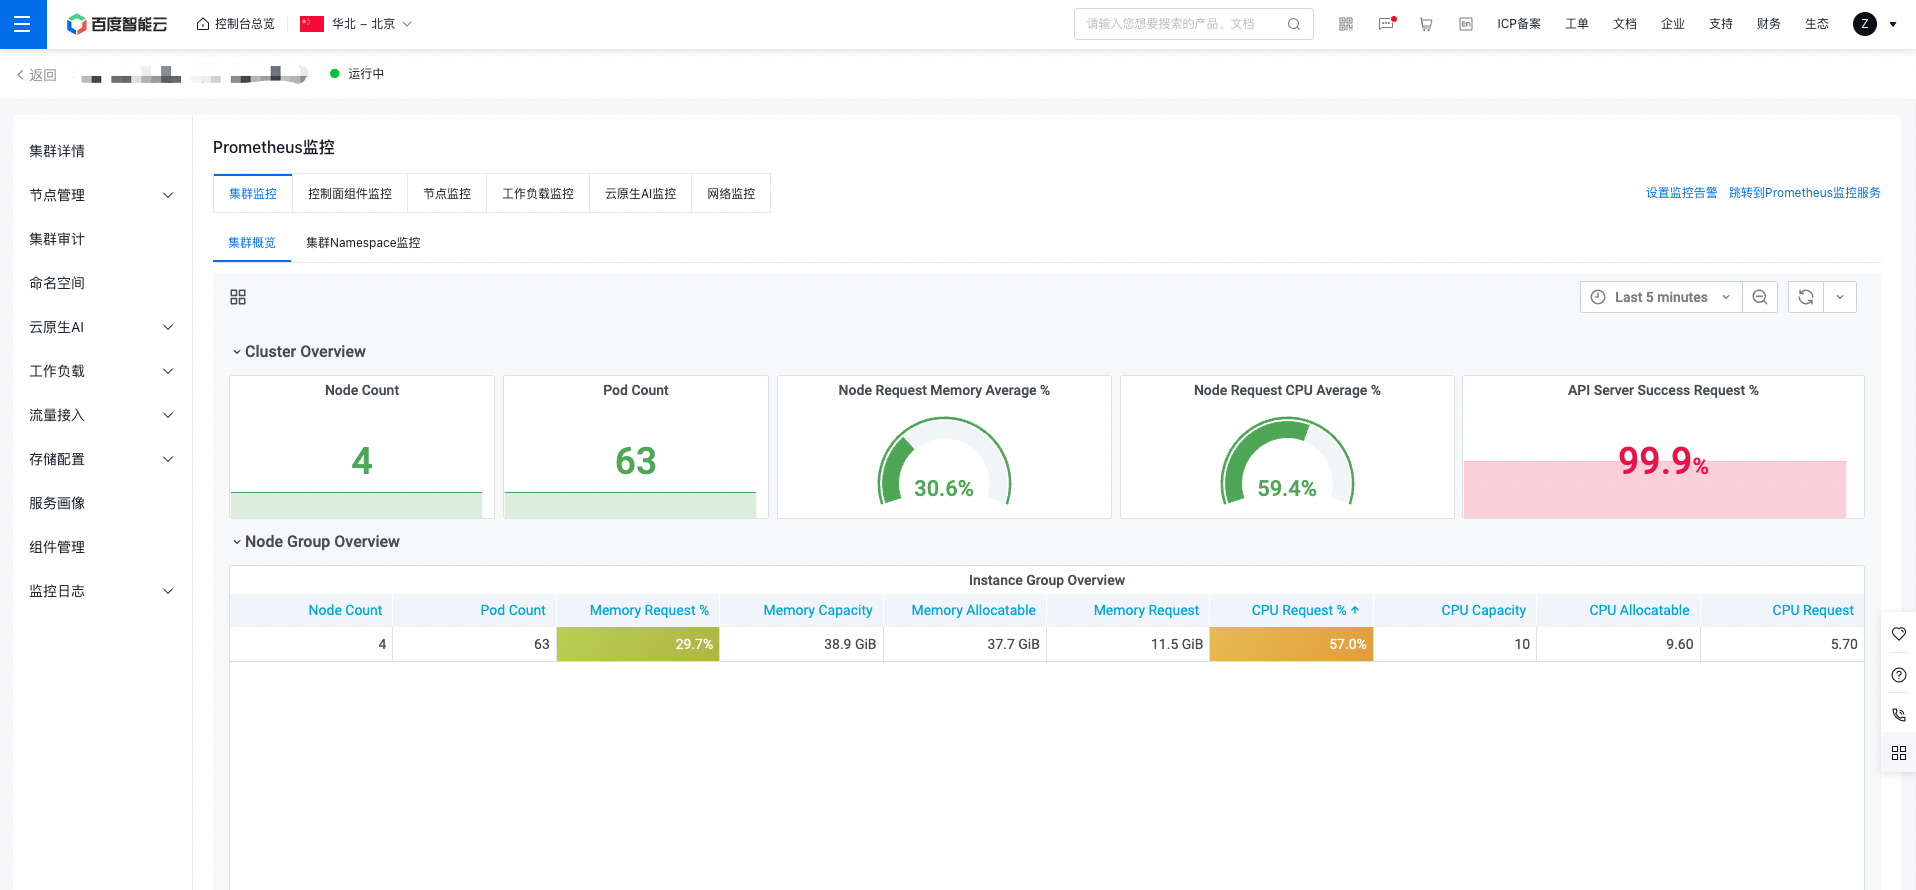
- After connecting to the CProm instance, the console will automatically install the necessary components and check the monitoring dashboard. Once installed, you can click on each tab to view the relevant monitoring data.
Description
- When connecting to a CProm instance, the system will automatically install monitoring components in the CCE cluster. These components collect various metrics from the CCE cluster. Note that installation will consume some resources, so it's recommended to allocate resources of at least 0.2 cores and 200Mi to avoid access issues caused by insufficient resources.
- Alternatively, you may log in to the Prometheus Service console to associate CProm instances with CCE clusters. For details, refer to CProm Monitoring Instance Cluster Association.
- After integrating to the CProm instance, collection rules are enabled by default. If you want to collect custom service metrics, you can create custom collection tasks to meet your needs. For details, see Collection Configuration.
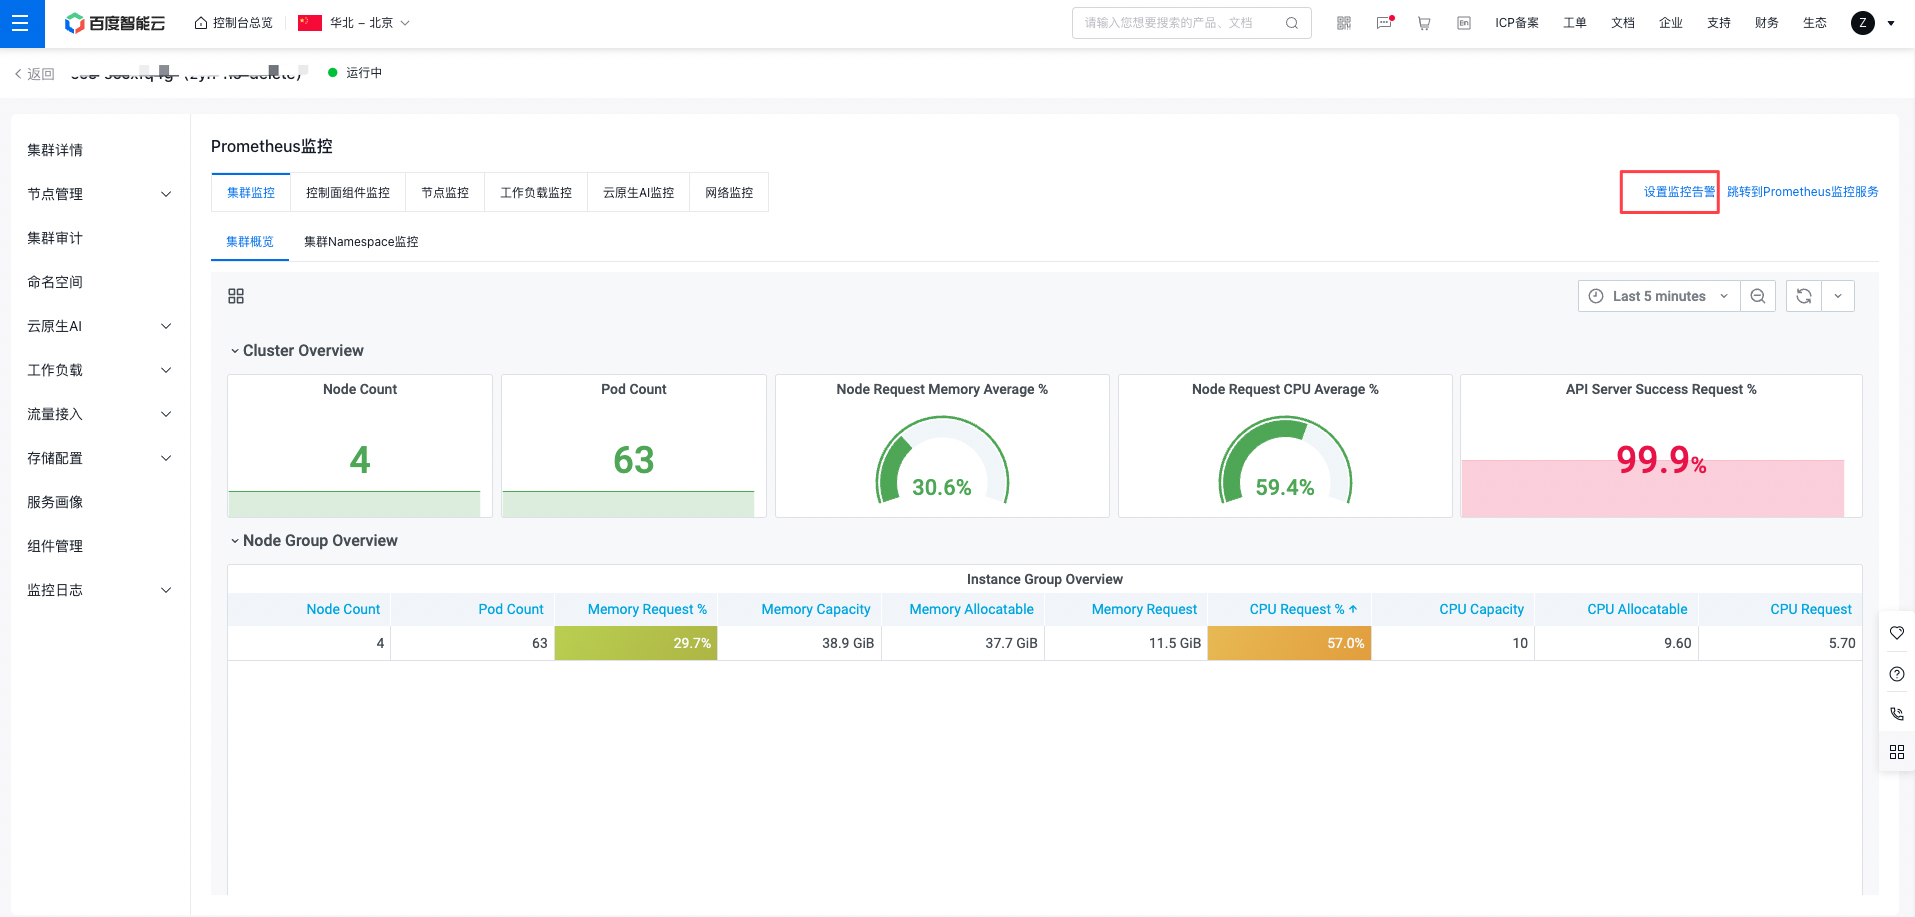
View monitor panel
On the Prometheus monitor page on the Cloud Container Engine (CCE) console, switch tabs to select the system-pre-configured Grafana monitor dashboard and obtain the corresponding monitor data. The monitor dashboard supports setting query time ranges and specifying refresh methods (manual refresh, automatic refresh).
Configure Prometheus monitor alerts
Alerts can be set up for monitoring metrics. When conditions are triggered, real-time notifications will be sent via email, SMS, DingTalk, etc., to promptly highlight issues. You can set cluster-specific alerts in the alert center of the managed Prometheus system.
- Click Set Monitor Alerts in the monitor dashboard to redirect to Prometheus monitor service to set alert policies for key metrics.
- Use pre-configured alert templates or customize templates to configure alert policies. For details, refer to Alert Configuration.