Connect to Cluster via kubectl
Connect the Kubernetes cluster via kubectl
To connect from a personal computer to the Baidu AI Cloud Kubernetes Cluster, use the Kubernetes CLI tool, kubectl. Kubectl is a command-line tool provided by Kubernetes to manage and monitor cluster resources, deploy applications, debug issues, and more. It allows for seamless cluster management through the command line. There are two modes of access:
- Intranet access: The client communicates with the cluster's API Server through an intranet IP address. This method avoids Internet traffic, enhancing security.
- Public access: The cluster's API Server is accessible over the Internet, allowing clients to connect via public IP. Note: Enabling this requires activating public access for the API Server.
Prerequisites
- A cluster has been created. For specific operations, please refer to Create Cluster.
Operation steps
To connect to a cluster using kubectl, first install kubectl on your local machine. Then, download the kubectl configuration file from your cluster, copy it to the appropriate directory on your computer, and complete the configuration. Below are the steps for accessing a CCE cluster via kubectl:
Note:
The operational steps in this guide are based on a Linux environment.
-
Download kubectl
You need to prepare a client computer with public network access permission. Refer to Installation Tools to find the corresponding steps for downloading kubectl based on the machine’s OS. If kubectl is already installed, skip this step. Execute the kubectl version command to verify installation status.
Note: Download the kubectl version matching your cluster version. Refer to the image below for cluster version.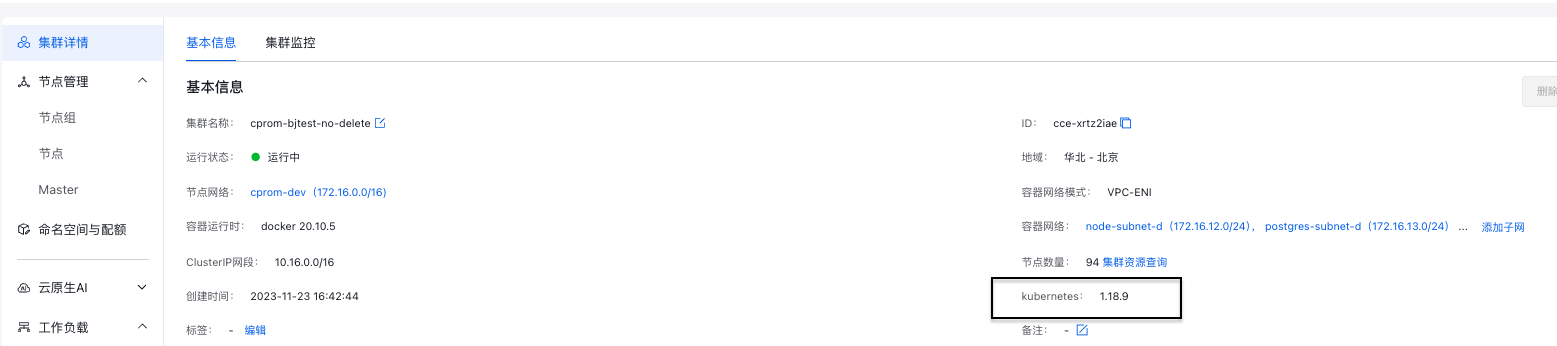
- Download cluster credentials
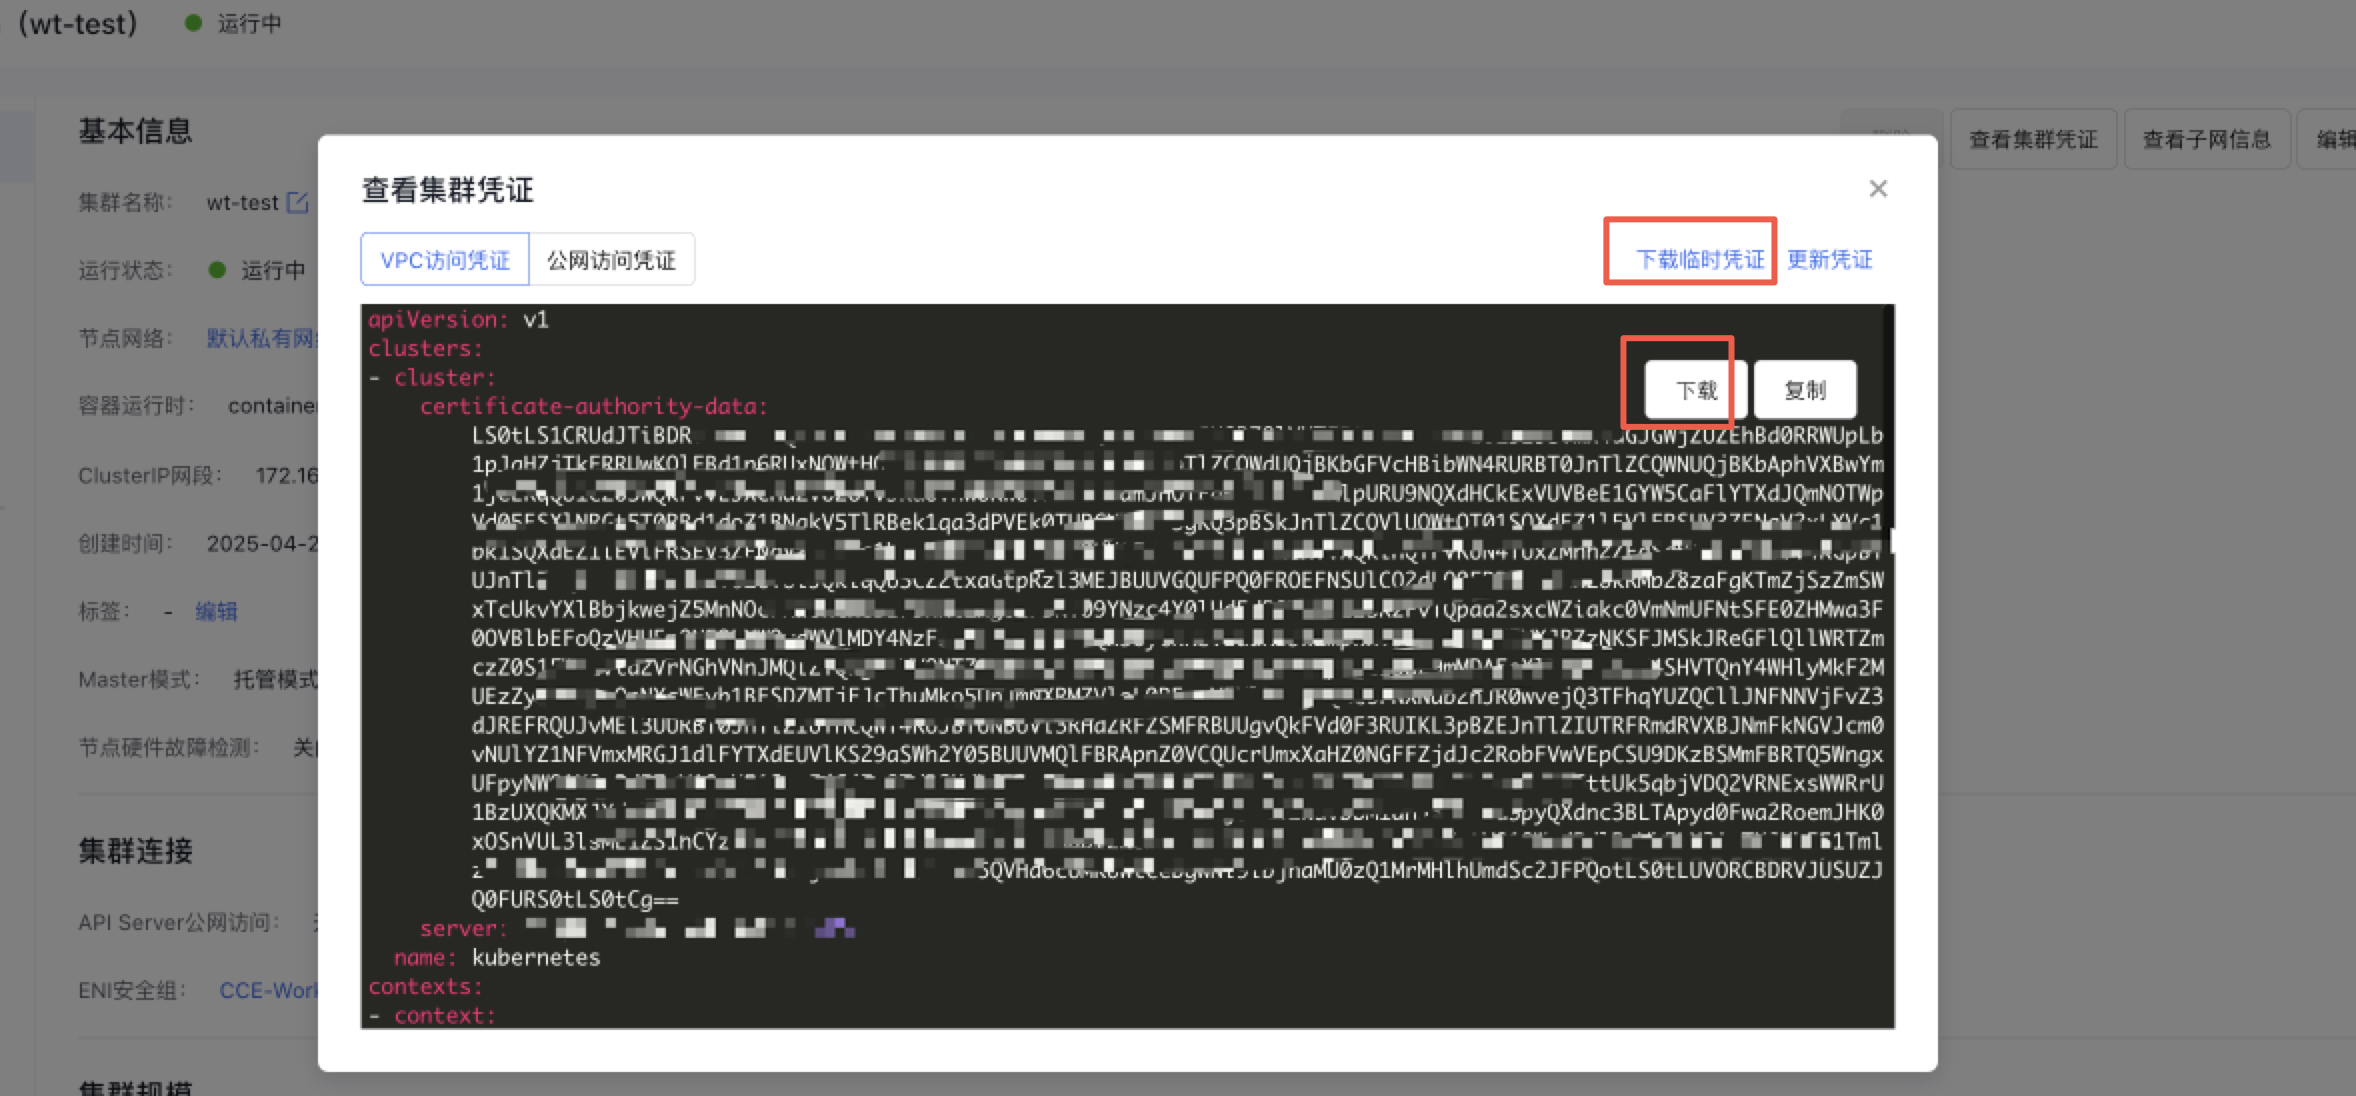
Check cluster credentials in the cluster list or in the cluster details page
a. VPC access credentials: In the cluster credentials pop-up window, select VPC access credentials, click Download Long-term Access Credentials or Download Temporary Access Credentials to obtain the cluster’s private network access credentials.
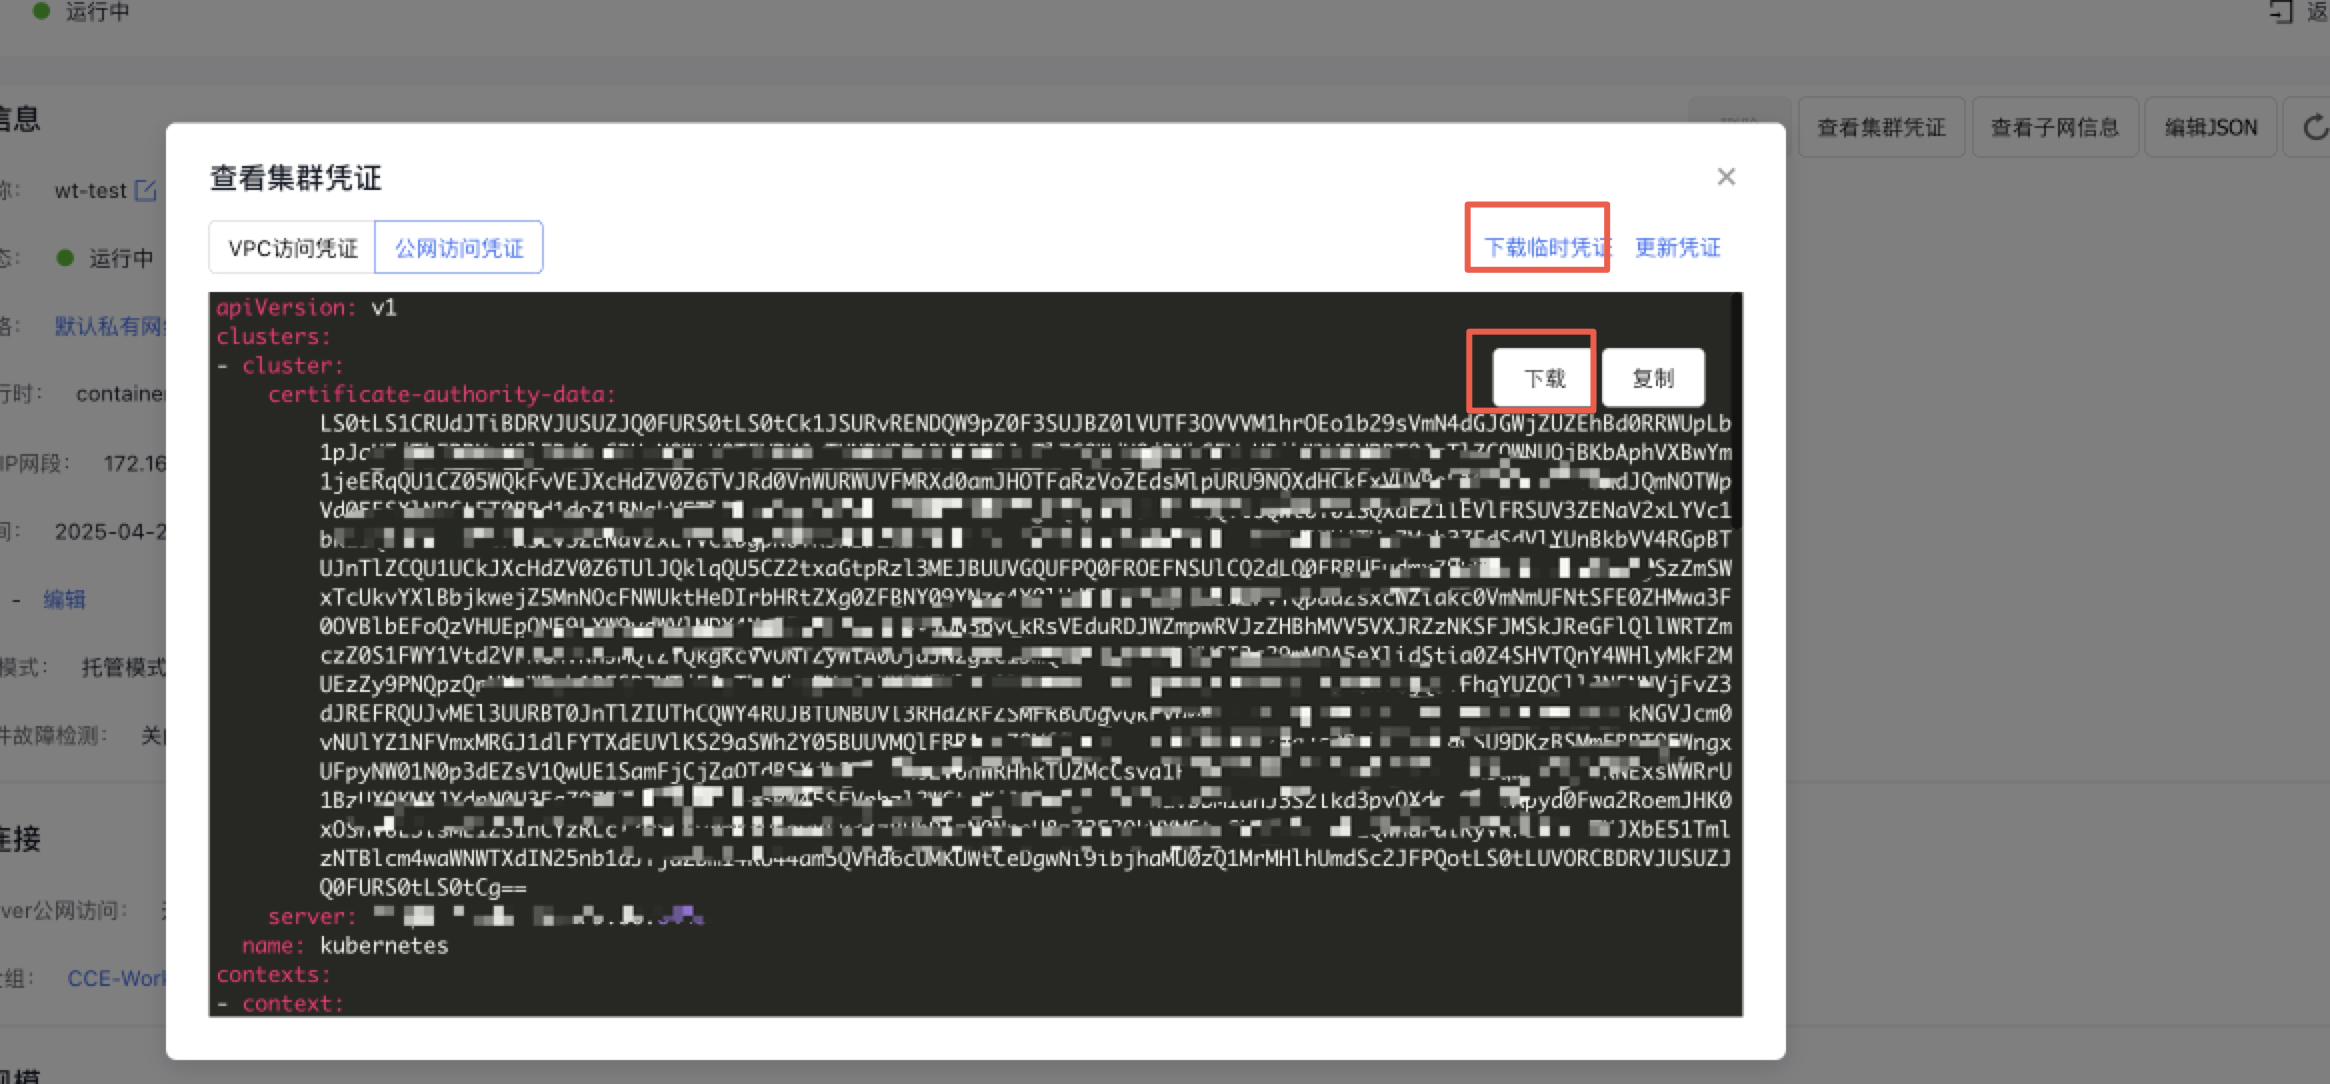
b. Public access credentials: In the cluster connection module under the basic information tab of the cluster, check whether API Server public access is enabled.
If API Server public access is disabled, please enable it. In the cluster credentials pop-up window, select public network access credentials, click Download Long-term Access Credentials or Download Temporary Access Credentials to download the cluster’s public network access credentials.
-
Configure kubectl: Save the downloaded cluster credentials in the default configuration path of kubectl.
a. Log in to your client computer and copy the access credential file downloaded in Step 3 (e.g., kubeconfig.yaml) to the /home directory of your client computer.
b. Configure the kubectl file.Plain Text1``` 2cd $HOME 3mkdir -p $HOME/.kube 4mv -f kubeconfig.yaml $HOME/.kube/config 5```c. Switch the kubectl access mode according to your specific usage scenarios.
Plain Text1* For VPC intranet access, execute: 2 3``` 4kubectl config use-context internal 5``` 6 * For Internet access (the cluster must be bound to a public address), execute: 7 8``` 9kubectl config use-context external 10``` -
After completing the configuration, execute the following command on your local machine to confirm the connection to the cluster using kubectl.
Plain Text1``` 2kubectl cluster-info # View the cluster information 3```If the echo result is displayed below, the client can successfully connect to the cluster via kubectl.
1 Kubernetes control plane is running at https://xx.xx.xx.xx:5443
2 CoreDNS is running at https://xx.xx.xx.xx:5443/api/v1/namespaces/kube-system/services/coredns:dns/proxy
3 To further debug and diagnose cluster problems, use 'kubectl cluster-info dump'.
4 ```
5
6
7## Create a simple service via kubectl
8
9### Create an Nginx application
10
11This command assumes that the kubectl command-line interface is already in the PATH and that you have permissions to operate the Kubernetes cluster (i.e., you have completed the setup to connect to the Kubernetes cluster via kubectl). Enter the following commands:
12
13 kubectl create deployment my-nginx --image=registry.baidubce.com/cce/nginx-alpine-go:latest --replicas=3 --port=80
14
15This command will create three nginx containers, each exposing port 80.
16
17The command to check the status of the created nginx container is as follows:
18
19 $ kubectl get pods
20 NAME READY STATUS RESTARTS AGE
21 my-nginx-858393261-pfjdn 1/1 Running 0 14s
22 my-nginx-858393261-sn7g5 1/1 Running 0 14s
23 my-nginx-858393261-spv8w 1/1 Running 0 14s
24
25> **Note:**
26> The symbol "$" represents the input command, while other lines represent the container information displayed after entering the command.
27
28### Expose service to the internet
29
30**Create service**
31
32In a public cloud environment, you can create a service of LoadBalancer by entering a command. This will also trigger the public cloud to create a load balancer and a public IP. The specific operation command is as follows:
33
34 kubectl expose deployment my-nginx --port=80 --type=LoadBalancer
35
36> **Note:**
37>
38> Load Balancer: virtualizes multiple Baidu Cloud Computes in the same region into a group, assigns an intranet or internet service address, and distributes concurrent front-end access to multiple real cloud servers, thus achieving balancing application traffic. You can obtain the public network IP of the service by querying the service. Then, find the BLB instance you created on the Baidu Load Balance (BLB) page in the Baidu AI Cloud console. For its pricing standards, refer to [Baidu Load Balance (BLB) Pricing](https://cloud.baidu.com/doc/BLB/s/Wkwn5lral).
39> Public IP: A standalone service that provides users with public network bandwidth. You can query the public IP address you created by [viewing the service](CCE/Development Guide/kubectl Management Configuration.md#View service). For its pricing standards, refer to [Elastic Public IP (EIP) Pricing](EIP/Product pricing/EIP Instance Billing.md). By default, the billing method is postpay.
40
41**View service**
42
431. Run the command to check the service, along with its status and the assigned public IP.
44
45
46 ```
47 $ kubectl get services
48 NAME CLUSTER-IP EXTERNAL-IP PORT(S) AGE
49 kubernetes 172.17.0.1 <none> 443/TCP 1h
50 my-nginx 172.17.44.5 180.76.139.247 80:30356/TCP 47s
51 ```
52
532. By accessing the link 180.76.139.247, the created service can be viewed as shown in the figure:
54
55 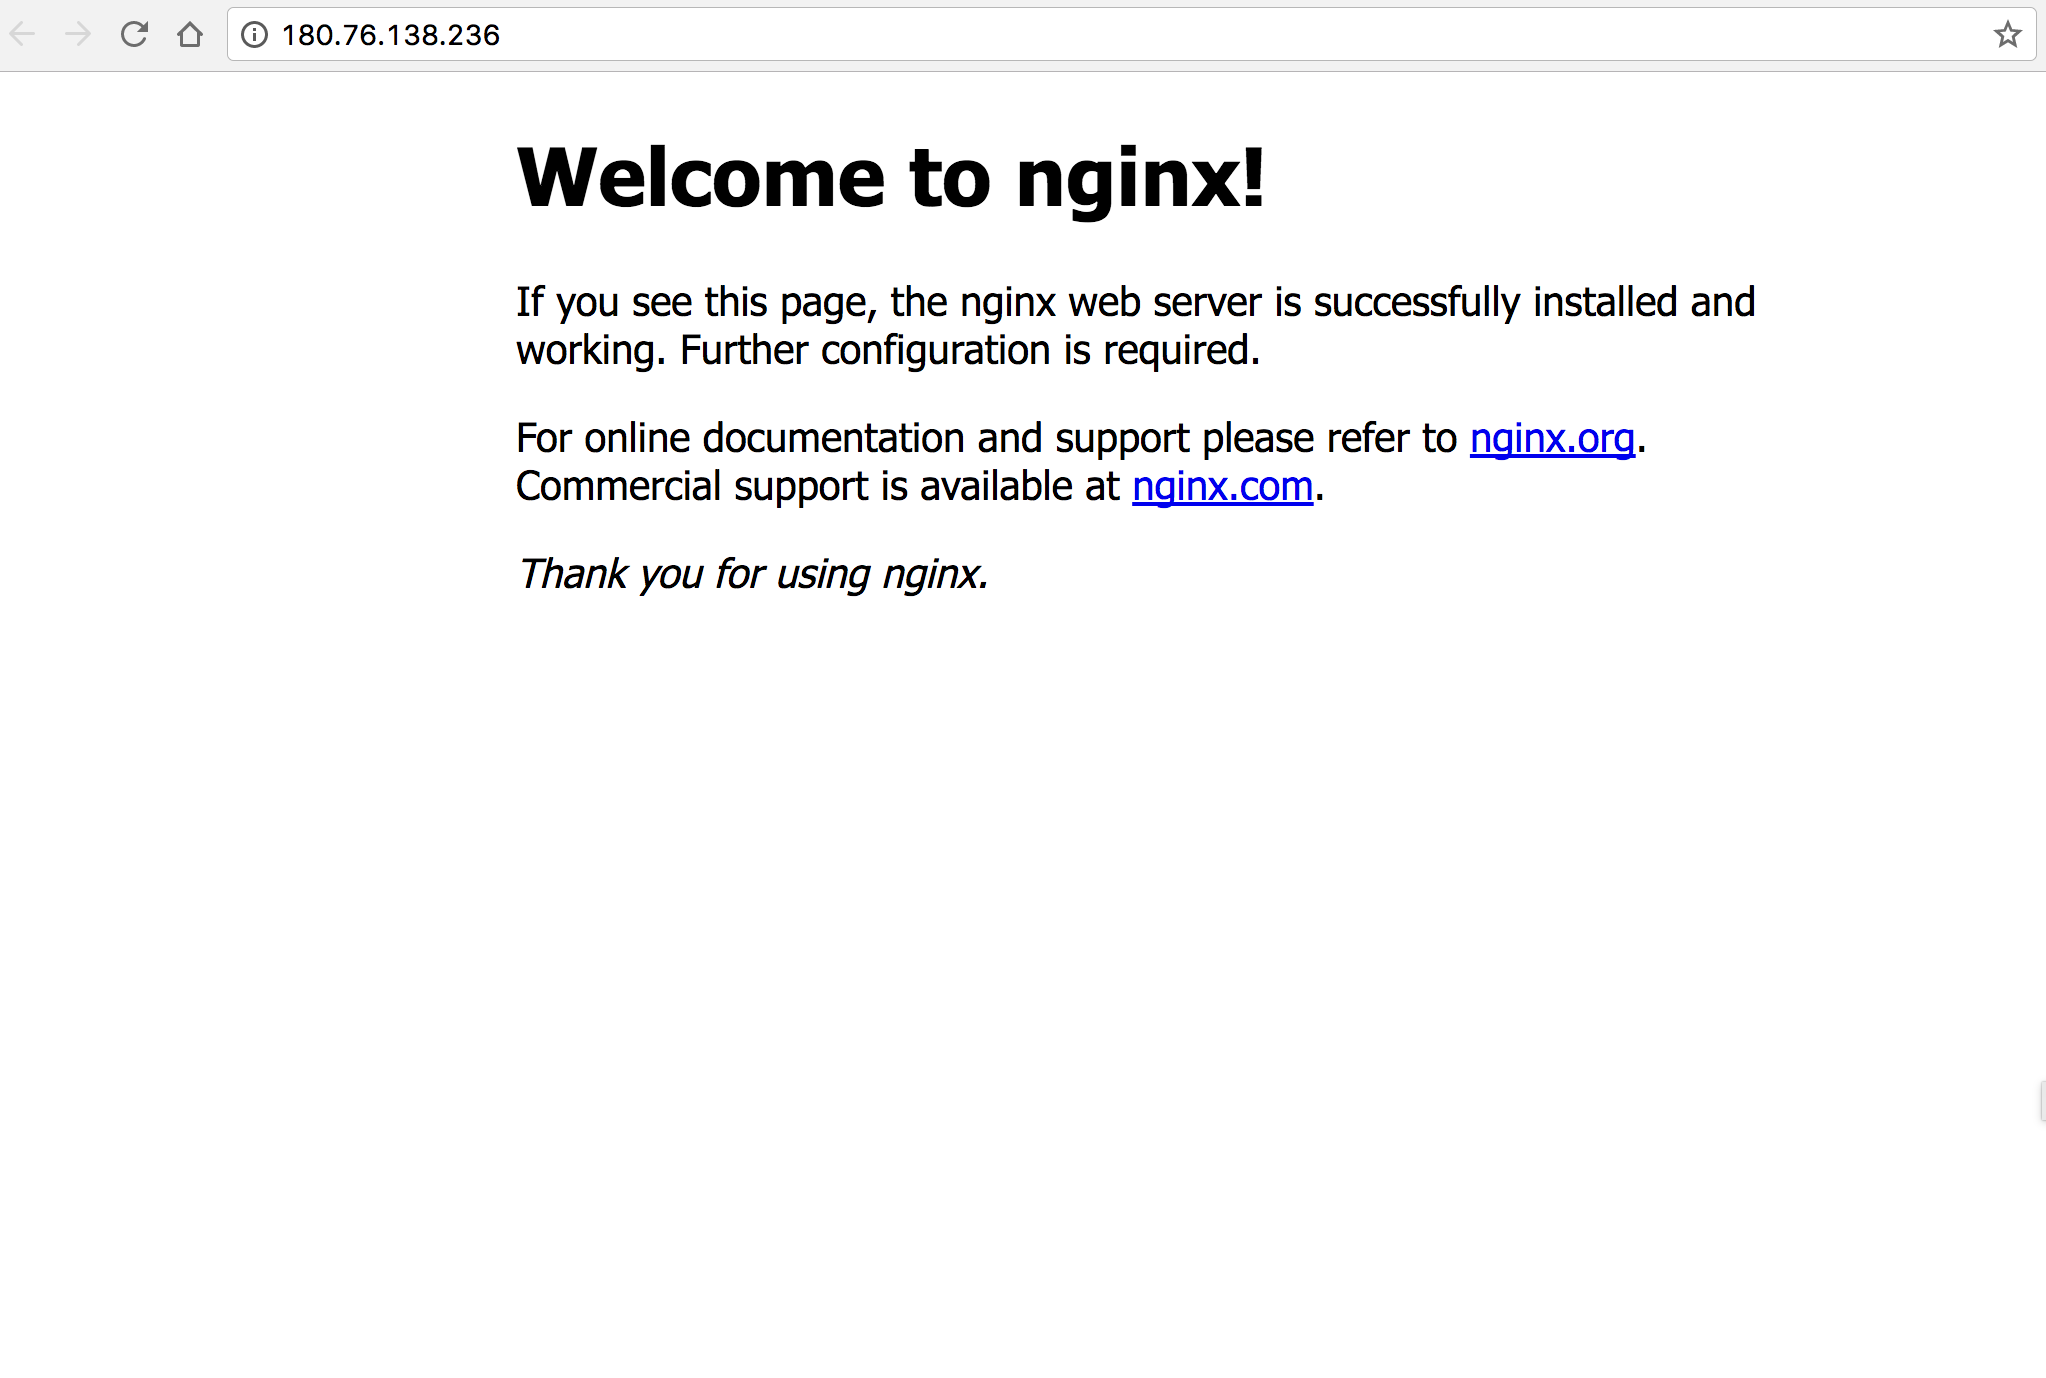
56
57> **Note:**
58> The symbol "$" represents the input command, while other lines display the service information after entering the command. Here, 180.76.139.247 is the internet service URL.
59> In addition to using the above commands to enable load balancing for the service, you can also create the service via the dashboard. For detailed operations, refer to [Create a Service via Kubernetes Dashboard](https://cloud.baidu.com/doc/CCE/s/6jxpotcn5#%E9%80%9A%E8%BF%87kubernetes-dashboard%E5%88%9B%E5%BB%BA%E6%9C%8D%E5%8A%A1).
60
61**Delete service**
62
63If you need to delete the service and ensure it is not exposed to the public network, you can directly remove it.
64
65 kubectl delete svc my-nginx
66
67> **Note:**
68>
69> Kubernetes will delete the newly generated public IP and load balancer, followed by the removal of the service.
70
71## Access the Kubernetes dashboard (Web UI) locally
72
73**Prerequisites**
74
75Before using the Kubernetes dashboard locally, users must configure kubectl to connect to the Baidu AI Cloud Kubernetes cluster.
76
77**Operation step**
78
791. Create the dashboard service locally by using the kubectl tool to set up a dashboard application within the Kubernetes cluster.$ kubectl create -f dashboard.yaml secret "kubernetes-dashboard-certs" created serviceaccount "kubernetes-dashboard" created clusterrolebinding "kubernetes-dashboard" created deployment "kubernetes-dashboard" created service "kubernetes-dashboard" created
1The corresponding dashboard.yaml file is:apiVersion: v1 kind: Secret metadata: labels: k8s-app: kubernetes-dashboard name: kubernetes-dashboard-certs namespace: kube-system type: Opaque
apiVersion: v1 kind: ServiceAccount metadata: labels: k8s-app: kubernetes-dashboard name: kubernetes-dashboard namespace: kube-system
apiVersion: v1 kind: ClusterRoleBinding metadata: name: kubernetes-dashboard labels: k8s-app: kubernetes-dashboard roleRef: apiGroup: rbac.authorization.k8s.io kind: ClusterRole name: cluster-admin subjects:
- kind: ServiceAccount name: kubernetes-dashboard namespace: kube-system
kind: Deployment apiVersion: apps/v1 metadata: labels: k8s-app: kubernetes-dashboard name: kubernetes-dashboard namespace: kube-system spec: replicas: 1 revisionHistoryLimit: 10 selector: matchLabels: k8s-app: kubernetes-dashboard template: metadata: labels: k8s-app: kubernetes-dashboard spec: containers: - name: kubernetes-dashboard image: registry.baidubce.com/public/dashboard:v1.8.3-caas ports: - containerPort: 8443 protocol: TCP args: - --auto-generate-certificates volumeMounts: - name: kubernetes-dashboard-certs mountPath: /certs - mountPath: /tmp name: tmp-volume livenessProbe: httpGet: scheme: HTTPS path: / port: 8443 initialDelaySeconds: 30 timeoutSeconds: 30 volumes: - name: kubernetes-dashboard-certs secret: secretName: kubernetes-dashboard-certs - name: tmp-volume emptyDir: {} serviceAccountName: kubernetes-dashboard tolerations: - key: node-role.kubernetes.io/master effect: NoSchedule
kind: Service apiVersion: v1 metadata: labels: k8s-app: kubernetes-dashboard name: kubernetes-dashboard namespace: kube-system spec: ports: - port: 443 targetPort: 8443 selector: k8s-app: kubernetes-dashboard
12. After creating the dashboard, use the kubectl proxy command to start a proxy and establish a connection to the Kubernetes API Server.kubectl proxy
13. After successfully enabling the proxy, you can access <http://127.0.0.1:8001/api/v1/namespaces/kube-system/services/https:kubernetes-dashboard:/proxy/#!/login> your local browser. Log in to the dashboard, select token authentication. The method to create a token is as follows, and the returned result can be used as the token for login.$ kubectl -n kube-system create token kubernetes-dashboard
eyJhbGciOiJSUzI1NiIsImtpZCI6ImREUzFpaHRJYnBLTV9jX1dmb05Bb2oxMXU0RE92QnhuejZ1WXJSYWo5MUEifQ.eyJhdWQiOlsia3ViZXJuZXRlcy5kZWZhdWx0LnN2YyJdLCJleHAiOjE3NDgzNDM0OTAsImlhdCI6MTc0ODMzOTg5MCwiaXNzIjoiaHR0cHM6Ly9rdWJlcm5ldGVzLmRlZmF1bHQuc3ZjLmNsdXN0ZXIubG9jYWwiLCJqdGkiOiJiM2Y1NGY0Yy0wNzExLTQzZmItYjdjNy1iOGQ2ZGIwNmU4ODYiLCJrdWJlcm5ldGVzLmlvIjp7Im5hbWVzcGFjZSI6Imt1YmUtc3lzdGVtIiwic2VydmljZWFjY291bnQiOnsibmFtZSI6ImNjZS12b2xjYW5vLWFkbWlzc2lvbiIsInVpZCI6IjJmOWVjYmMzLTAwMDItNDc3Zi05N2YzLThiMjkyODEwYWIwOSJ9fSwibmJmIjoxNzQ4MzM5ODkwLCJzdWIiOiJzeXN0ZW06c2VydmljZWFjY291bnQ6a3ViZS1zeXN0ZW06Y2NlLXZvbGNhbm8tYWRtaXNzaW9uIn0.bOw0vDkl2Q52H5Wa8X4N5QWlz3hOTGCK-ZkwSVT5A2gu0Qi2GjVKJPN00K4t19AXobzDmjIG-JEydVBN1n4SQ4GkW6_T_3lpwOV-P8JcAspTSi-0fHC5lR64TKVhS-HXNRECD2Z11K2eQuoZR0hP887sCGmuX1Xz6kb12YkBxuZgDaGEHS7fiVi67xTey2B2kYAzibn4KZfMBqLOBzmZ_aM2O_iWjUJ8isgwvwce5DAf8KT8YNsCW2pd6z7kaq-RWqmxUizXK3sFzvxoK4RLwGj1G1OSMpw6cFH0sLFuzR-gyIFLBOK9oyEsNnHhiqlpnBzVuamBpzwCLvvuwHVkKQ
1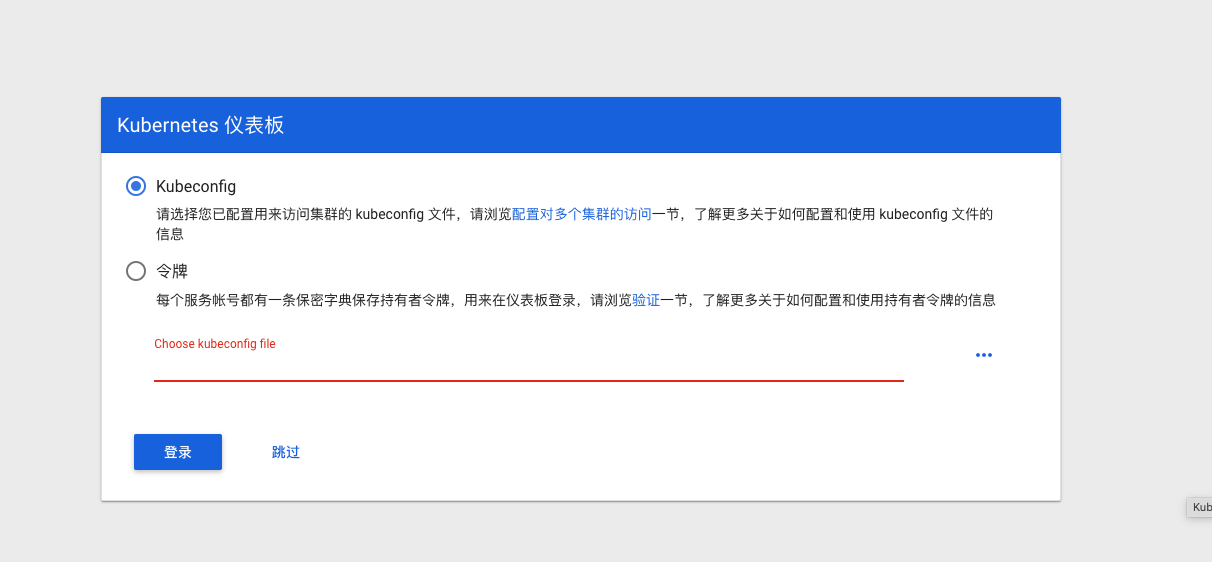
2
3> **Note:**
4>
5> Localhost refers to the user's local machine (not a virtual machine), with the corresponding IP address of 127.0.0.1
6
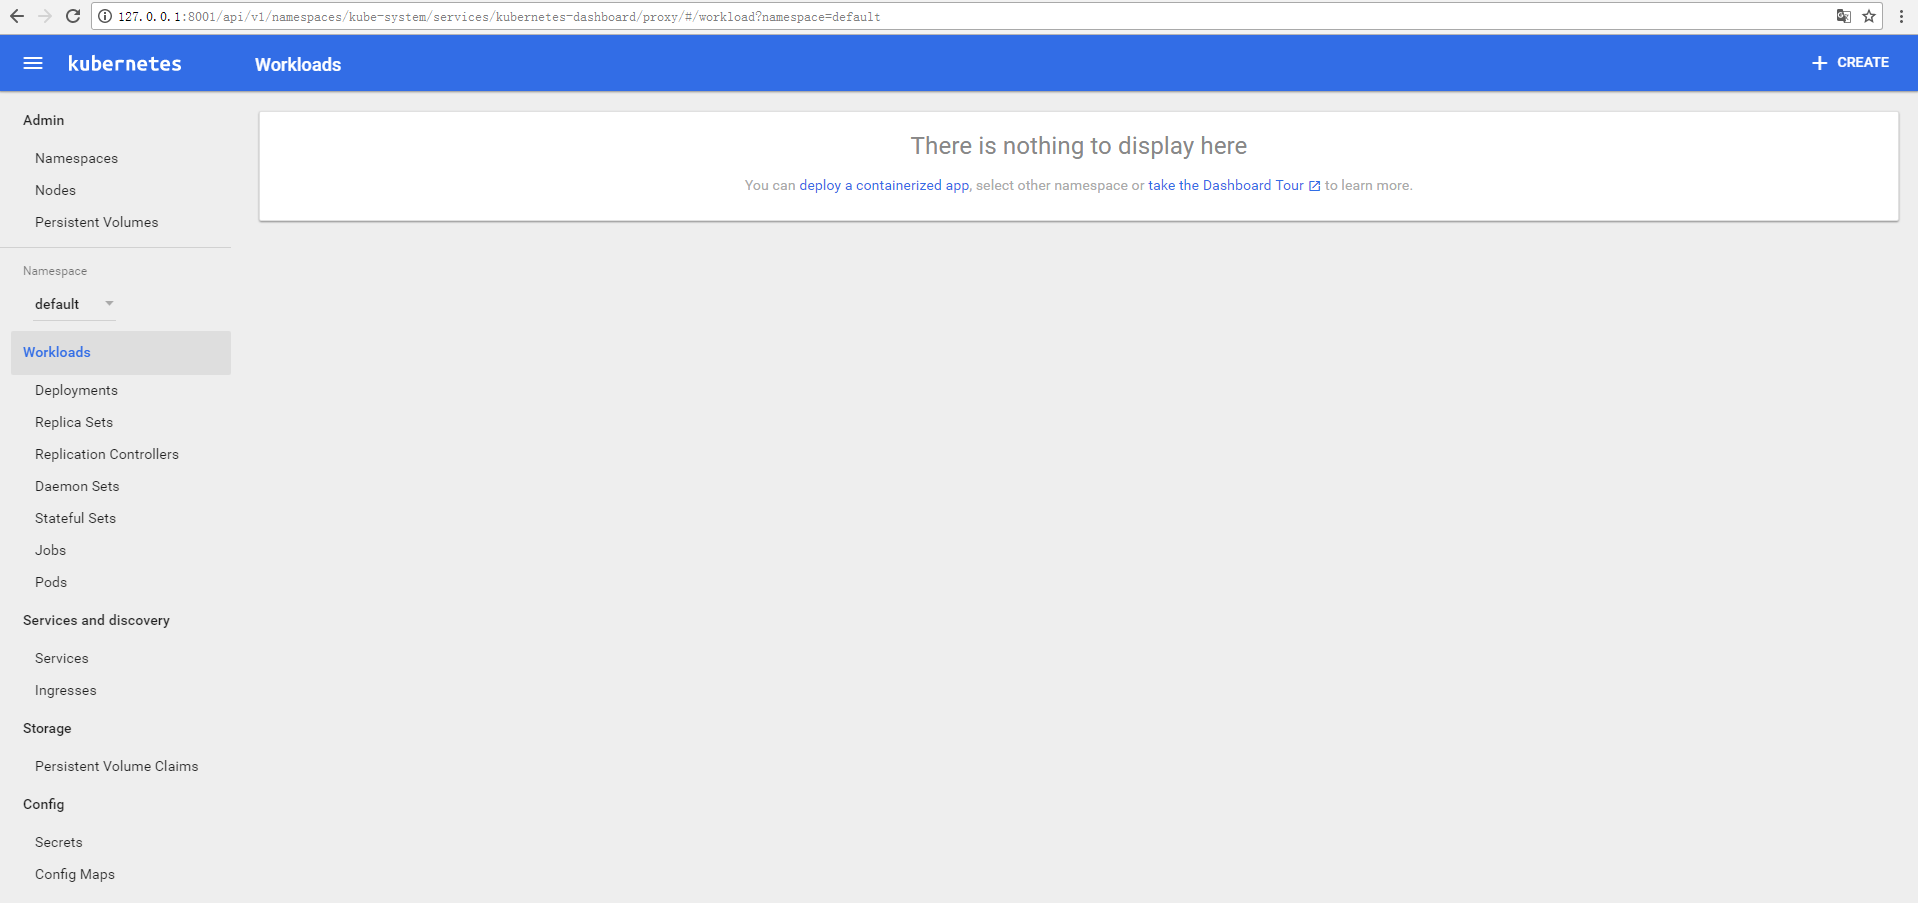
74. Once logged in successfully, the dashboard page will be displayed as shown below.
8<br>
9 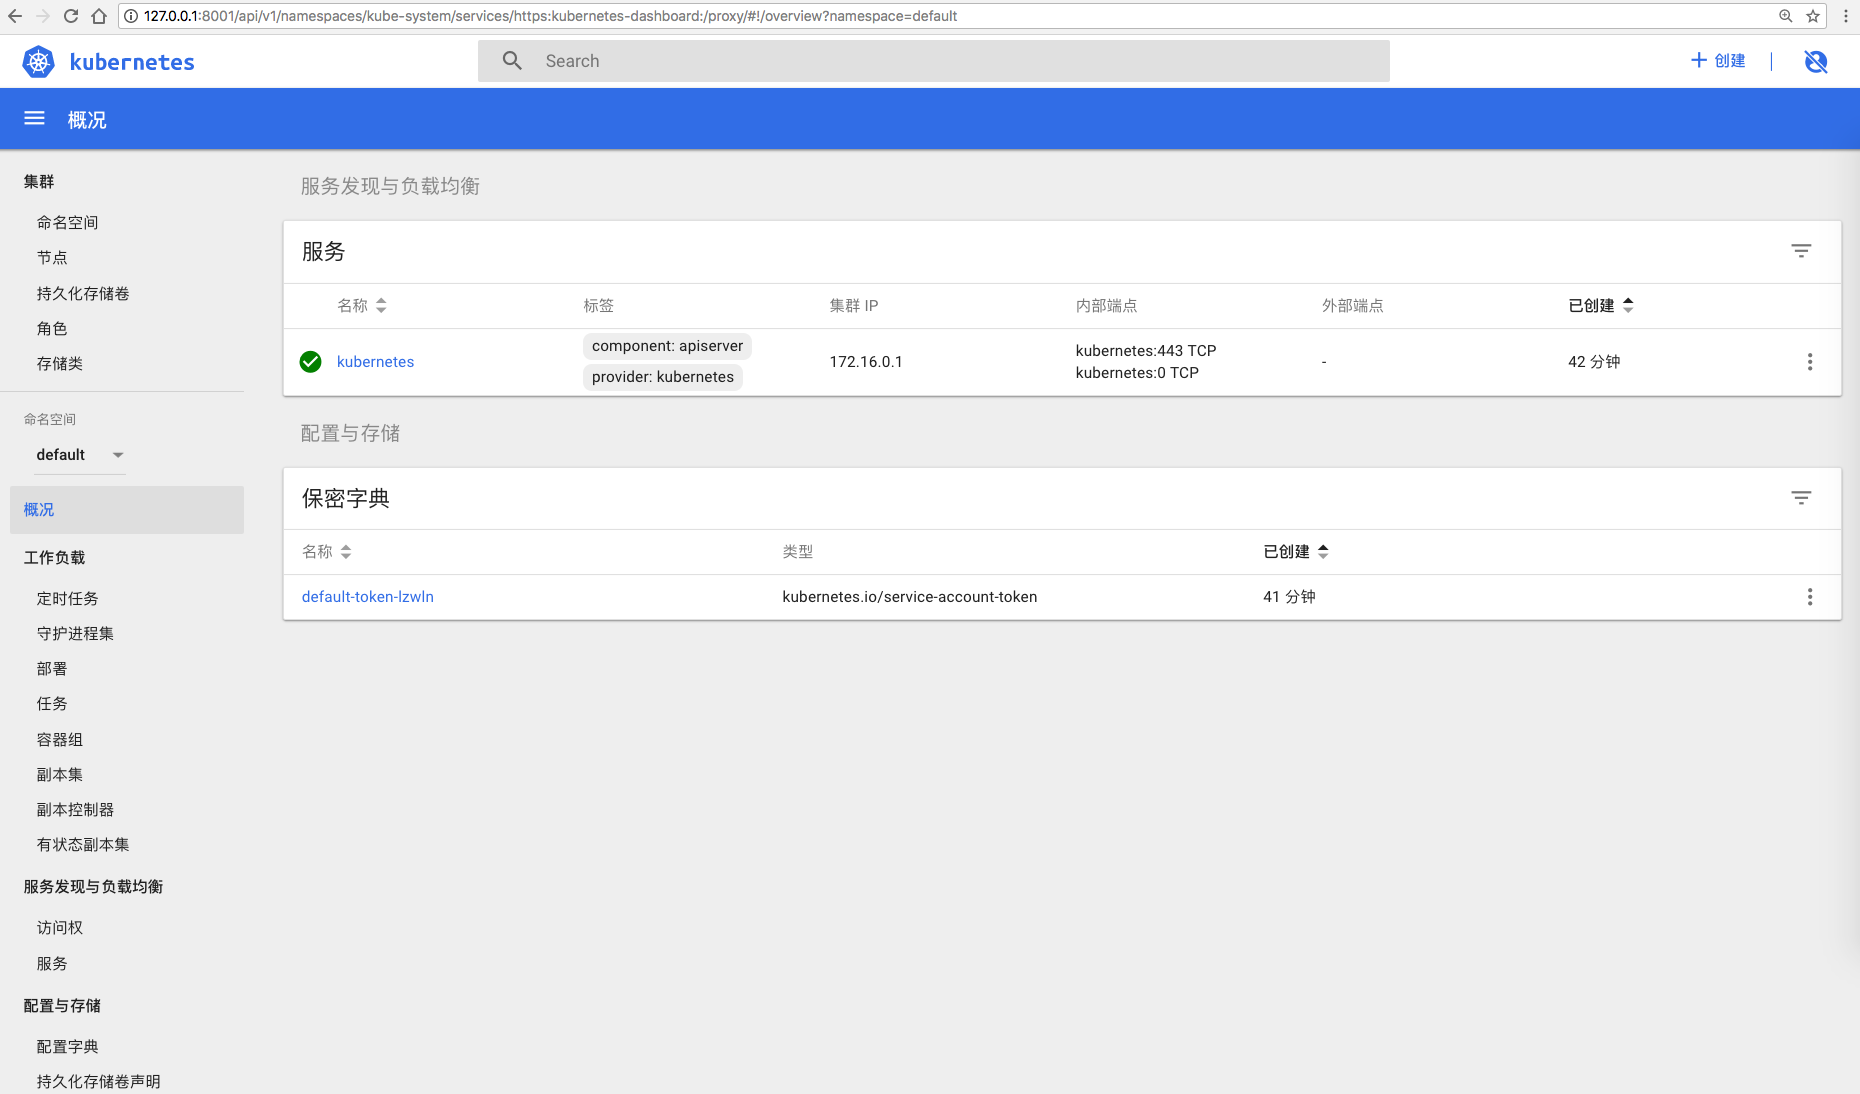
10
11## Create a service via Kubernetes dashboard
12
131. After completing the setup for local access to the Kubernetes Dashboard (Web UI), go to the Dashboard page and click Create in the upper right corner to start creating the service;<br>
14
15 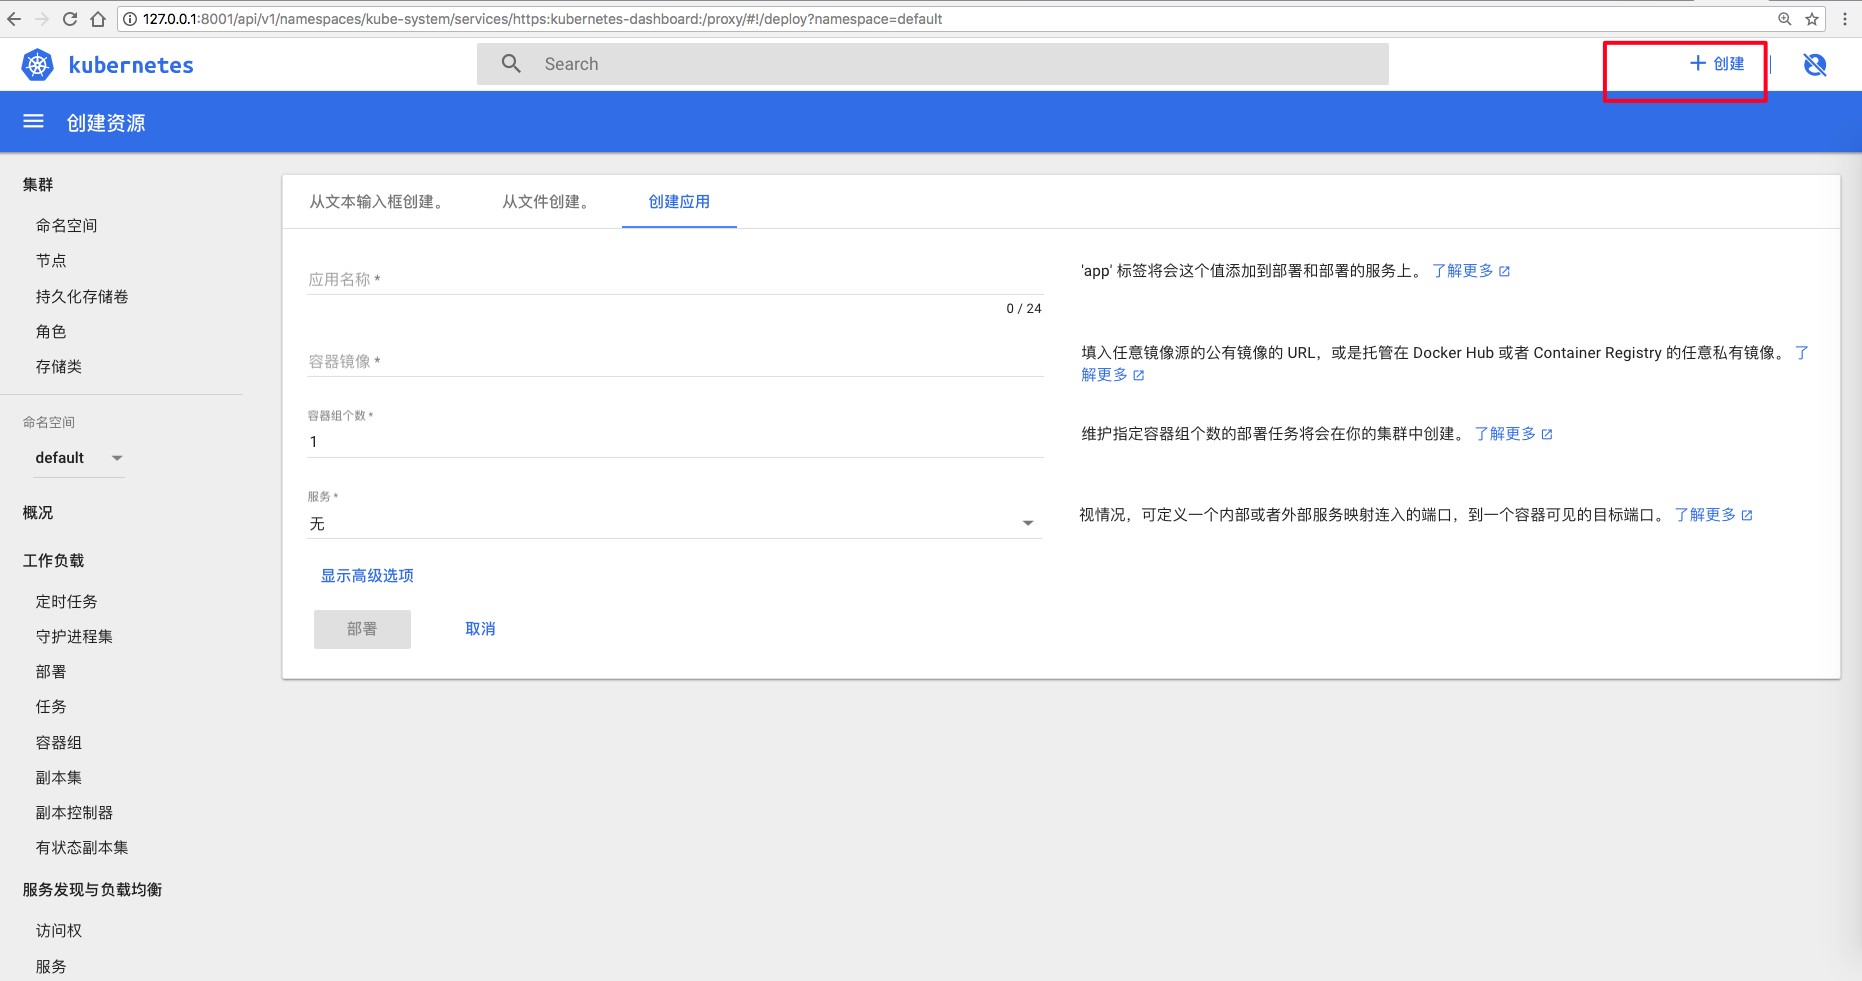
16
172. On the Create Application page, enter the name of the application to be created, the container image, and the number of pods;<br>
18
19 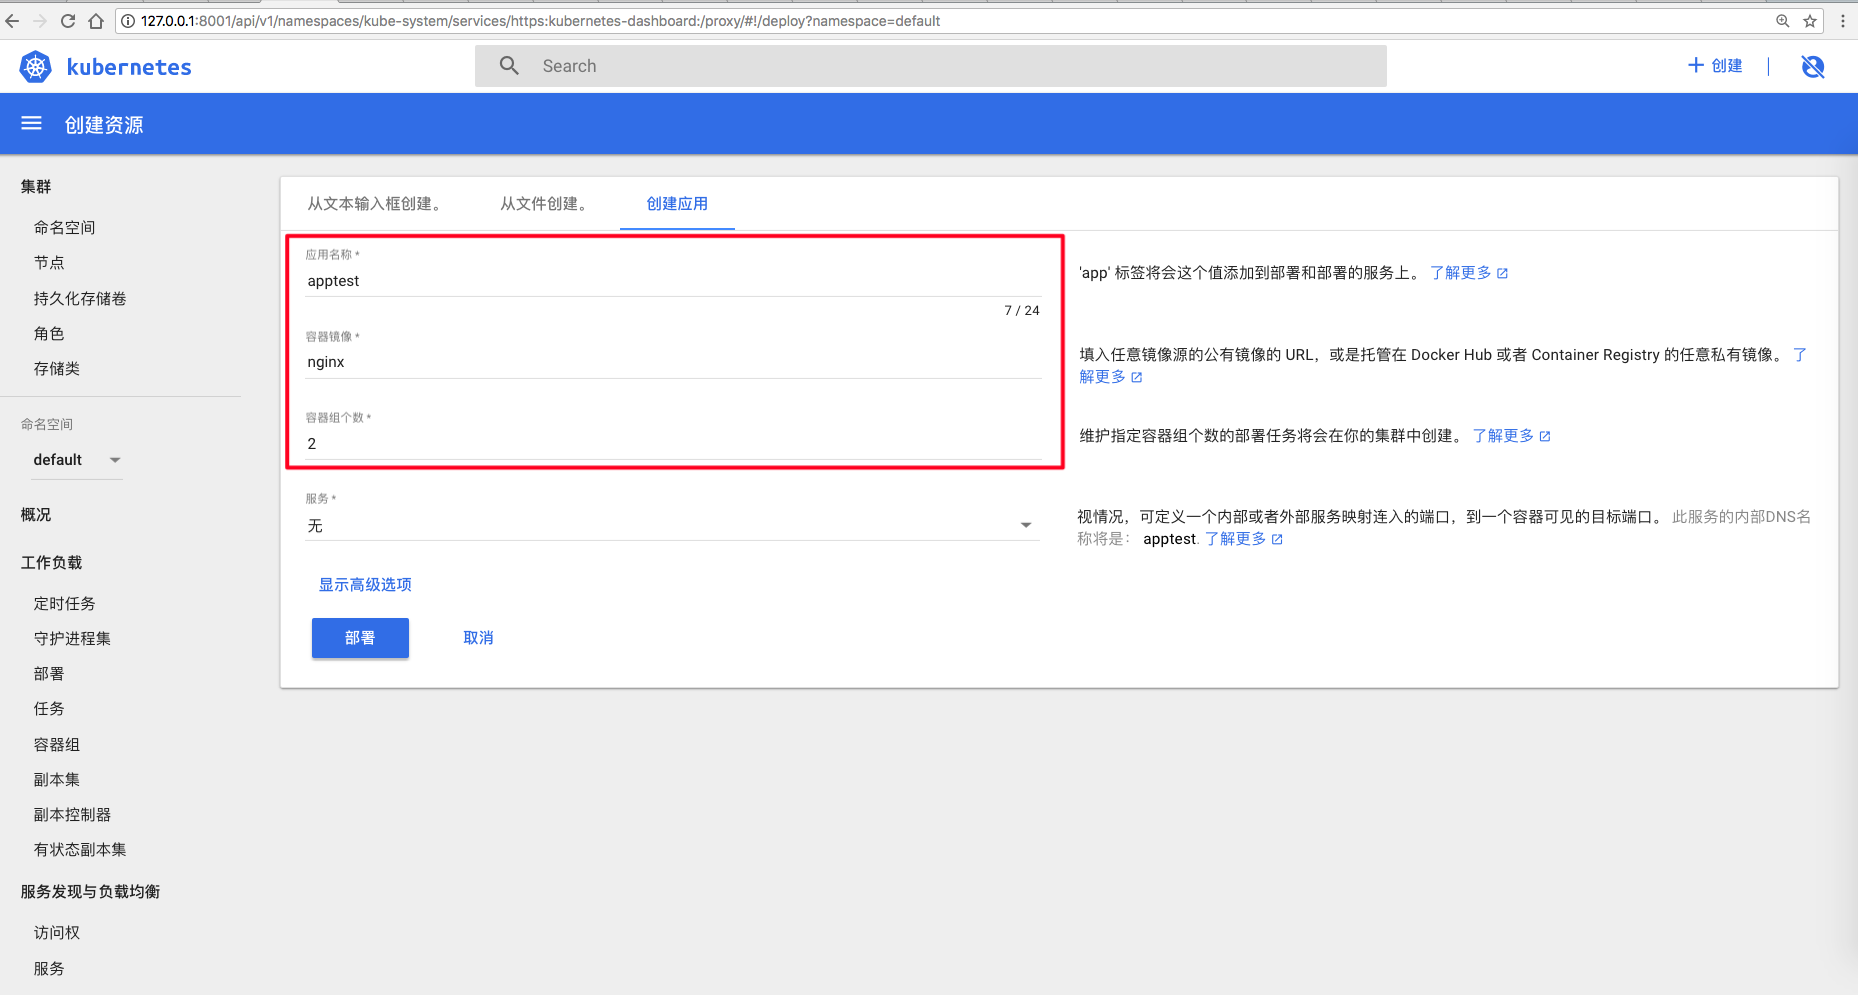
20
213. For the service type, select External. The system will automatically create an EIP and a BLB in the background. Configure ports: Enter 80 for both the service port and target port; select TCP as the protocol. Click the Deploy button to start creating the service;<br>
22
23 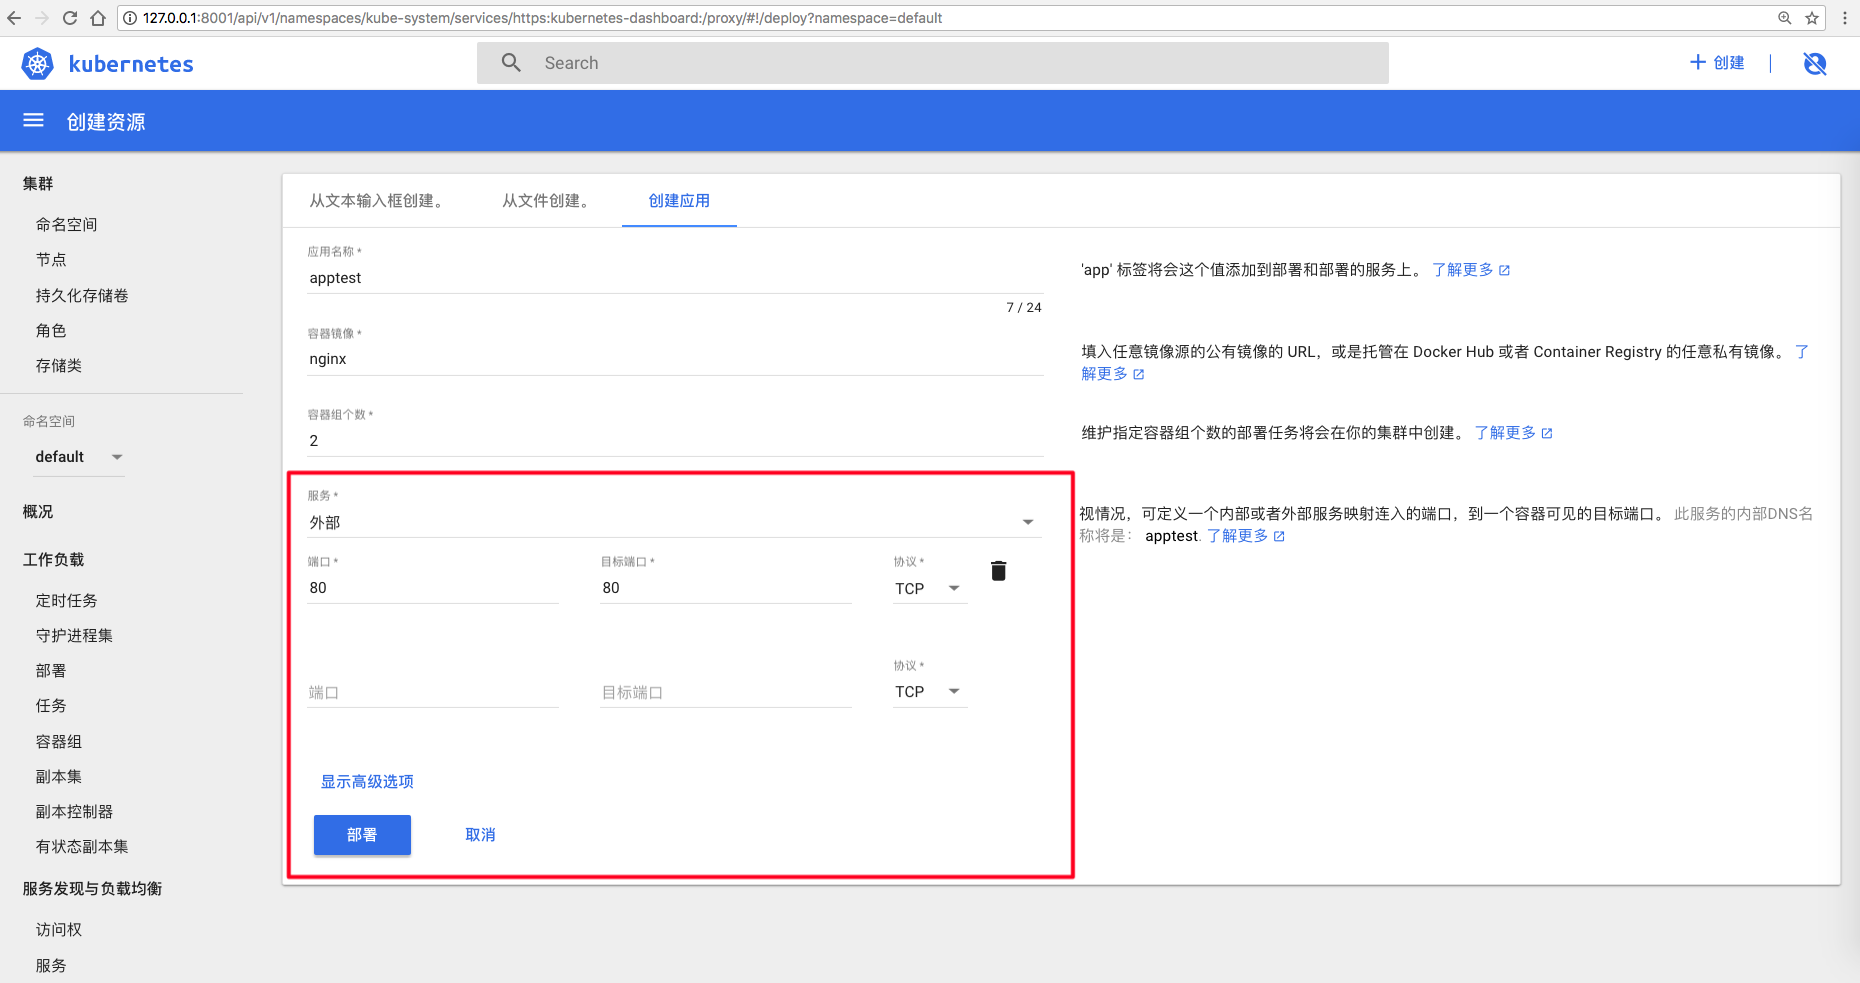
24
254. Wait for the service to be created successfully (you need to refresh the page manually);<br>
26
27 
28
295. On the success page, click Services to enter the service page;<br>
30
31 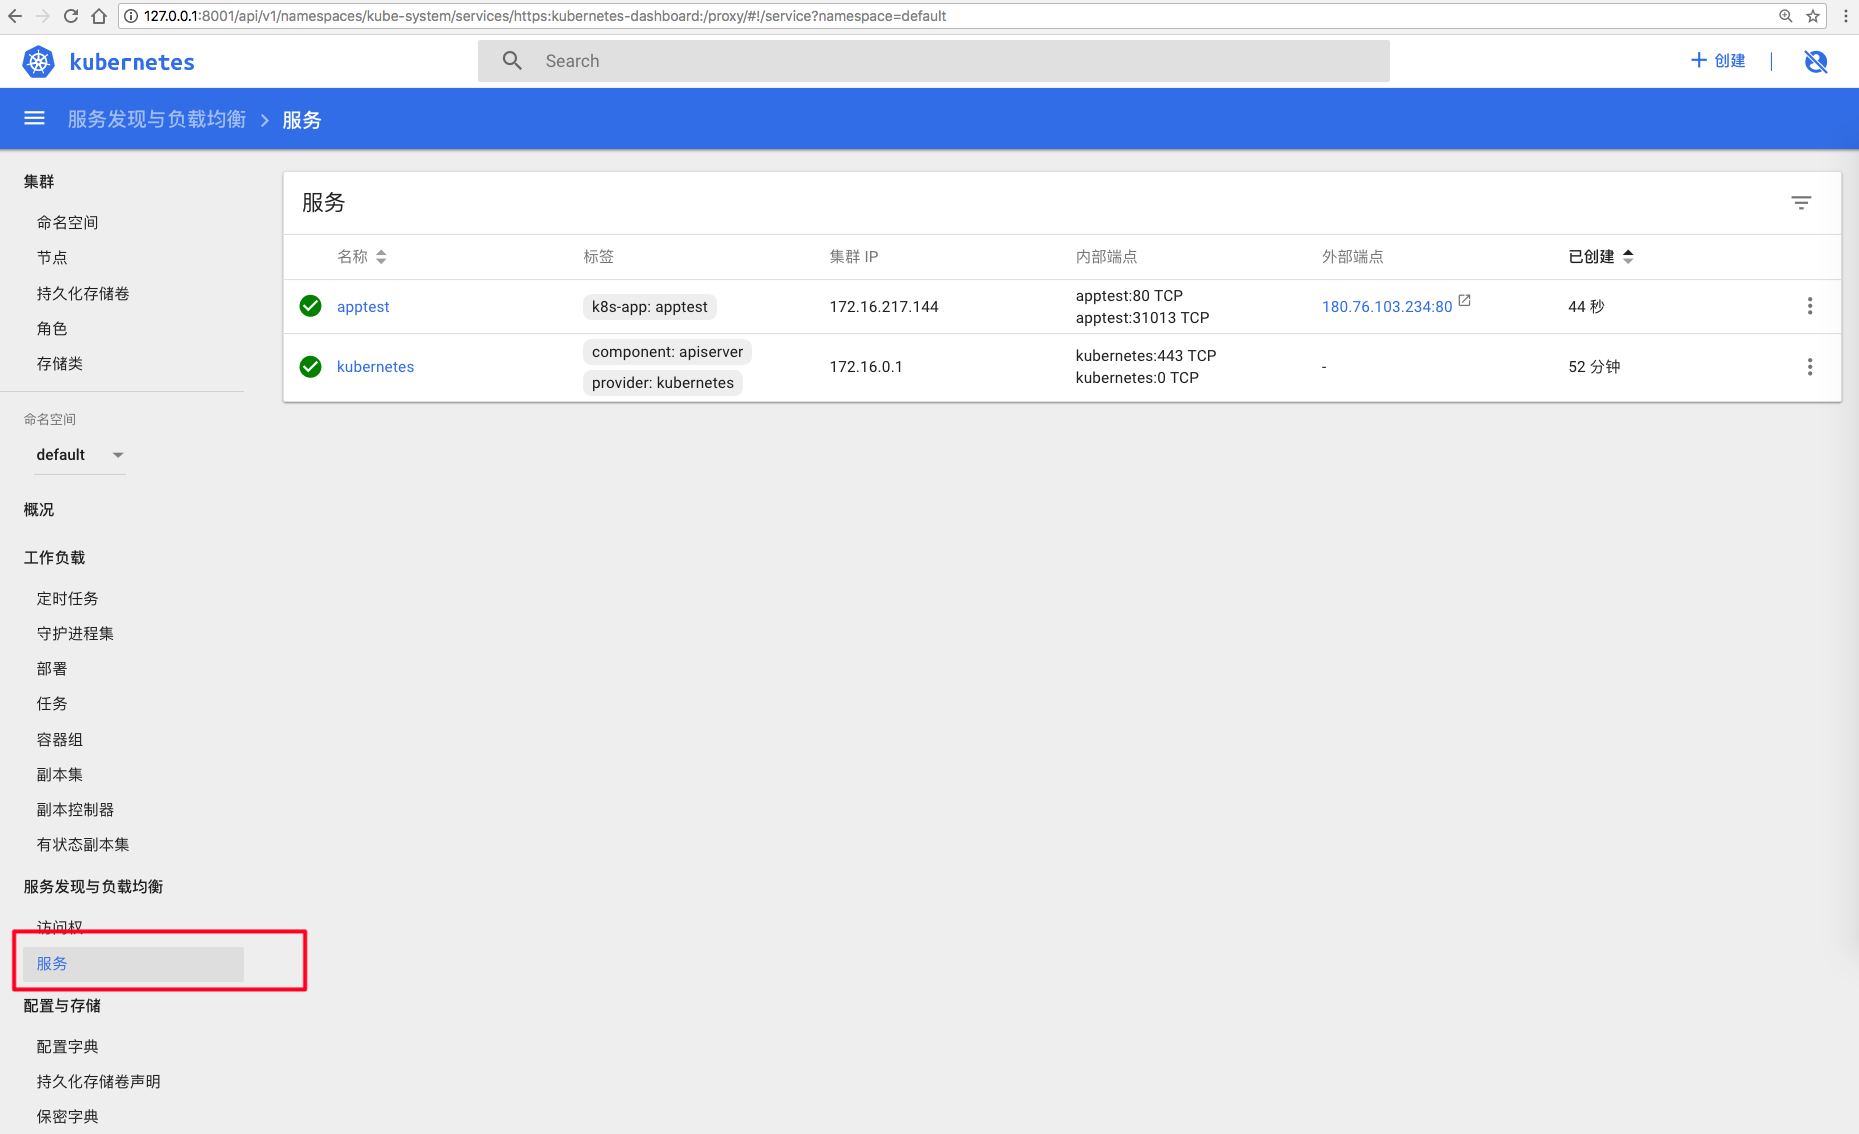
32
336. This page will display the Internet address of the service;<br>
34
35 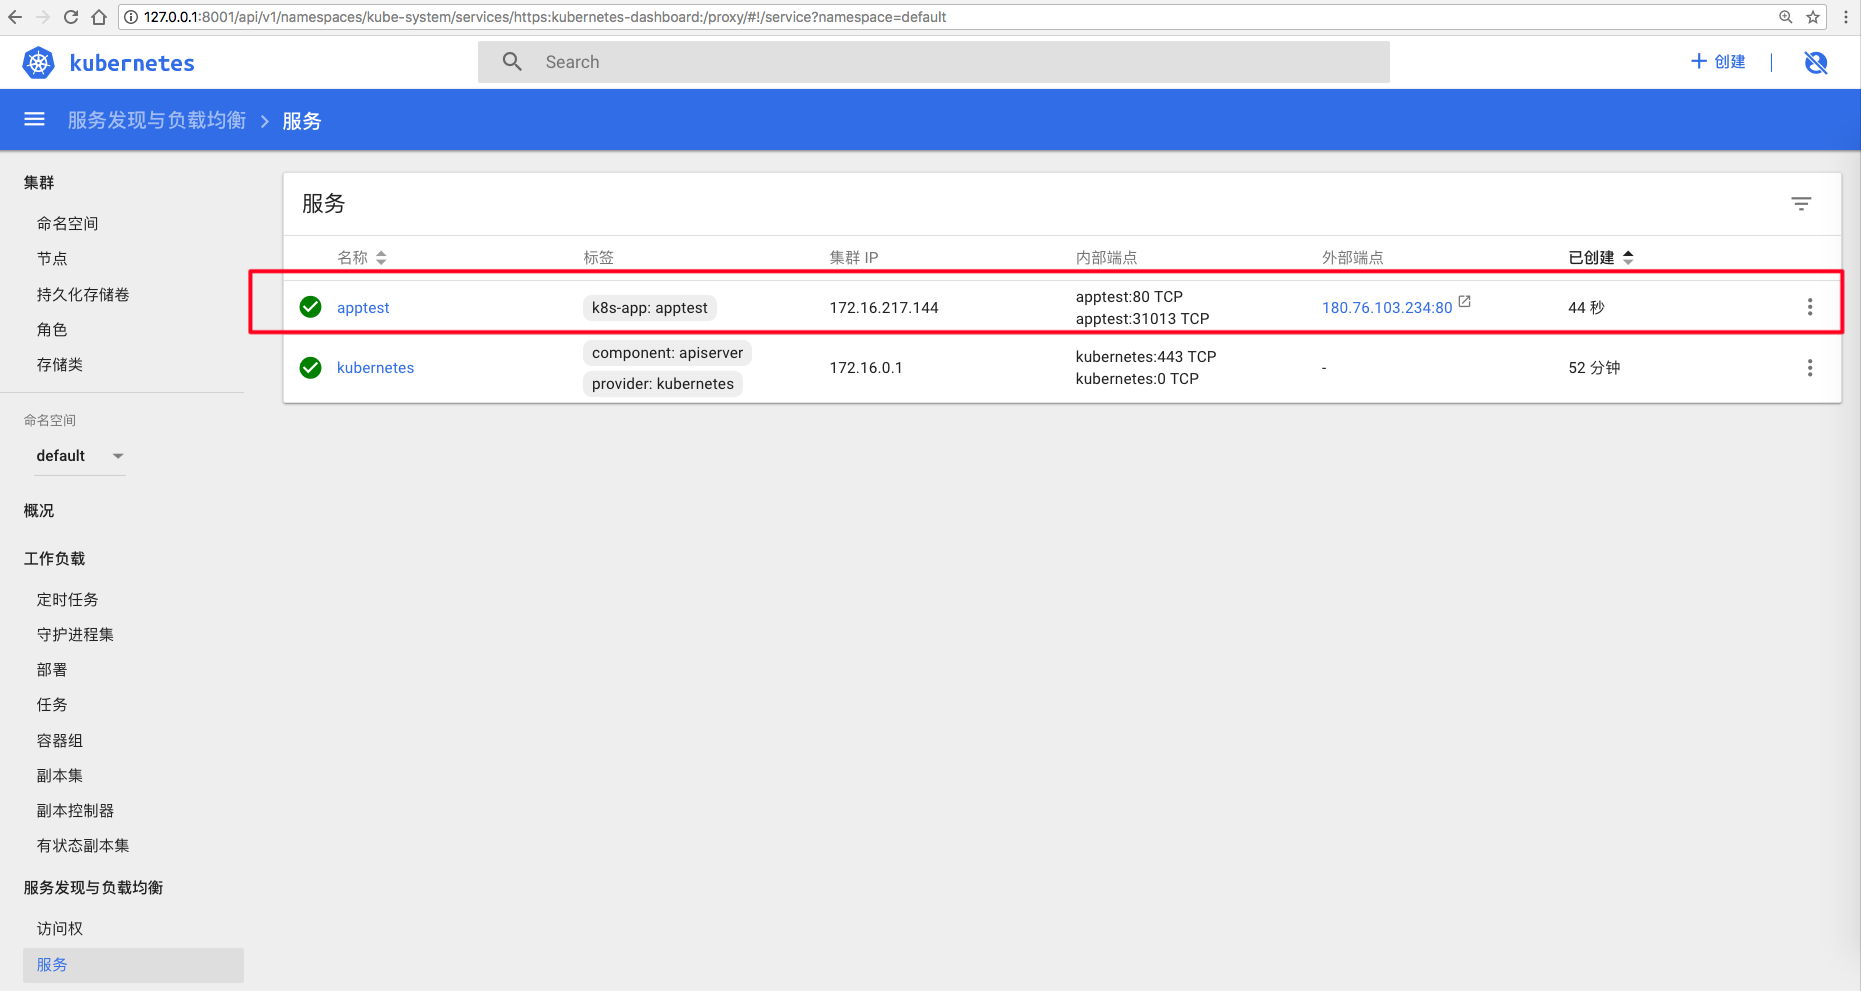
36
377. Enter the Internet address in a browser - if the service page is displayed, the service is created successfully;<br>
38
39 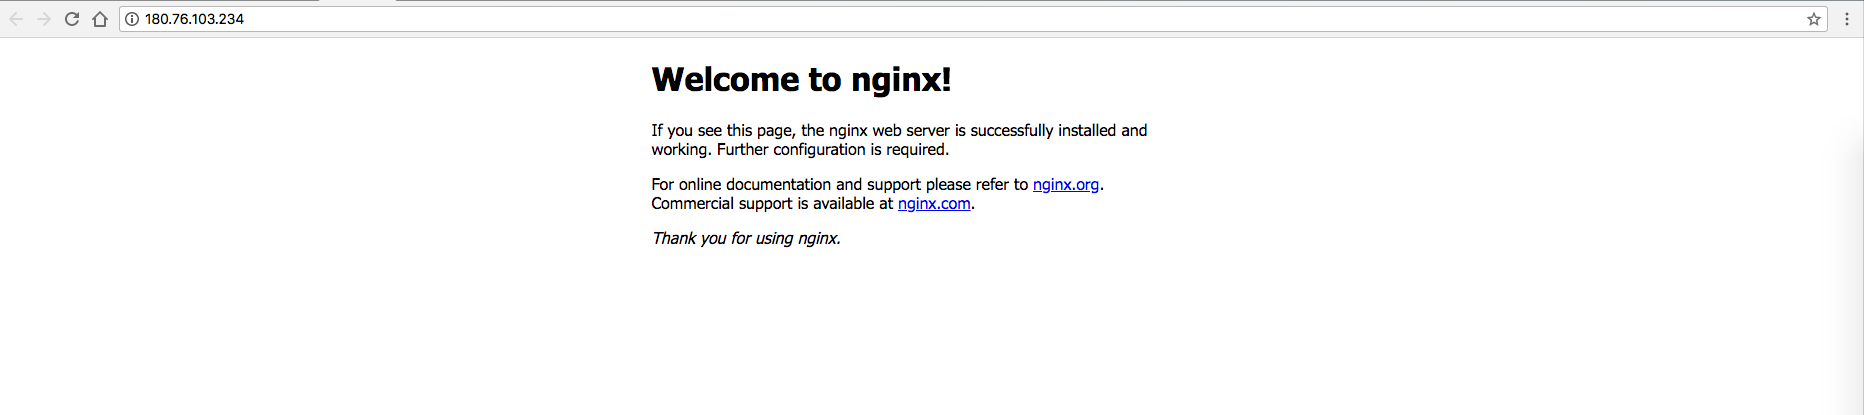
40
41## Create a service using a private image
42
43If you need to use a private image, you must first configure [ImagePullSecrets](https://kubernetes.io/docs/concepts/containers/images/#bypassing-kubectl-create-secrets), and specify this ImagePullSecrets in the resource to be created. The following is a brief introduction to the creation steps. For more detailed information about ImagePullSecrets, refer to [the Official Kubernetes Documentation](https://kubernetes.io/docs/concepts/containers/images/#creating-a-secret-with-a-docker-config).
44
451. Create ImagePullSecrets via kubectl
46
47 First, you need the username and password for your private registry. Use the following command to create an ImagePullSecret named `myregistrykey`
48
49 ```
50 $ kubectl create secret docker-registry myregistrykey --docker-server=DOCKER_REGISTRY_SERVER --docker-username=DOCKER_USER --docker-password=DOCKER_PASSWORD --docker-email=DOCKER_EMAIL
51 secret "myregistrykey" created.
52 ```
53
542. Use the ImagePullSecret in the resource to be created
55
56 For example, the following pod YAML file specifies that the pod uses the private image `registry.baidubce.com/private-online/awesomeapp:v1`, and pulls the image from the registry using the imagePullSecrets `myregistrykey`.
57
58 apiVersion: v1
59 kind: Pod
60 metadata:
61 name: foo
62 namespace: awesomeapps
63 spec:
64 containers:
65 - name: foo
66 image: registry.baidubce.com/private-online/awesomeapp:v1
67 imagePullSecrets:
68 - name: myregistrykey
69
70
713. Specify ImagePullSecrets for service creation in the dashboard
72
73 After successfully creating ImagePullSecrets via kubectl, you can also select to use the ImagePullSecret when creating an application in the dashboard.
74 For example, in the following scenario: <br>
75
76 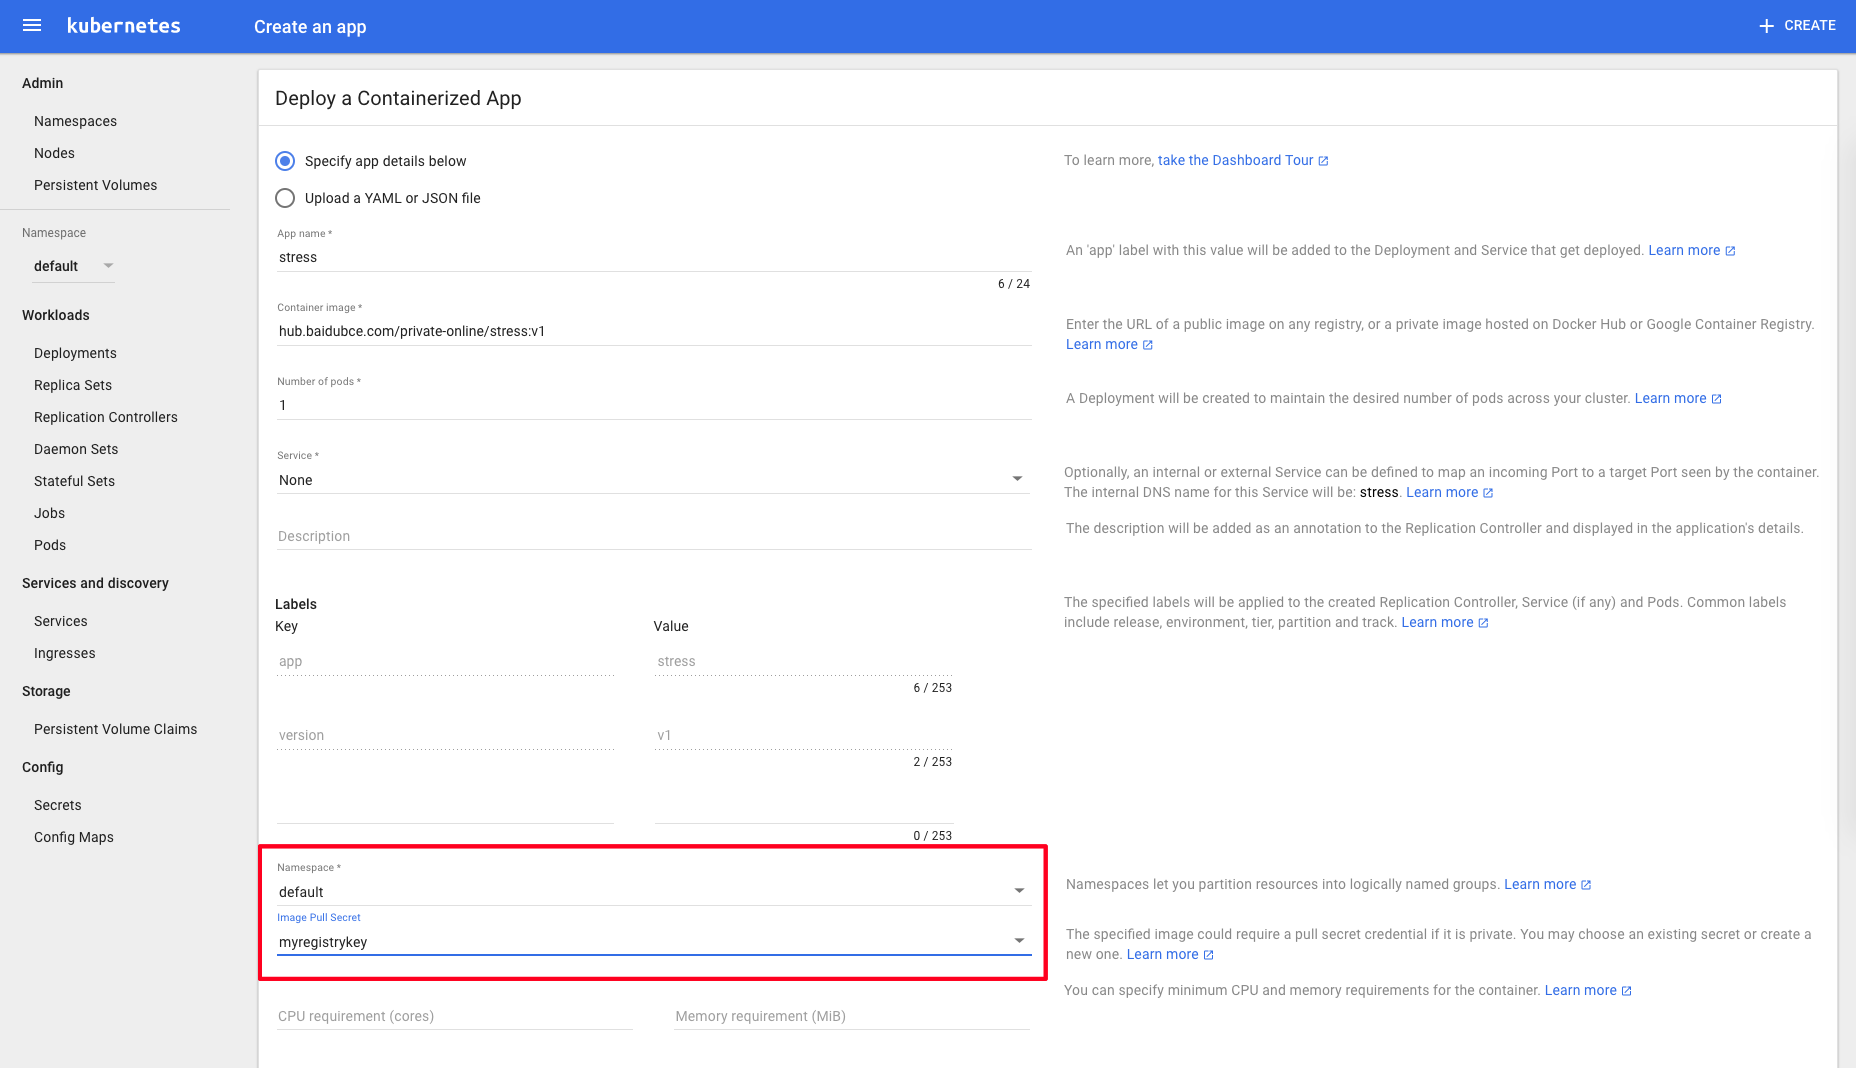
77
78<br>
79 We selected the previously created `myregistrykey` for the application to be created. This allows Kubernetes to have permission to pull the image from the private registry.
80
81## Use kubectl on Windows
82
831. After creating a cluster, download the Windows version of the kubectl tool, such as the 64-bit tool as follows:
84<br>
85 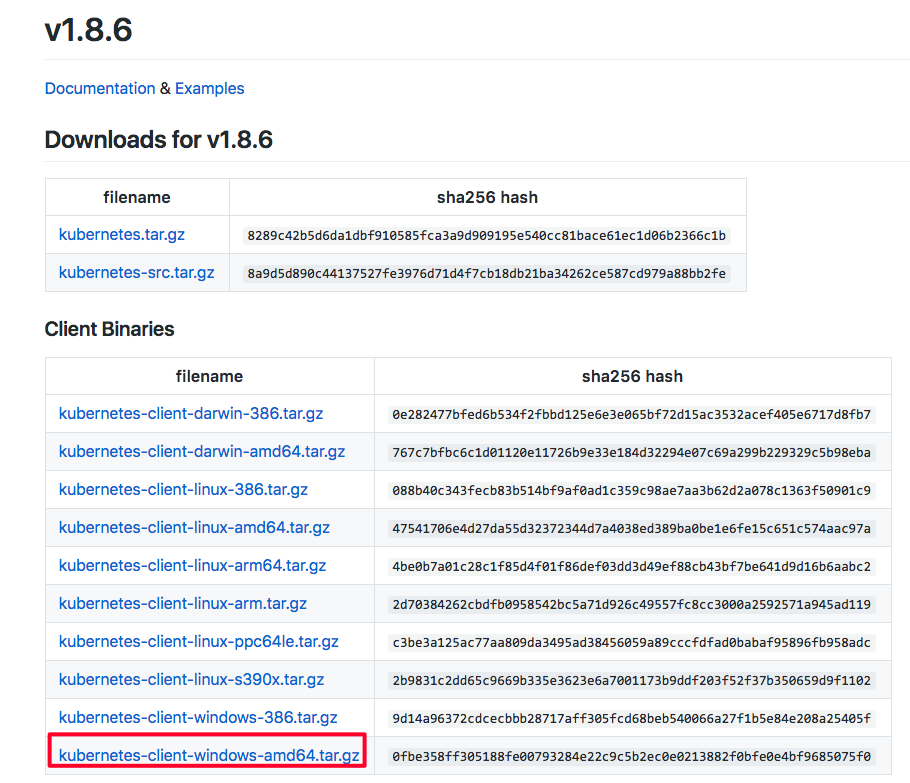
86
87 > **Note:**
88 > > Before downloading kubectl, users need to sign in to their server and use the command `kubectl version` to check the version No. of their created cluster, and then select the corresponding kubectl version to download. For example, if the user's cluster version is 1.8, the kubectl to be downloaded should also be version 1.8. The download link is <https://github.com/kubernetes/kubernetes/blob/master/CHANGELOG/README.md>. Users should download the corresponding version of the tool based on their cluster version.
89
902. After downloading, extract it to any directory, such as placing it under the D drive
91<br>
92 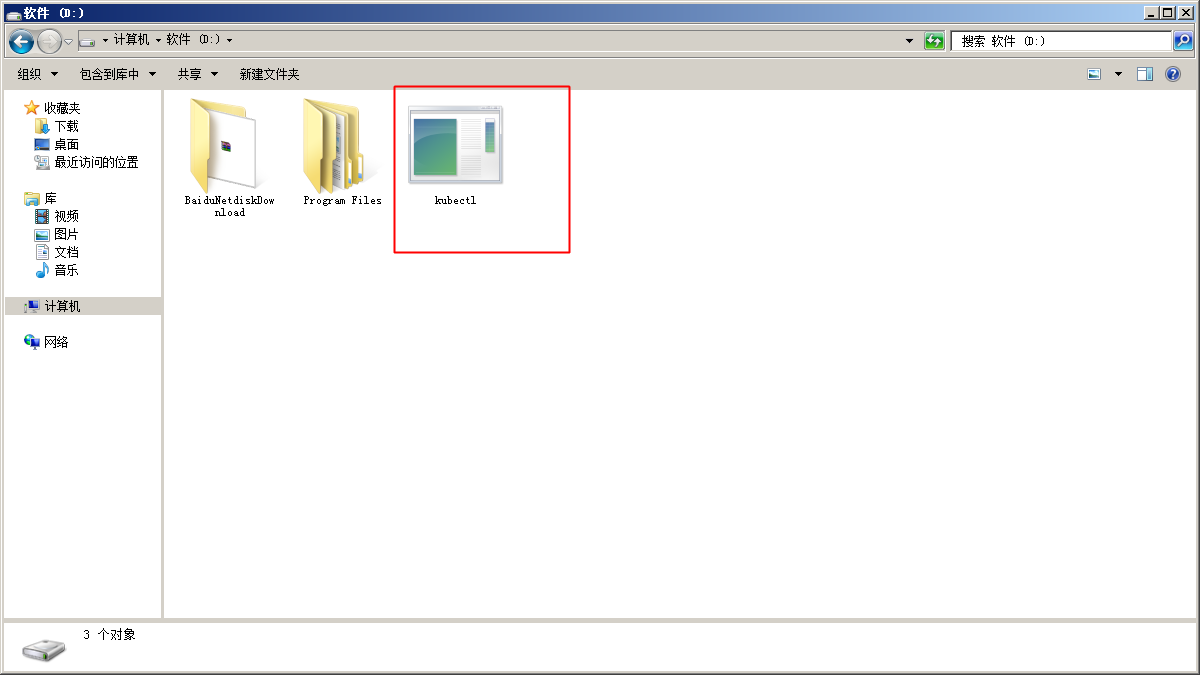
93
943. Navigate to the user folder under the directory `C:\users\`. For example, if the user name is foo, the folder should be `C:\users\foo`. And then, enter this directory and create the folder `.kube`
95<br>
96
97 
98
994. On the cluster list page, download the cluster configuration file, place it in the `.kube` folder created in the previous step, and rename it to `config`
100<br>
101
102 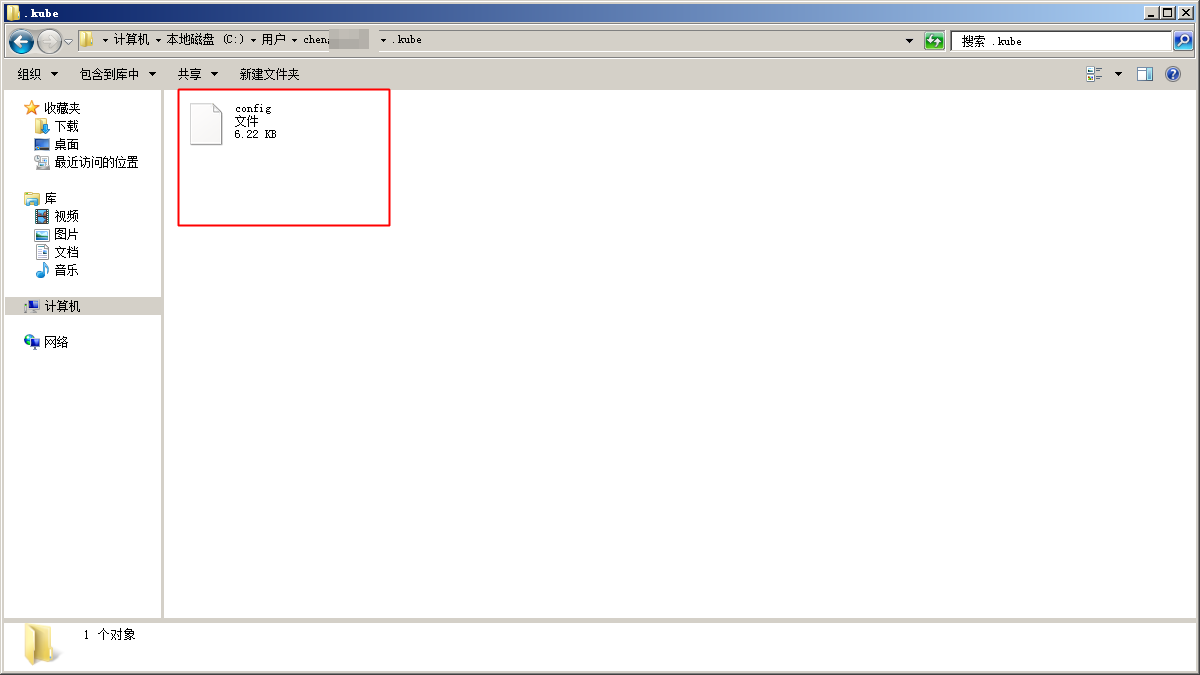
103
1045. Open the Windows command prompt
105<br>
106 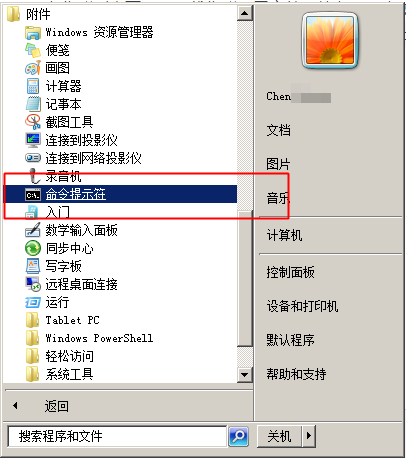
107
1086. Navigate to the directory containing kubectl files and run `kubectl.exe get node` to view cluster nodes.
109<br>
110
111 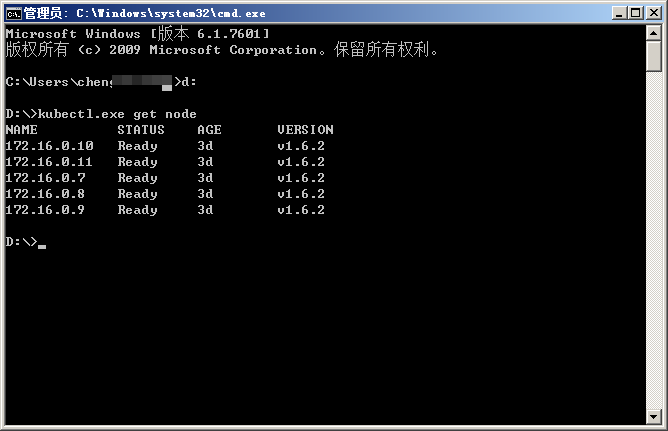
112
1137. In the same directory, create a dashboard.yaml file with the content from the aforementioned dashboard.yaml, for example, it can be created using text editor:
114<br>
115
116 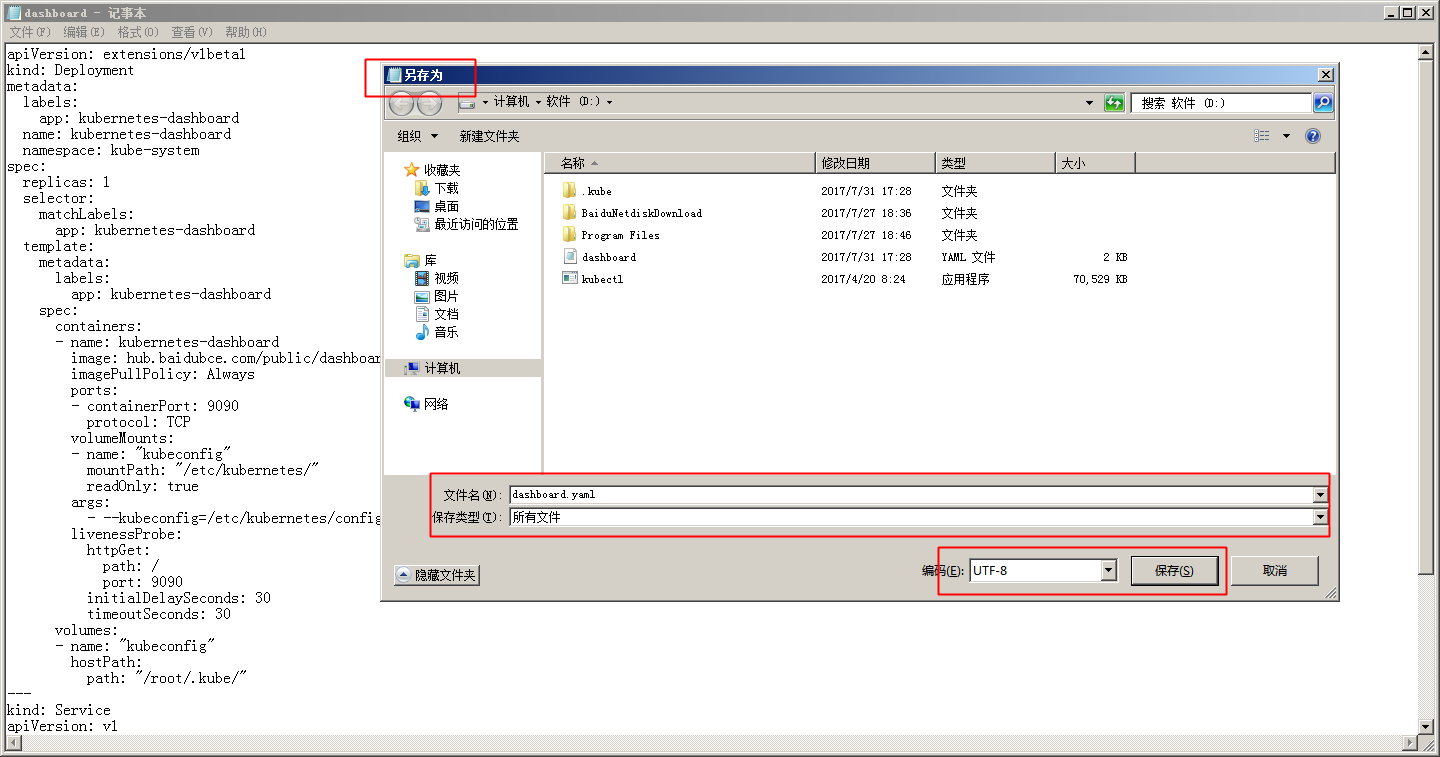
117
1188. And then enter `kubectl.exe create -f dashboard.yaml` to create dashboard
119<br>
120
121 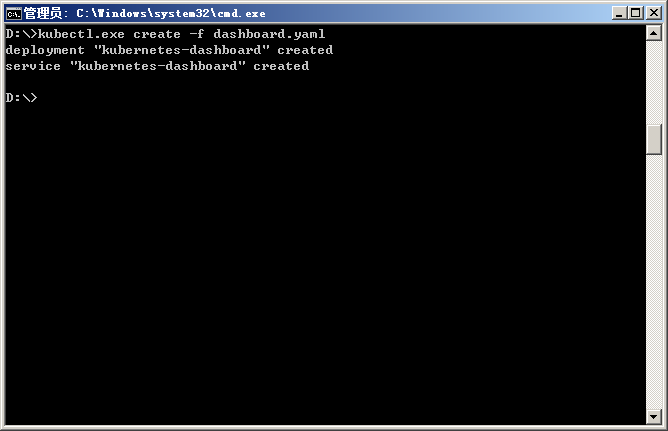
122
1239. Use the `kubectl.exe get pod --all-namespaces` command to check if the creation is successful
124<br>
125
126 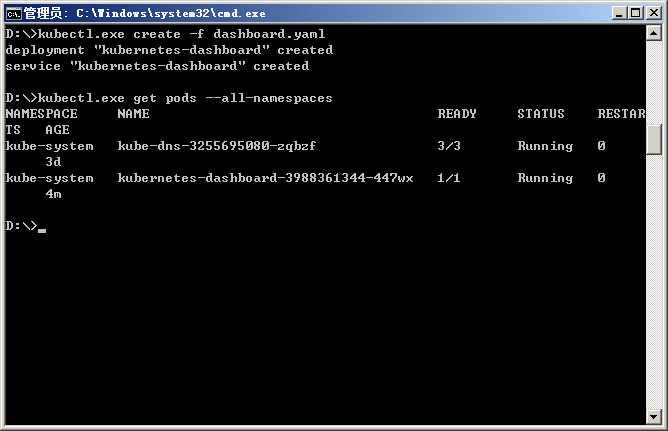
127
12810. Enter `kubectl.exe proxy` to open proxy, and then access dashboard via `127.0.0.1:8001/ui` in browsers
129<br>
130 
131<br>
132