GPUManager component
Updated at:2025-10-27
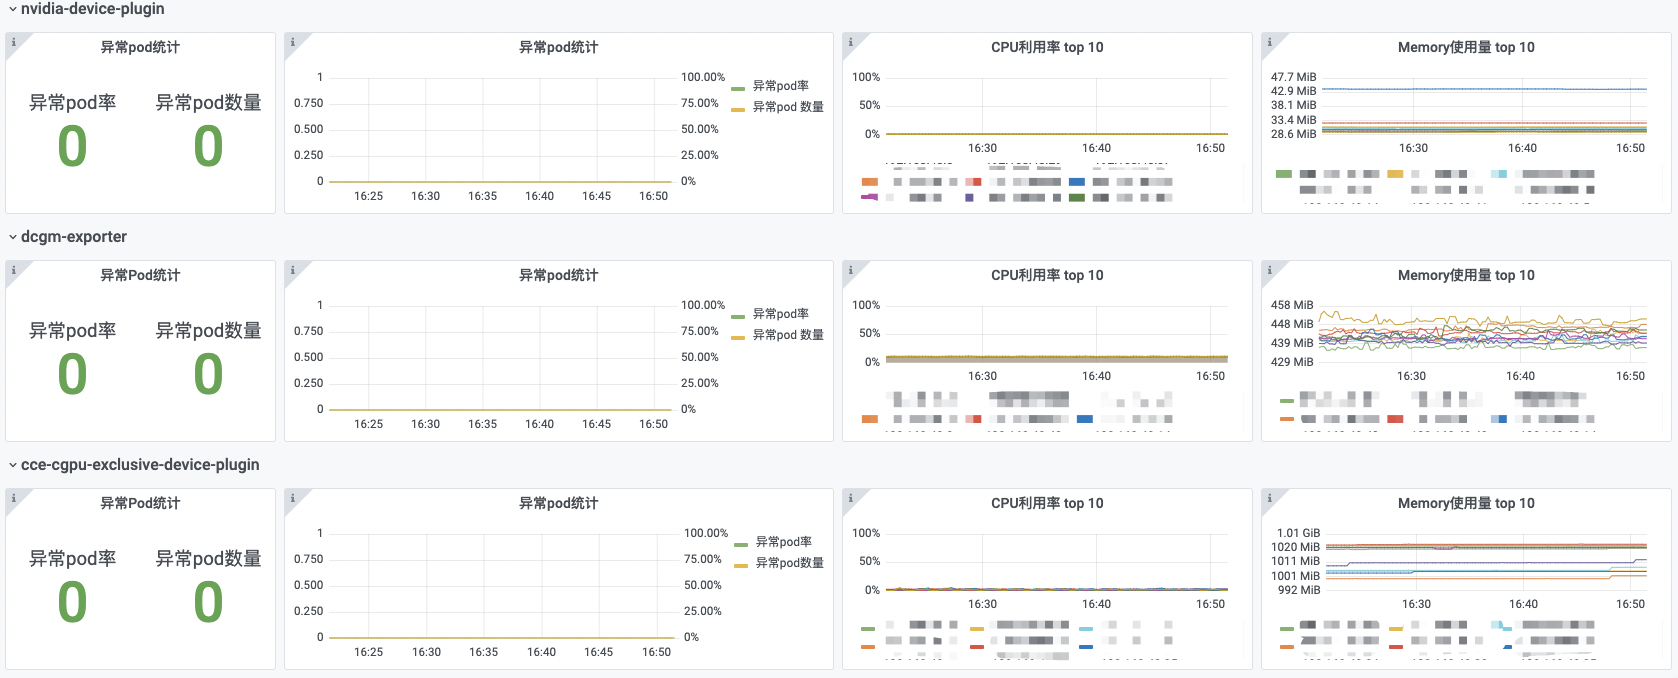
The GPUManager component includes metrics such as the number of abnormal pods, the number of component restarts, and the CPU utilization and memory usage of GPUManager-related components.
Prerequisites
- The CCE GPU Manager component has been installed
- Accessed monitoring instances
- Collection tasks need to be enabled. For details, refer to the document: Access Monitoring Instance and Enable Collection Tasks
Application method
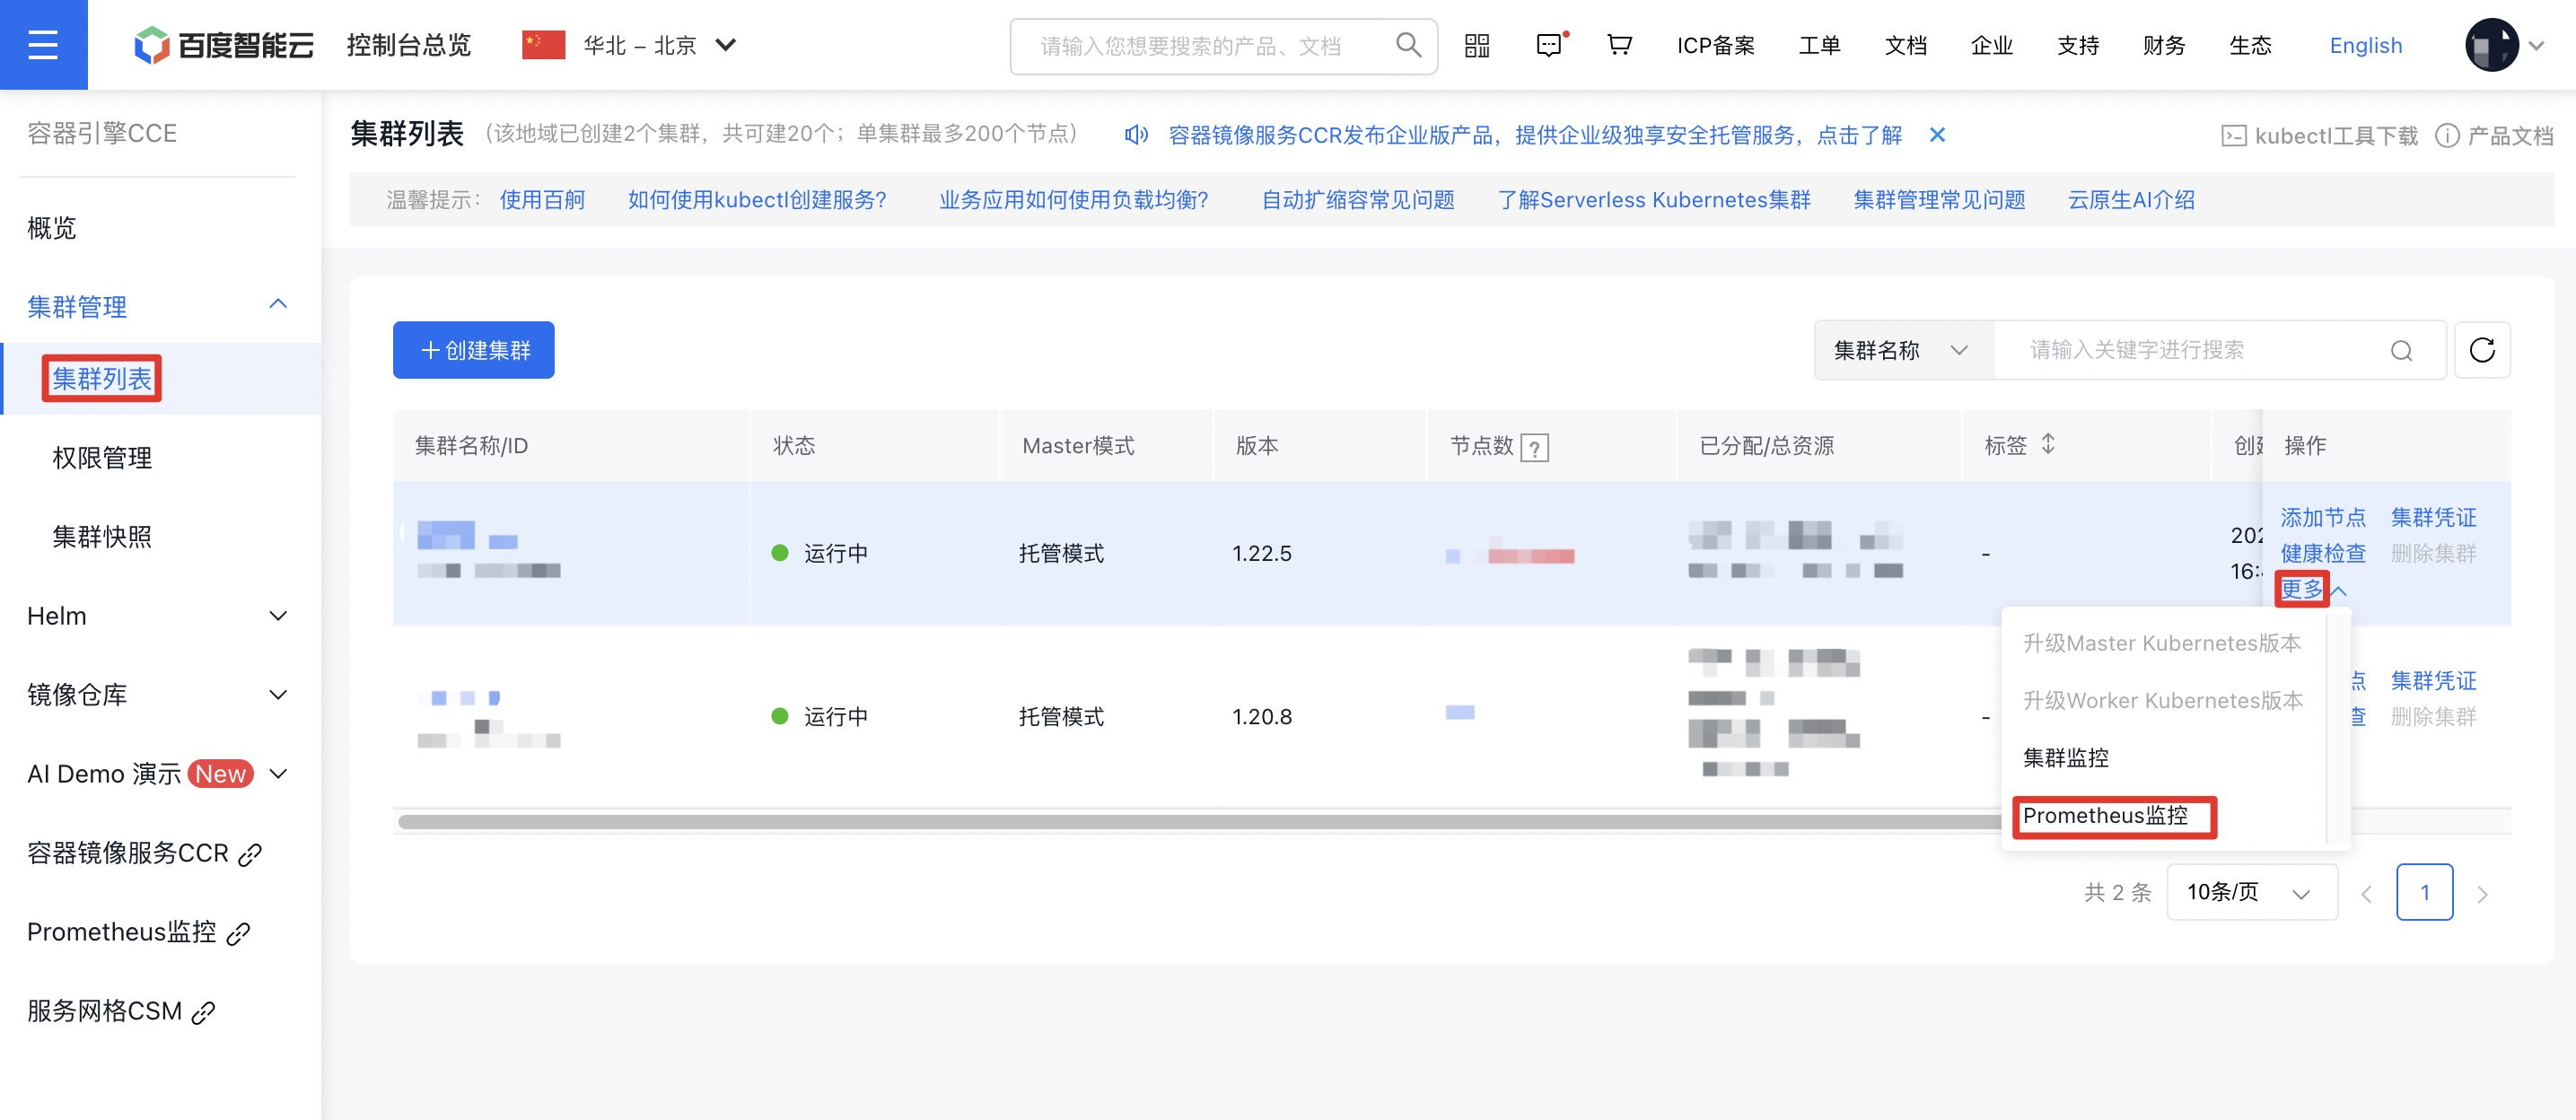
- Sign in to Cloud Container Engine Console (CCE).
- Click Cluster Management on the left sidebar. In the Cluster List, select the Cluster Name you need. Under Actions - More on the right, click Prometheus Monitoring to navigate to the Prometheus Monitoring Service.
- In the options at the bottom of the Prometheus Monitoring Page, select Cloud-Native AI Monitoring, then select GPUManager Component.
GPUManager component is shown as follows
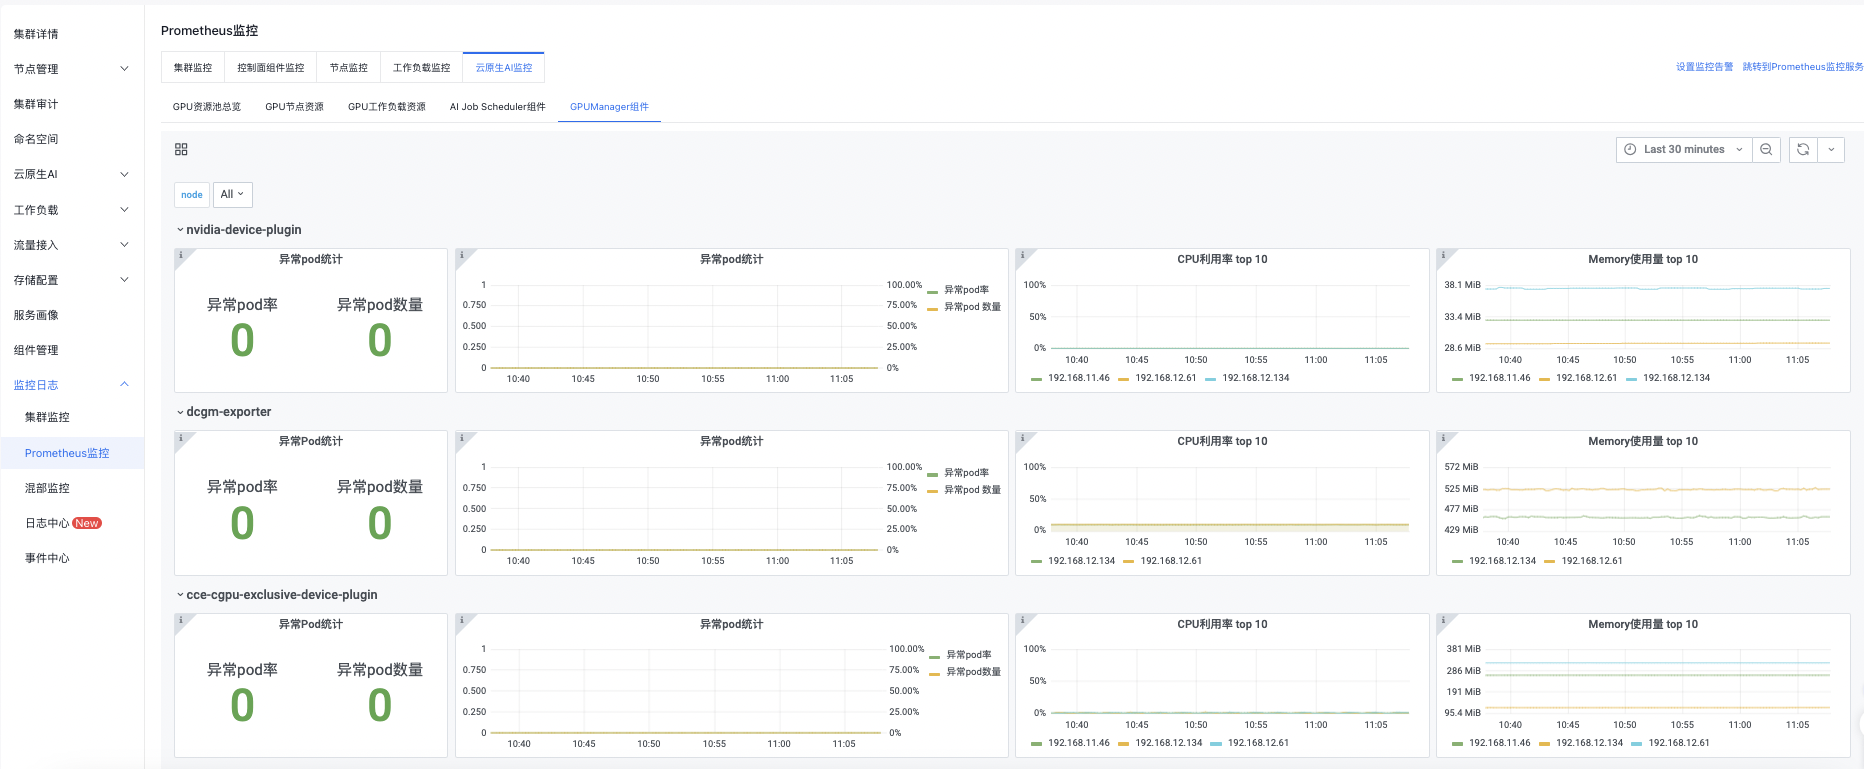
You can click the button in the upper right corner to set monitoring time, manual refresh, and automatic refresh by yourself.
Detailed description of the GPUManager component
| Monitoring items | Description |
|---|---|
| Number of abnormal pods of the GPUManager component | Pods with exception in GPUManager-related components in the current cluster. Metric anomaly: If the count of exceptional Pods exceeds 0, there is an anomaly. The cause of the anomaly must be investigated. |
| Exceptional Pod rate of the GPUManager component | The rate of abnormal pods among GPUManager-related components in the current cluster. |
| Top 10 CPU utilization rate | The top 10 pods with the highest CPU utilization among all GPUManager-related components in the current cluster. |
| Top 10 memory utilization rate | The top 10 pods with the highest memory utilization among all GPUManager-related components in the current cluster. |