
Cluster Audit Dashboard
Operation scenarios
The Cloud Container Engine (CCE) offers an out-of-the-box audit dashboard. After enabling the cluster audit function, CCE automatically configures an audit operation overview dashboard for the cluster. It also provides a built-in global search for BLS, making it easier for users to monitor and retrieve cluster operations for timely issue detection and resolution. The CCE cluster audit dashboard primarily displays general audit records, operating user counts, active nodes, and abnormal access attempts.
Prerequisites
- Successfully Create CCE cluster.
- If the Baidu AI Cloud Log Service (BLS) has been activated, you can log in to the Baidu AI Cloud Log Service (BLS) console to confirm its status.
Description
- The cluster audit log overview dashboard system automatically configures indexes for the logstore. Do not alter the index fields arbitrarily, as changes could lead to a failure in dashboard data display. The index fields are as follows:
Namespace Operating user Status code Operation type Resource object Resource type Field name namespace User.username ResponseStatus.code Verb ObjectRef.Name resource Index namespace User ResponseStatus Verb ObjectRef resource
Operation steps
The cluster audit includes an audit operation overview and global search functions. Follow these steps to access the cluster audit page and begin using the features:
- Sign in to Cloud Container Engine console.
- Select Cluster List in the left navigation bar.
- On the Cluster List page, click on the desired cluster to open the cluster management page.
- In the cluster management page’s left navigation bar, select Security Management - Cluster Audit to the enable the cluster audit function. For details, refer to Enable Cluster Audit.
- Go to the audit operation overview page to check the chart details.
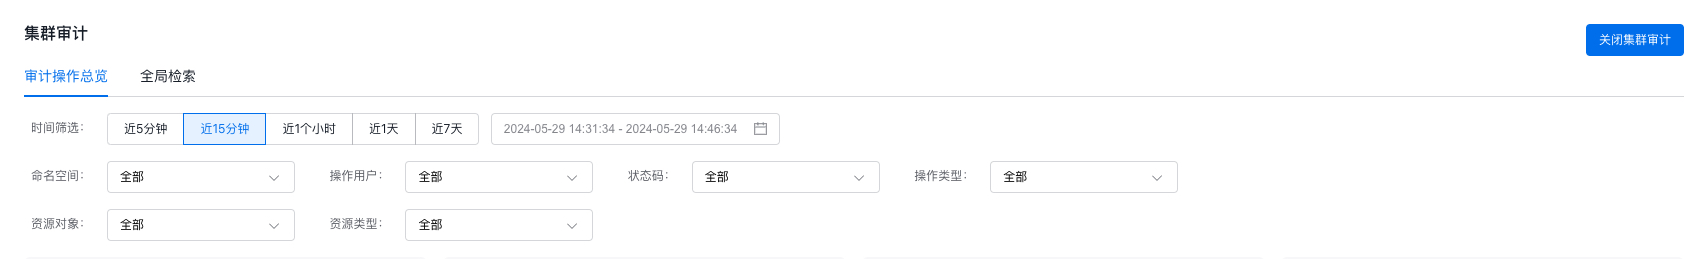
Audit operation overview
To observe APIServer operations across the entire cluster, set filter criteria on the audit operation overview page to view summarized statistic information of core audit logs. For example, statistics, distribution, and key operation trends of general audit logs. Details are shown below:
You may also view additional statistic information on this page, as shown below:
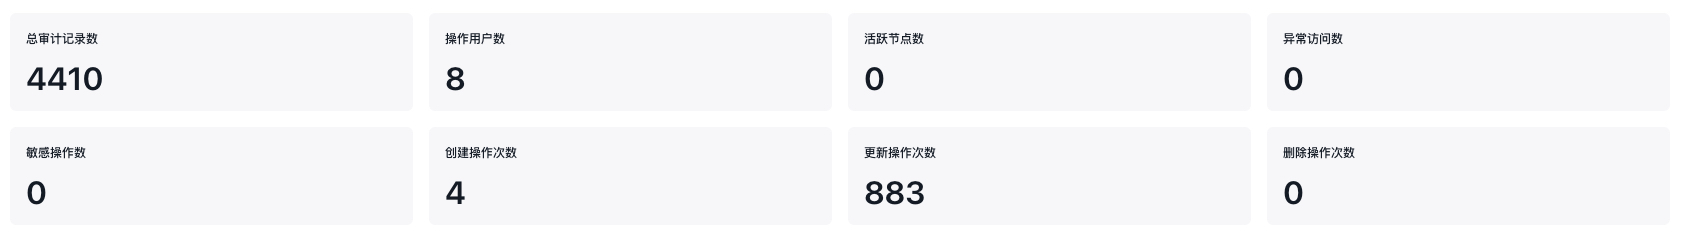
- Statistics dashboard of cluster audit log:
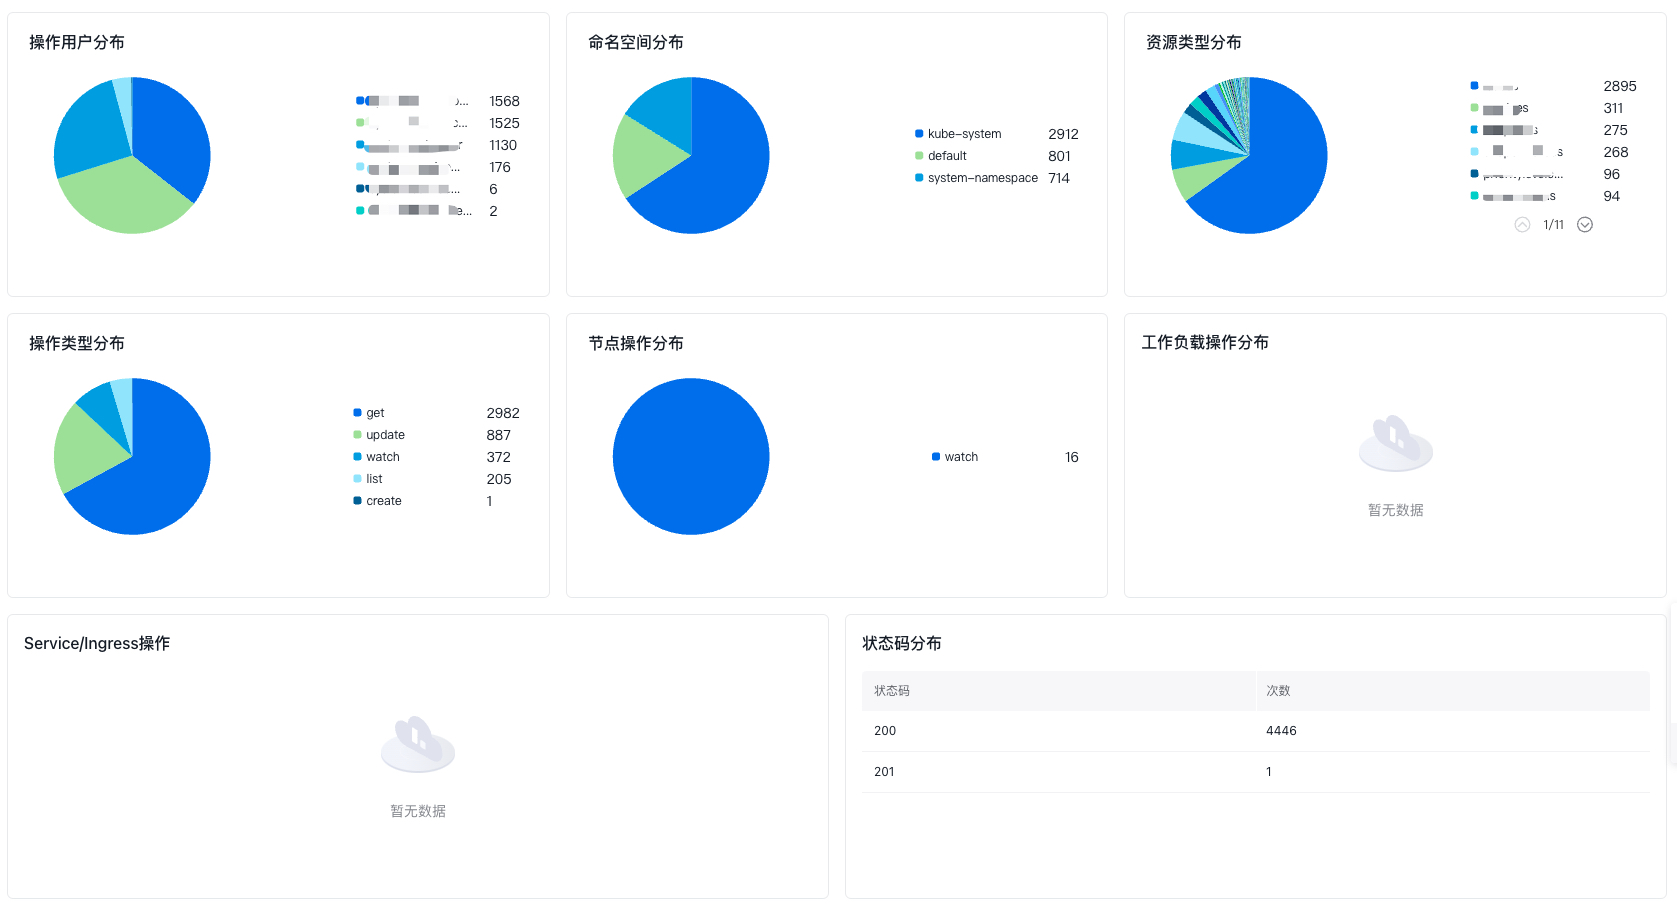
- Distribution dashboard:
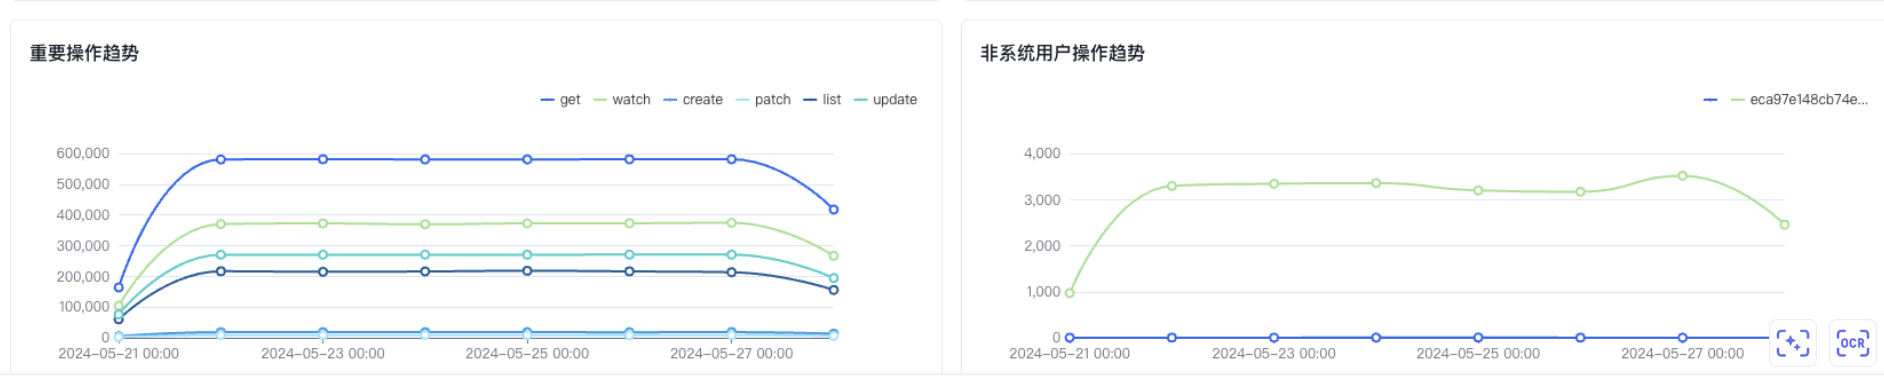
- Key operation trends dashboard:
Query statement introduction
Filter criteria description
Filter criteria descriptions for the CCE cluster audit operation overview dashboard are as follows:
-
Namespace, with the associated BLS query analysis statement as follows:
Plain Text1select distinct namespace -
Operation user, with the associated query analysis statement as follows:
Plain Text1select distinct User->"$.username" -
Status code, with the associated query analysis statement as follows:
Plain Text1select distinct `ResponseStatus`->"$.code" -
Operation type, with the associated query analysis statement as follows:
Plain Text1select distinct Verb -
Resource object, with the associated query analysis statement as follows:
Plain Text1select distinct ObjectRef->"$.Name" -
Resource type, with the associated query analysis statement as follows:
Plain Text1select distinct ObjectRef->"$.Resource"
Key chart descriptions
The important charts in the CCE log audit center dashboard are described as follows:
-
Count of general audit records, with the associated query analysis statement as follows:
Plain Text1select count(1) as “record count” -
Operation user count, with the associated query analysis statement as follows:
Plain Text1select count(DISTINCT User->"$.username") as “user count” -
Count of active nodes, with the associated query analysis statement as follows:
Plain Text1select count(DISTINCT User->"$.username") as “node count” where (locate("system\:node\:", User->"$.username") = 1) -
Abnormal access counts, with the associated query analysis statement as follows:
Plain Text1select count(1) as “access count” where (User->"$.username" ="system:kube-scheduler") AND (ResponseStatus->"$.code" >= 400) -
Sensitive operation count, with the associated query analysis statement as follows:
Plain Text1select count(1) as “operation count” from log where (Verb = 'create' AND (`ObjectRef`->'$.Subresource' = 'exec')) OR (Verb = 'create' AND (`ObjectRef`->'$.Subresource' = 'attach') AND (`ObjectRef`->'$.Resource' = 'pods')) OR (Verb = 'get' AND (`User`->"$.username" != 'apiserver') AND (locate('system:node', `User`->"$.username") != 1) AND (`ObjectRef`->'$.Resource' = 'secrets')) OR (Verb = 'delete' AND (locate('system:node', `User`->"$.username") != 1) AND ((locate('system:serviceaccount:kube-system', `User`->"$.username")) != 1) AND ((`User`->"$.username") != 'system:apiserver') AND (locate('system:kube-scheduler', (`User`->"$.username")) != 1) AND (locate('system:kube-controller-manager', `User`->"$.username") != 1)) -
Creation operation count, with the associated query analysis statement as follows:
Plain Text1select count(1) as “operation count” from log where Verb = 'create' -
Update operation count, with the associated query analysis statement as follows:
Plain Text1select count(1) as “operation count” where Verb in ('update','patch') -
Deletion operation count, with the associated query analysis statement as follows:
Plain Text1select count(1) as “operation count” where Verb = 'delete' -
Operation user distribution, with the associated query analysis statement as follows:
Plain Text1select `User`->"$.username" as ‘username’,count(*) as cn group by ‘username’ order by cn desc -
Namespace distribution, with the associated query analysis statement as follows:
Plain Text1select namespace as ‘namespace’,count(*) as cn group by namespace order by cn desc -
Resource type distribution, with the associated query analysis statement as follows:
Plain Text1select resource as ‘Resource type’,count(*) as cn group by resource order by cn desc -
Operation type distribution, with the associated query analysis statement as follows:
Plain Text1select Verb as ‘operation type’,count(*) as cn group by Verb order by cn desc -
Status code distribution, with the associated query analysis statement as follows:
Plain Text1select `ResponseStatus`->"$.code" as ‘status code’,count(*) as cn group by ‘status code’ order by cn desc -
Node operation distribution, with the associated query analysis statement as follows:
Plain Text1select Verb as ‘operation type’, count(*) as cn where `resource` = 'nodes' group by ‘operation type’, `resource` order by cn desc -
Workload operation distribution, with the associated query analysis statement as follows:
Plain Text1select Verb as ‘operation type’, count(*) as cn where ‘operation type’ in ('create', 'delete') and `resource` in ('deployments','statefulsets','daemonsets','jobs','cronjobs') group by ‘operation type’, `resource` order by cn desc -
Service/Ingress distribution, with the associated query analysis statement as follows:
Plain Text1select Verb as ‘operation type’, count(*) as cn where ‘operation type’ in ('create', 'delete') and `resource` in ('ingressess','services') group by ‘operation type’, `resource` order by cn desc -
Key operation trend, with the associated query analysis statement as follows:
Plain Text1select histogram(cast(@timestamp as timestamp),interval 1 minute) as t, Verb, count(1) as ‘operation count’ where Verb in ('create','delete','update','patch') group by t, Verb order by t limit 10000 -
Non-system user operation trend, with the associated query analysis statement as follows:
Plain Text1select histogram(cast(@timestamp as timestamp),interval 1 minute) as t, `User`->"$.username" as ‘user name’, count(1) as `count` where ((locate("system:", `User`->"$.username") = 0) AND ((`User`->"$.username") not like 'apiserver') AND ((`User`->"$.username") not like "kube-controller-manager") AND ((`User`->"$.username") not like "kube-apiserver-kubelet-client")) group by t, ‘user name’ order by t limit 10000