
View the Pod
A Pod is the smallest deployable unit in Kubernetes, representing a standalone instance of an application. It can consist of a single container or multiple tightly-connected containers. Use the container service console to view Pods, update configurations, or manually scale container applications.
View the Pod
-
Navigate to Product Services > Cloud Container Engine (CCE), select a cluster, and click Workload > Pod to enter the Pod list.
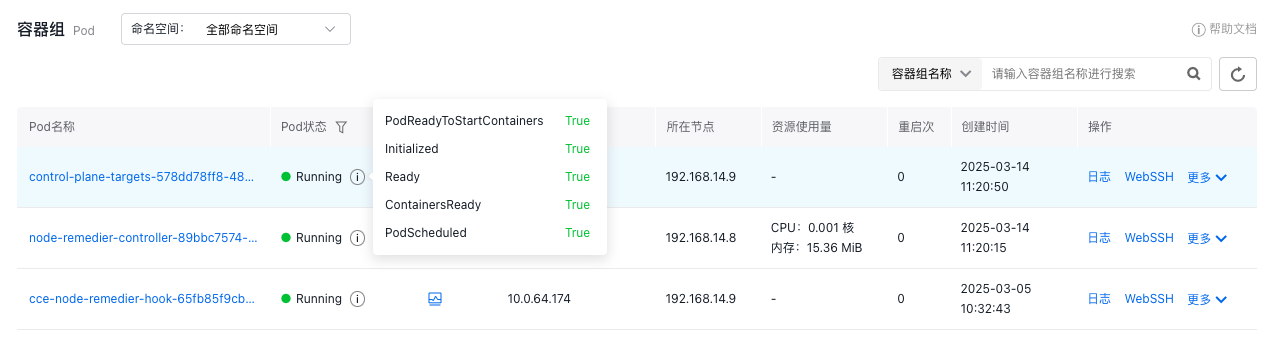
- Pod status: Displays the native Phase status of the Pod along with health check results.
- CPU usage: Shows the current CPU utilization in cores.
- Memory usage: Shows the current memory consumption in bytes (e.g., 100 MiB).
- List data: Displays details of all Pods, including container statuses and logs.
- Click the monitoring icon in the Pod list, and then the Pod Monitor page will pop up in the system. For more information, please refer to Monitor Clusters with Prometheus.
-
Click the name of the target Pod on the Pod List page to enter its details page. The details page includes:
- Basic information: Includes name, namespace, associated workload, status, Pod IP, node location, tags, annotations, and creation time.
- Network details: Node IP and Pod IP.
- Additional details: Container list and storage.
-
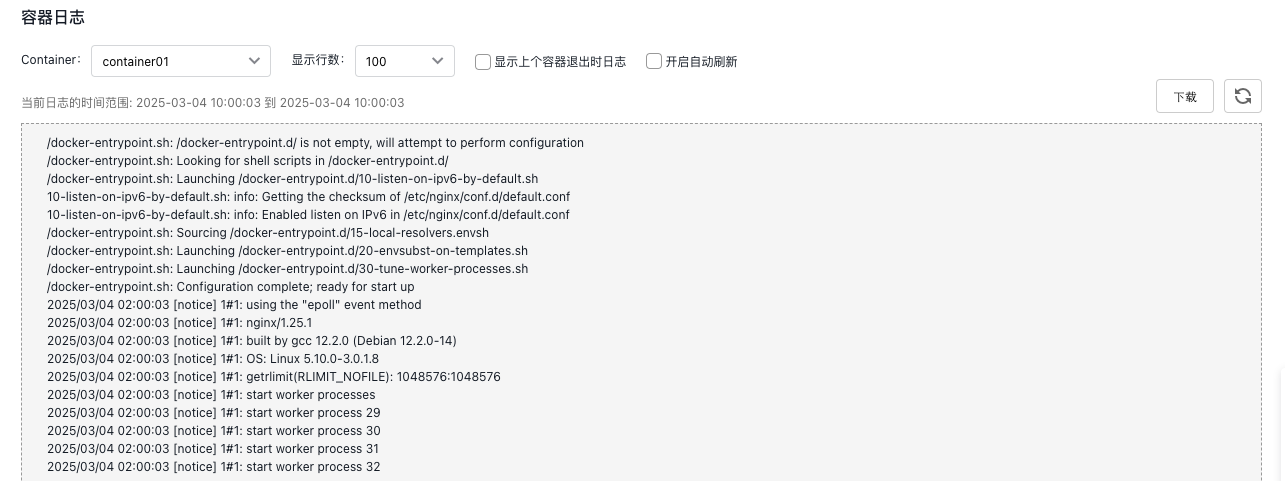
Click Logs in the left navigation bar to enter the Pod Log page and view Pod details.
-
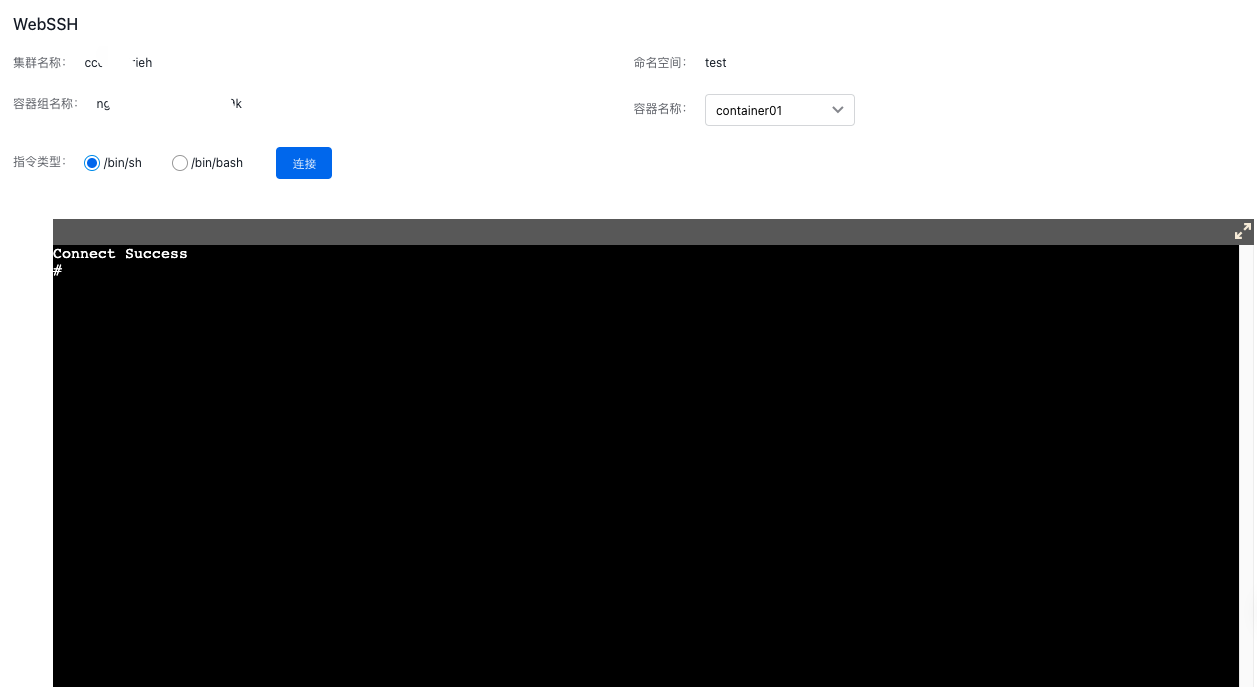
Click WebSSH in the left navigation bar to sign in to the container and perform operations.
-
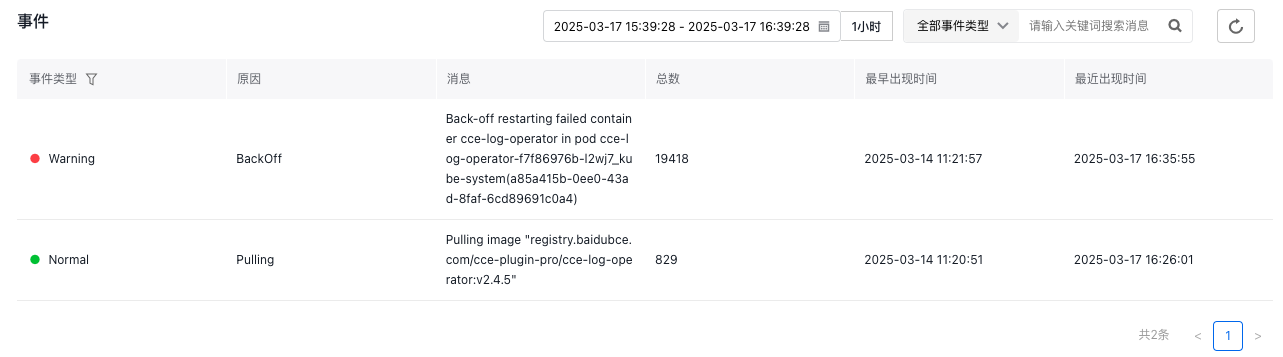
Click Event in the left navigation bar to enter the Pod Event page and view Pod event details.
Pod fault diagnosis
On the Pod List page, you can click Diagnose in the operation column on the right side of the target Pod to diagnose faults for that Pod. For more information, please refer to Fault Diagnosis.