Statistics and monitoring
Overview
BOS statistical analysis primarily uses data from each bucket. It monitors and analyzes resource usage, API statistics, and hotspot information from various dimensions, presenting the results as graphs or reports. These statistical analysis reports help users understand resource utilization and business characteristics, aiding in business analysis.
Statistical analysis is divided into four modules, allowing you to view information on resource usage, API statistics, hotspot information, and intelligent tiering dimensions. For details about metrics, refer to Metrics Overview.
Resource usage analysis
- Sign in to the BOS Management Console and navigate to the Global Overview page.
- In the left navigation bar of the BOS console, select the target Bucket, then click to open the bucket’s file list page.
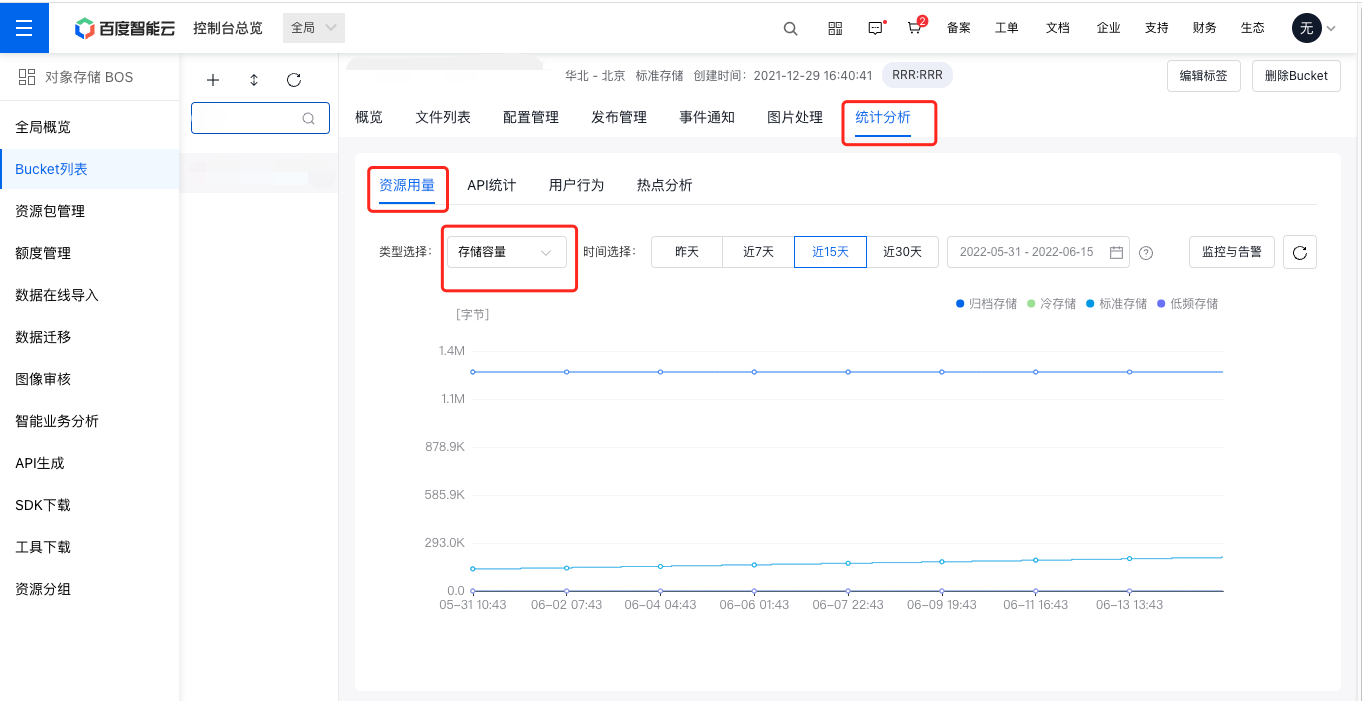
- Click the Statistical Analysis - Resource Usage tab in the top navigation bar to enter the Resource Usage Analysis page.
-
On this page, you can view statistical data on the resource usage of buckets, including Storage Capacity, Bandwidth Used, Traffic Used, Request Count, and Data Restore Volume for different time periods and at different time granularities.
Plain Text1- **Storage Capacity**: Displays capacity data for four storage classes: standard storage, infrequent access storage, cold storage, and archive storage; 2- **Bandwidth Used**: Displays total Internet read data per second, total Internet write data per second, total Intranet read data per second, and total Intranet write data per second (unit: bit/s); 3- **Traffic Used**: Displays data on Internet read volume, back-to-origin traffic, and cross-region replication traffic (unit: Byte); 4- **Request Count**: Displays read and write request counts separately for standard storage, infrequent access storage, cold storage, and archive storage. It also allows viewing of total delete requests per second, total read requests per second, total write requests per second, total error requests, and data restore requests. 5- **Data Restore Volume**: Displays traffic data for data restore from infrequent access storage, cold storage, and archive storage.Description: Currently, hotspot analysis is only supported for buckets in the North China (Beijing), East China (Suzhou), and South China (Guangzhou) regions.
API statistics
- Sign in to the BOS Management Console and navigate to the Global Overview page.
- In the left navigation bar of the BOS console, select the target Bucket, then click to open the bucket’s file list page.
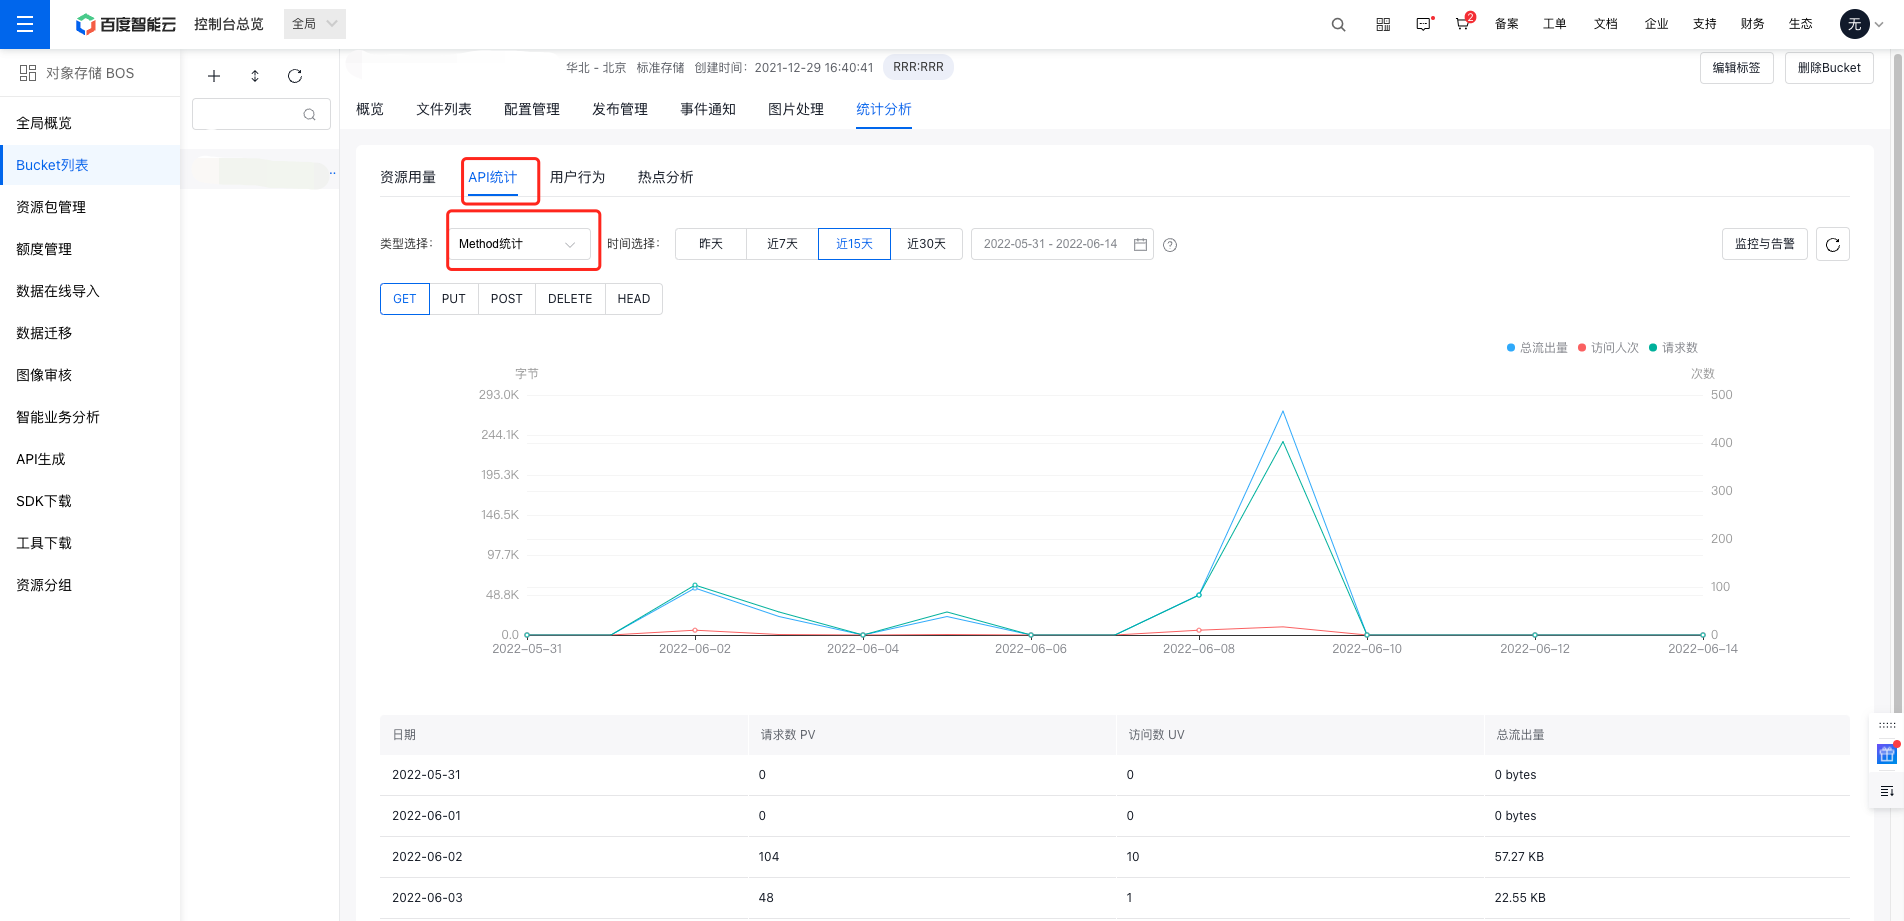
- Click the Statistical Analysis - API Statistics tab in the top navigation bar to enter the API Statistical Analysis page.
- Based on the selected bucket, you can generate statistics on HTTP access behaviors and system-returned HTTP status codes (HTTP Codes) within a specified time frame.
- Method Statistics covers access requests such as GET, PUT, POST, DELETE, and HEAD. The access analysis chart displays the total requests (PV), unique visitors (UV), and total outgoing data volume for each type of request mentioned above.
1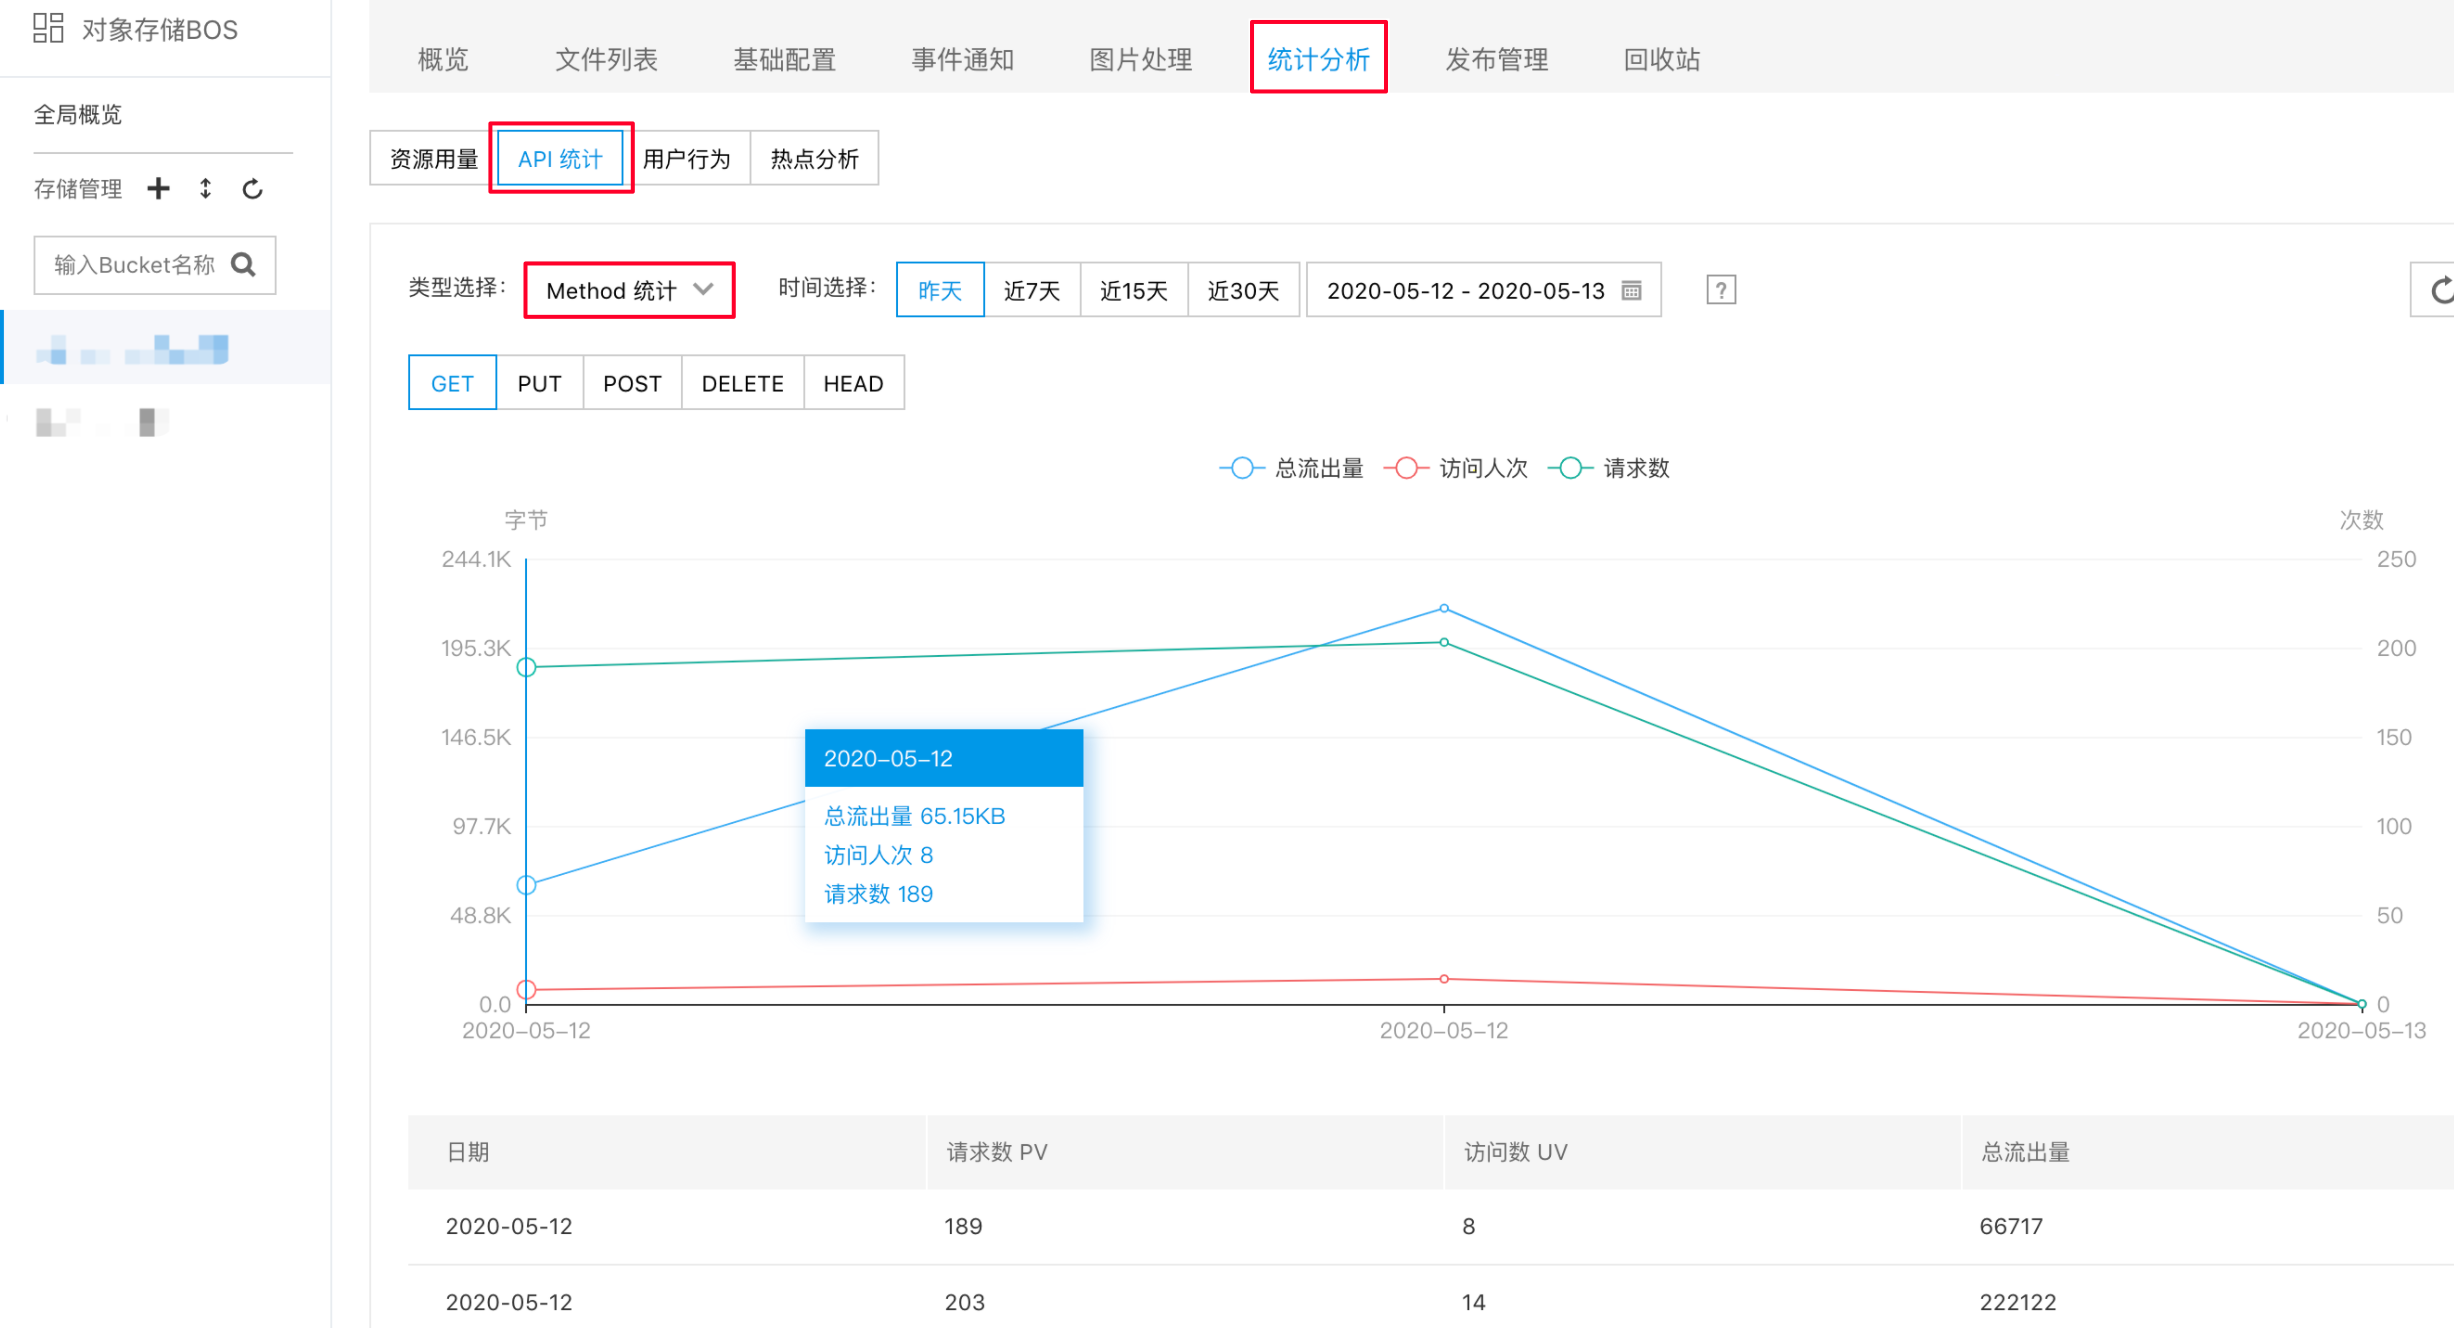- The access analysis chart also presents system-returned HTTP Codes, including statistics for 2XX, 3XX, 4XX, and 5XX series codes (e.g., 200, 300, 403, 408, 503).
Hotspot analysis
Hotspot analysis view
- Sign in to the BOS Management Console and navigate to the Global Overview page.
- In the left navigation bar of the BOS console, select the target Bucket, then click to open the bucket’s file list page.
- Click the Statistical Analysis - Hotspot Analysis tab in the top navigation bar to enter the hotspot analysis page.
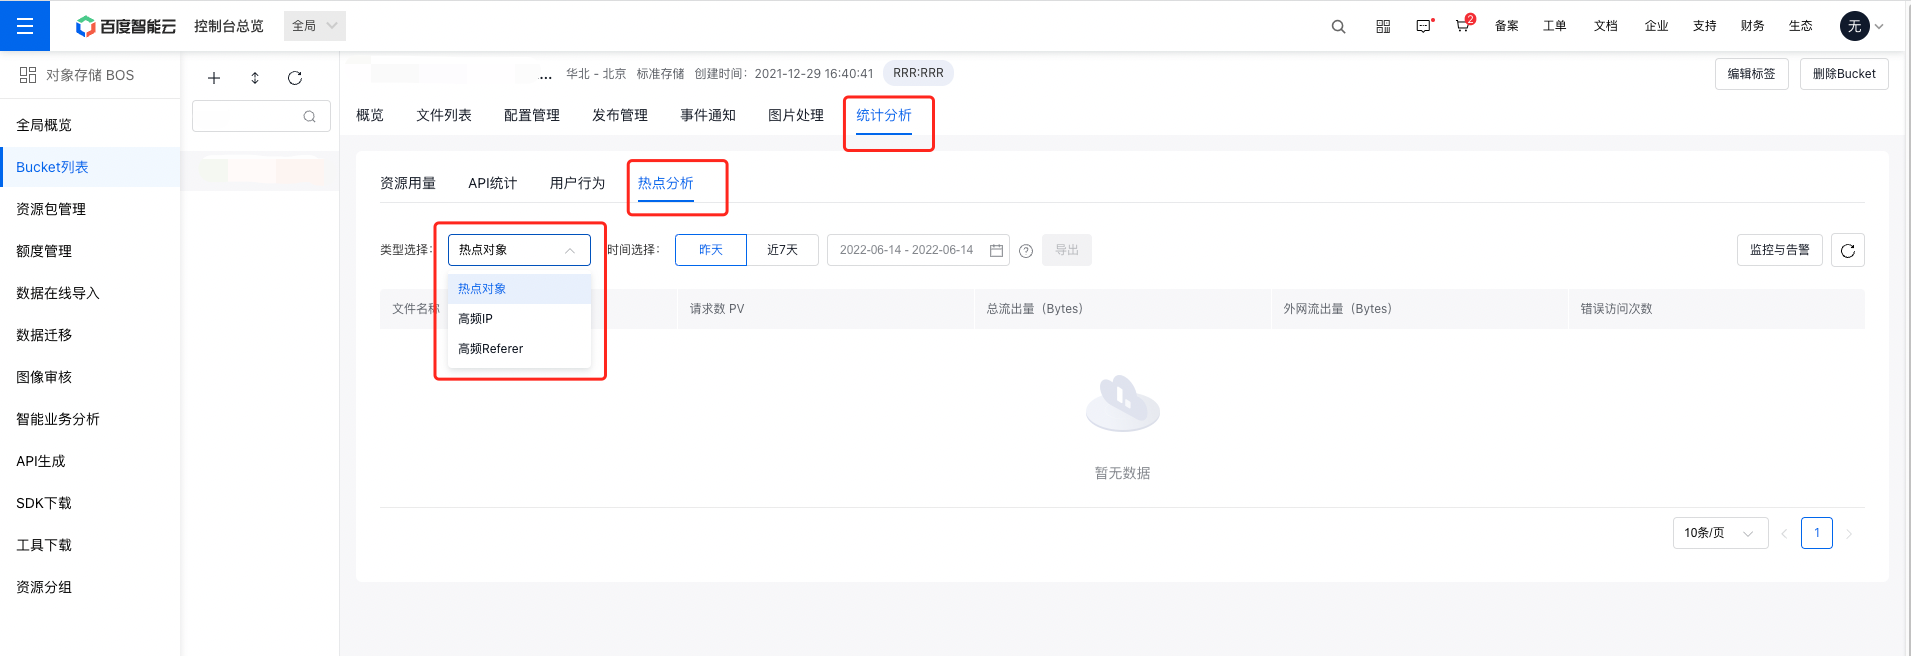
- You can statistics and sort Hotspot Objects and High-Frequency IPs based on dimensions such as “request count”, “total outgoing volume”, and “error access”, making it easy to quickly locate hotspot information.
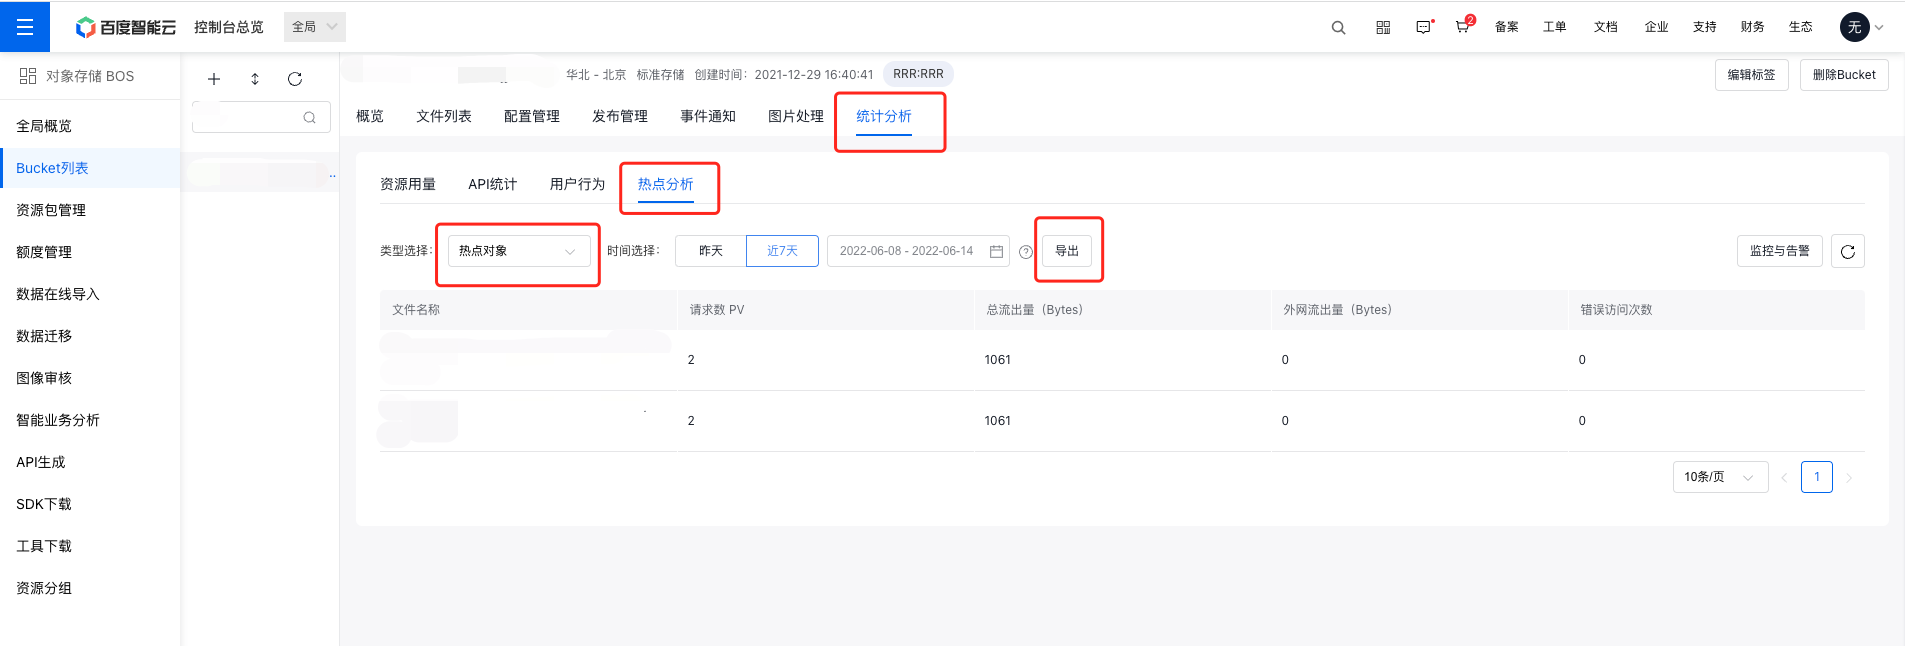
Export of hotspot analysis data
Statistical data for Hotspot Objects and High-Frequency IPs supports online export for further analysis.
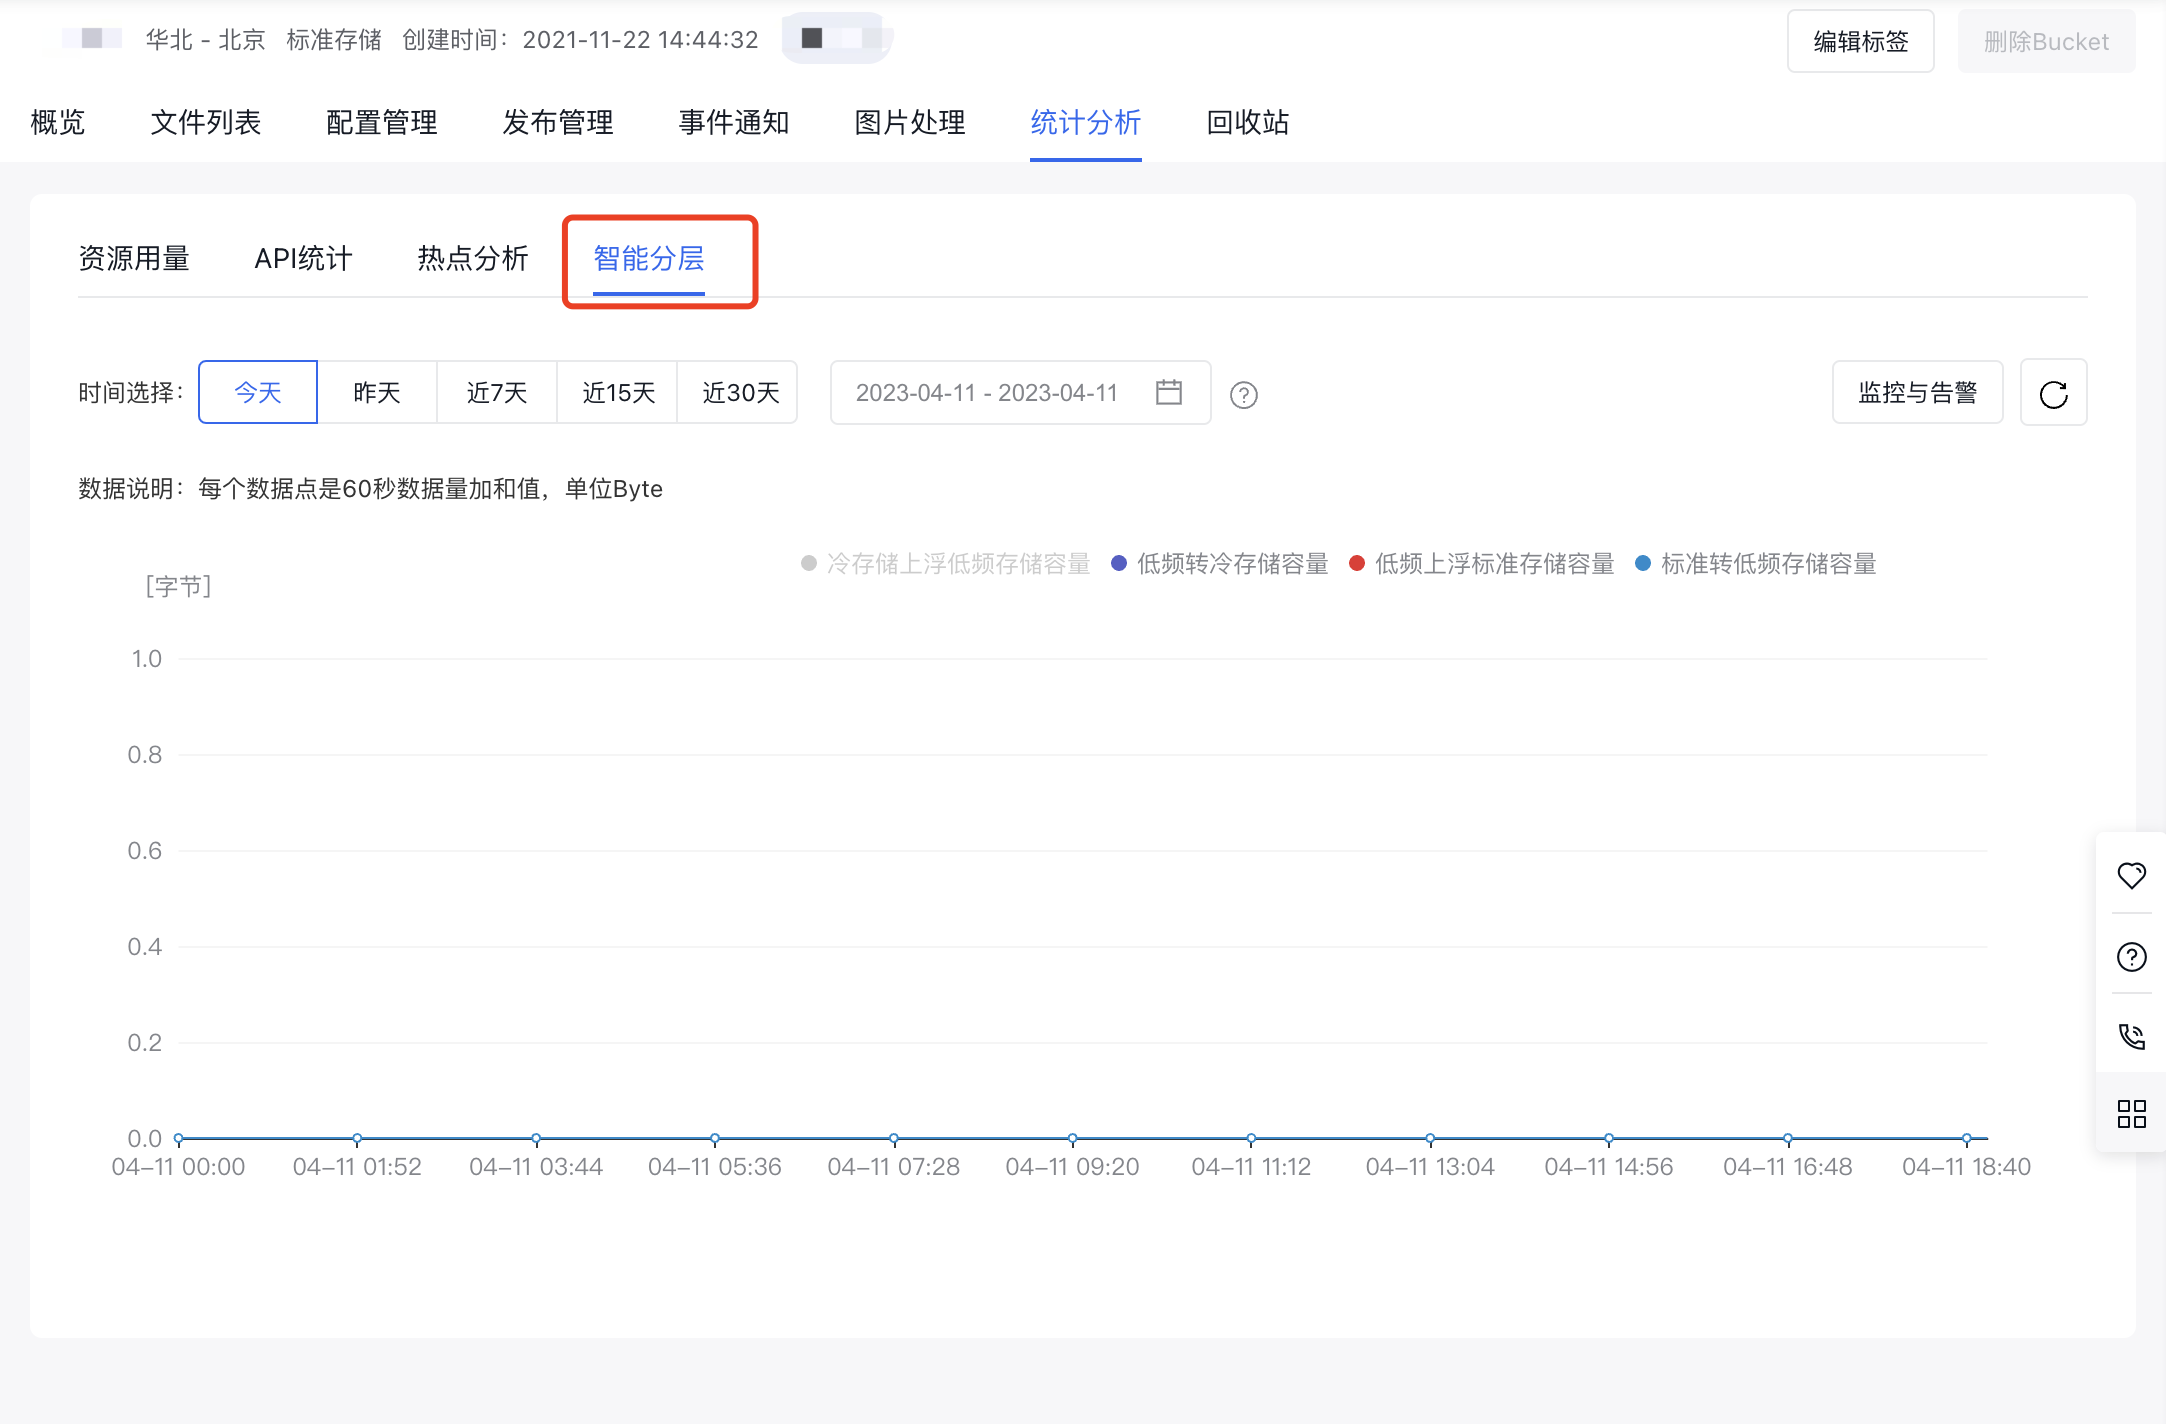
Intelligent tiering
Once bucket intelligent tiering is enabled, you can view the adjusted storage capacity for any specified date through the intelligent tiering statistical data.
- Sign in to the BOS Management Console and navigate to the Global Overview page.
- In the left navigation bar of the BOS console, select the target Bucket, then click to open the bucket’s file list page.
- Click the Statistical Analysis - Intelligent Tiering tab in the top navigation bar.