
Slow Query Alarm Handling Method
Background
The database performance directly influences the system execution efficiency, and stability. If there is a performance problem, it not only jeopardizes the company's reputation but likely brings about the company's loss in capital. Slow SQL is one of the important aspects influencing the database performance. As for massive data, inferior SQL might be more than 100 times slower than superior SQL. If you resolve the influence of slow SQL on database performance, it usually brings double results with half the work.
The database's performance problems have something to do with slow SQL in most cases. If the Slow SQL problem is severe, you might encounter the following phenomena:
- Database response turns slow, SQL execution consumes more time, and the final service request times out.
- Database read/write QPS declines
- System resource CPU is full, etc.
Handling
Find problem
Channels for finding slow query problems include:
- Configure BCM monitoring: when the slow query alarm's threshold is triggered, the system sends alarm information automatically.
- View the RDS monitoring trend chart and observe the slow query curve. See the figure below:
- The response to the service's database access slows down, which might be attributable to a slow query.
Locate problem
-
Step 1: check if there is expected SQL in long-running.
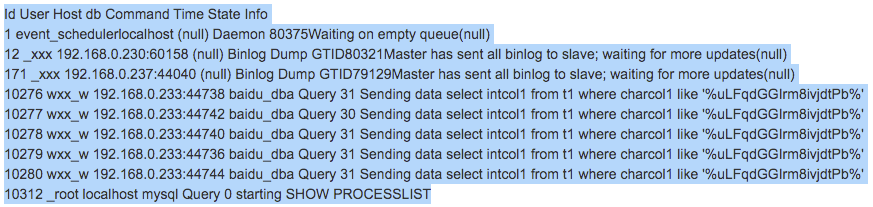
Log in and view the database command:
mysql -h: instance ip -P port -u user -p: password, -e " SHOW PROCESSLIST;" grep -ivw sleep
For example, the following results are shown:
-
Step 2: Analysis
From current "processlist" display results, we can see six long-running slow SQLs, leading to slow query alarm.
Resolve problem
First, confirm if these slow queries can end. If yes, log in to RDS to execute "KILL" command: KILL threadID; # for example, kill 10276 ; ergodic kill to six session IDs.
At this moment, the client receives the following error information, which meets the expectation: ERROR 2006 (HY000): MySQL server has gone away.
As above-mentioned, observe the monitoring trend chart. The number of slow queries decreases to zero little by little.
Subsequent handling
- Direct kill to online slow queries is only an urgent solution to the emerging problems online.
- In case of slow SQL in stock, recommend you to optimize related SQLs as soon as possible (for example, adding an index and optimizing SQL access mode.)
- In the case of new slow SQL, to avoid influence on existing services, you are advised to remove the service offline and launch it online after the optimization.