Performance Diagnosis
Last Updated:2021-11-09
Overview
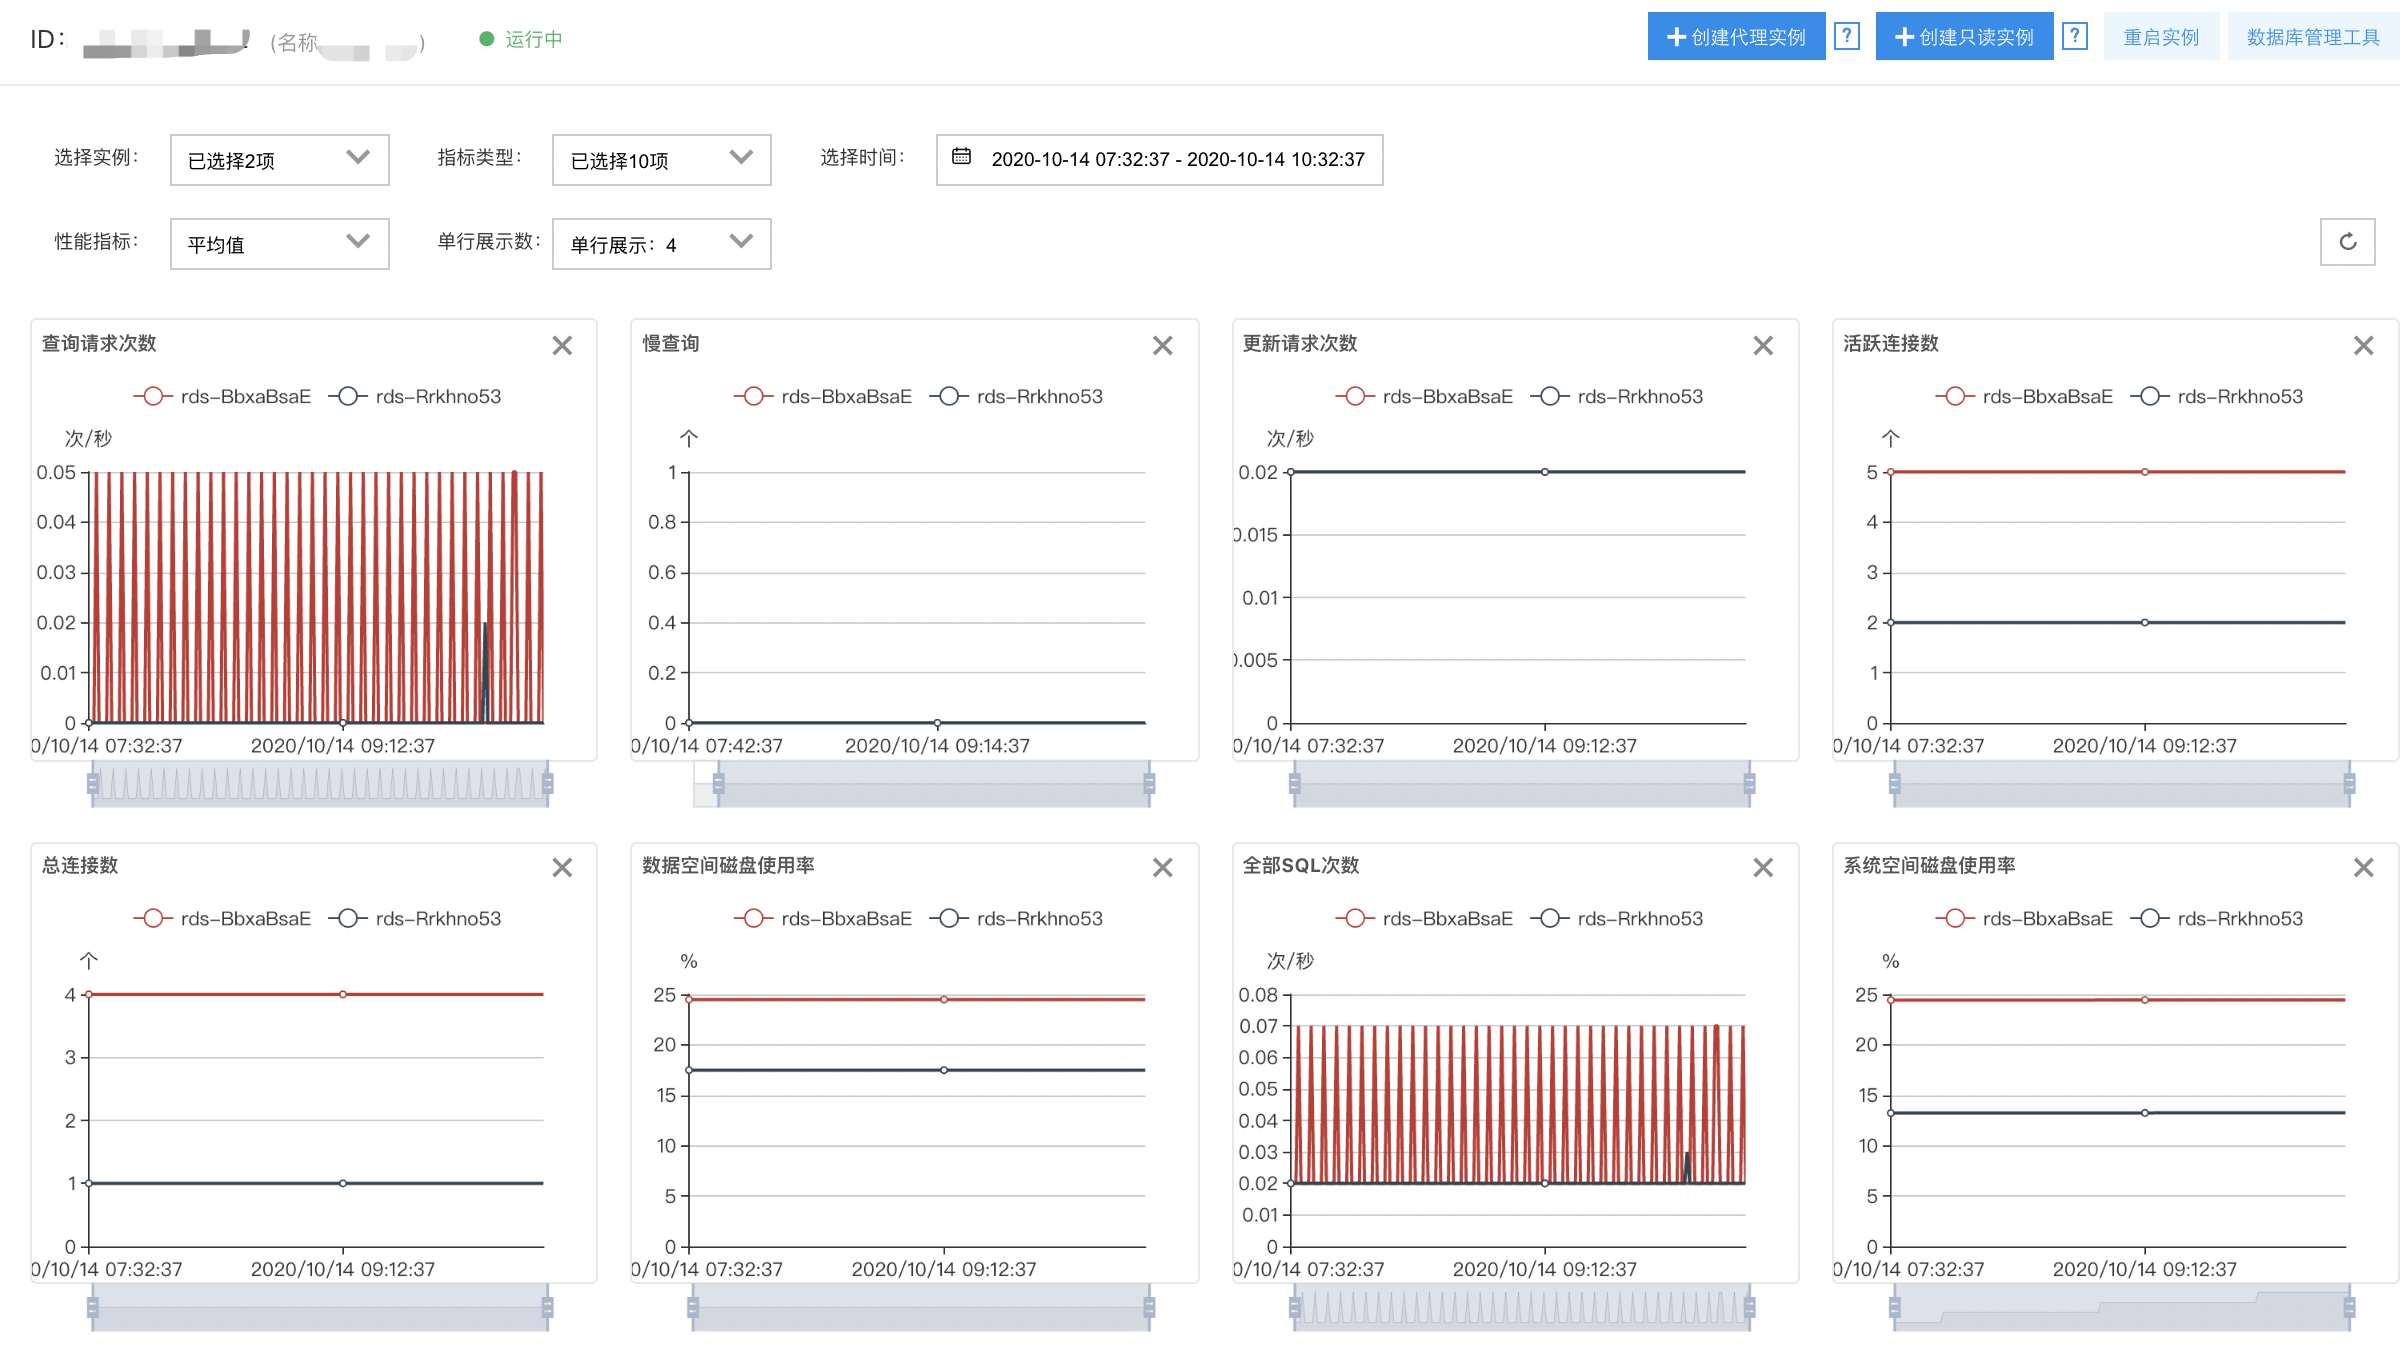
The performance diagnosis is a summary chart for various performance trends of an instance provided by the platform, which allows you to intuitively understand the details and trends of relevant metrics in the designated direct segment and quickly locate problems. Currently, it supports 16 performance metrics and shows up to 10 metrics at one time.
Instruction for Use
- You can only view the performance metrics of all instances in the current region. If the cluster instances are distributed in multiple regions, you cannot view the instance information in other regions.
- You can select up to 10 performance metrics at one time.
Introduction of Metrics
The details are as follows:
| Metrics | Description of Metrics | Monitoring Frequency | Monitoring Period |
|---|---|---|---|
| Slow log | Number of user’s slow queries | 60 s/time | 40 days |
| Number of active connections | Show the number of non-sleep sessions in the processlist | 60 s/time | 40 days |
| Total number of connections | Number of client connections and active threads | 60 s/time | 40 days |
| Total number of query SQLs | Update + Total number of SQL requests queried | 60 s/time | 40 days |
| Number of update requests | Number of update type requests | 60 s/time | 40 days |
| Number of query requests | Number of query type requests | 60 s/time | 40 days |
| Delay of master and slave instances | Delay time of master and slave instances expressed in second | 60 s/time | 40 days |
| Maximum transaction execution time | Maximum SQL transaction execution time | 60 s/time | 40 days |
| CPU utilization | CPU utilization of the instance | 60 s/time | 40 days |
| Memory utilization | Percentage of the actual memory usage to the total memory | 60 s/time | 40 days |
| Disk usage rate of data space | Disk space used by user’s data/disk where the user applies for a package | 60 s/time | 40 days |
| Disk usage rate of system space | Space used by the whole system/disk where the user applies for a package | 60 s/time | 40 days |
| Network input traffic | NetworkInBytes | 60 s/time | 40 days |
| Network output traffic | NetworkOutBytes | 60 s/time | 40 days |
| Internet input traffic | WebInBytes | 60 s/time | 40 days |
| Internet output traffic | WebOutBytes | 60 s/time | 40 days |
Operation Guide
- Log in to Console of Baidu AI Cloud Database RDS.
- In the RDS console, select a MySQL dual-computer high-availability master instance and click the instance name to enter the Instance Details.
- On the "Baidu AI Cloud Database RDS Instance Details" page, click SmartDBA to show the module information.
- Click Performance Diagnosis to enter the page, select the instance, metric type, time, and other information that you want to view. Then, you can view the performance metrics of the current instance.