
SQL Diagnosis
Last Updated:2021-12-23
Overview
The SQL diagnosis includes historical slow SQL diagnosis and slow SQL real-time diagnosis, and displays the current number and trend of slow SQL in the system in the chart form. It is divided into two modules: "Slow SQL report" and "Slow SQL real-time diagnosis".
Interpretation of Terms
- Slow SQL report: allows you to analyze the historical slow SQL trend and know the optimization effects of slow SQL.
- Slow SQL real-time diagnosis: allows you to locate the existing slow SQL problems in the system quickly.
Prerequisites
If you need to use the SQL diagnosis feature, you must first pass the authorization and confirm the enabling of "Slow SQL report" and "Slow SQL real-time diagnosis" services for this instance.
Operation Guide
Slow SQL Report
- Log in to the Console of Cloud Database RDS.
- In the RDS console, select a MySQL dual-computer high-availability master instance, and click the instance name to enter the Instance Details.
- On the "Baidu AI Cloud Database RDS Instance Details" page, click SmartDBA to show the module information.
- Click SQL Diagnosis to enter the "Slow SQL Report" page by default. Now, you can view the relevant information directly on the page.
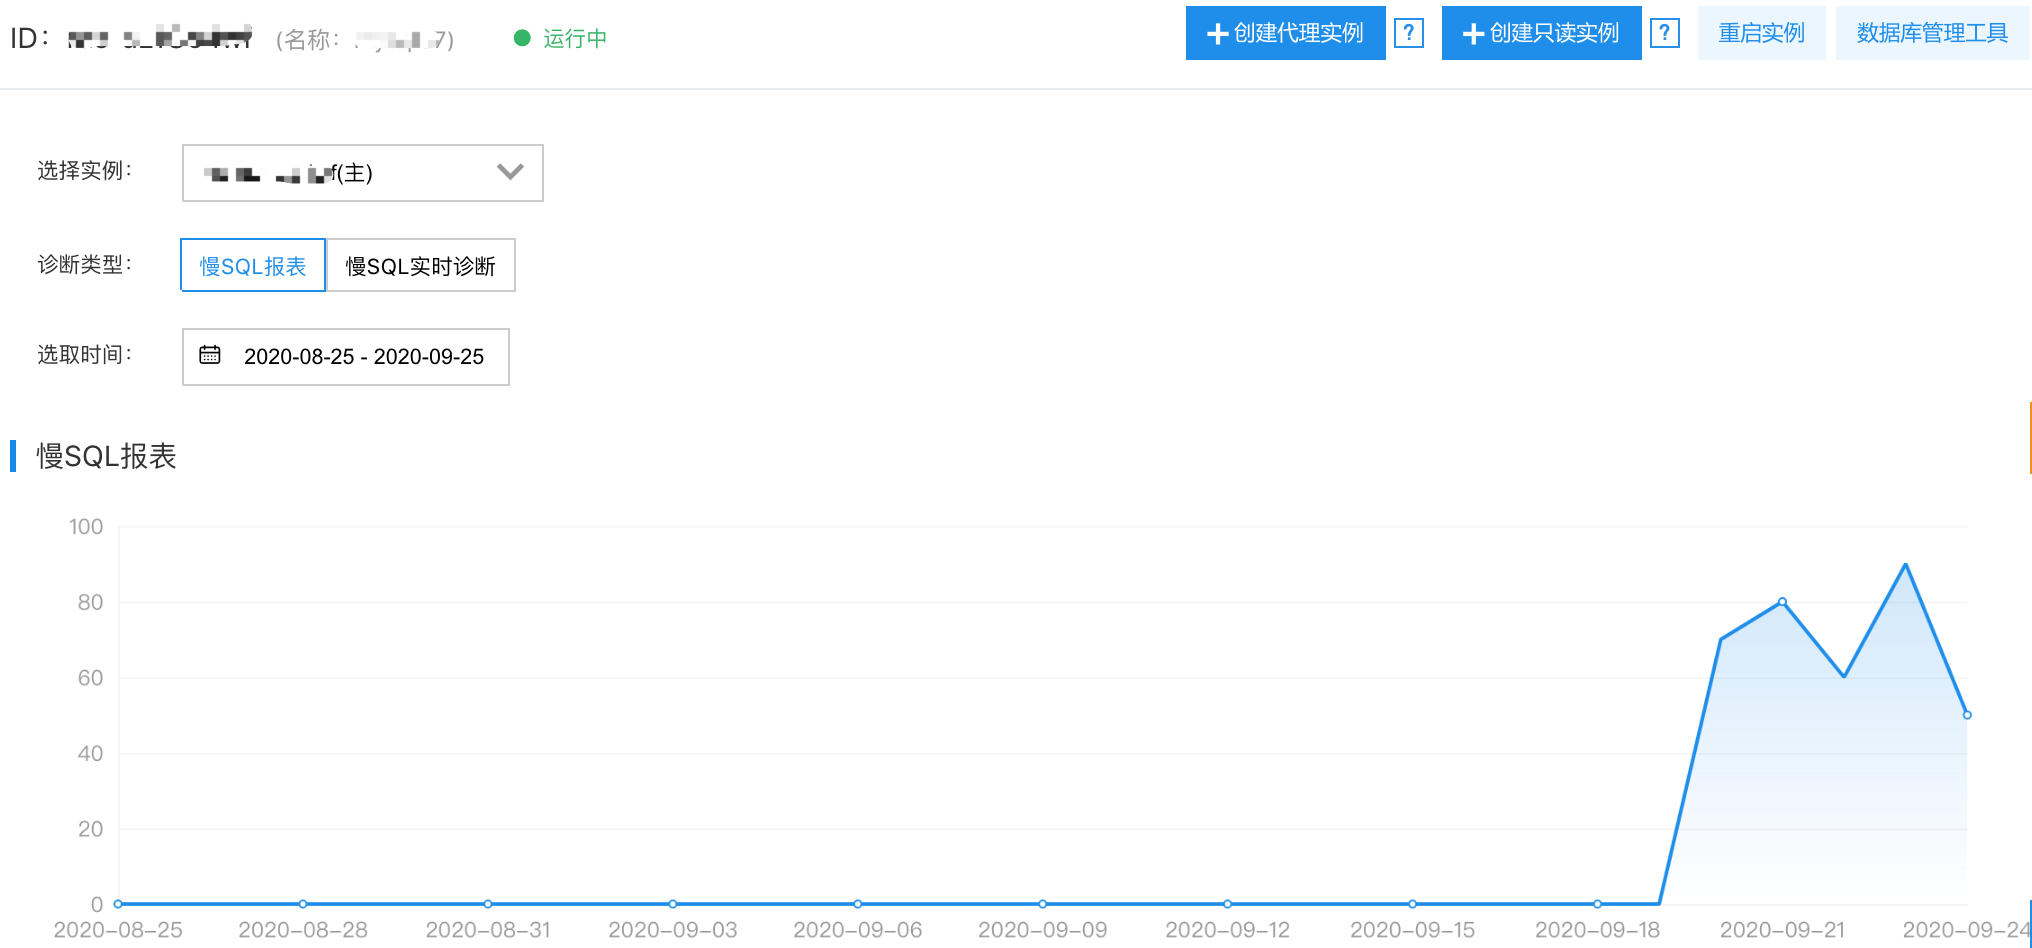
- Click a dot in the trend chart to view the statistics information of the slow SQL below the trend chart. The slow SQL is signed here.

- For more contents, see the Operation Guide for Slow SQL Report
Slow SQL real-time diagnosis>
- Log in to the Console of Cloud Database RDS.
- In the RDS console, select a MySQL dual-computer high-availability master instance, and click the instance name to enter the Instance details.
- On the "Baidu AI Cloud Database RDS Instance Details" page, click SmartDBA to show the module information.
- Click SQL Diagnosis, and select Slow SQL Real-time Diagnosis in "Diagnosis Type" to view related information. The following figure shows the real-time slow SQL trend chart of the database. The green line represents the CPU utilization curve, and the blue represents the slow SQL histogram.
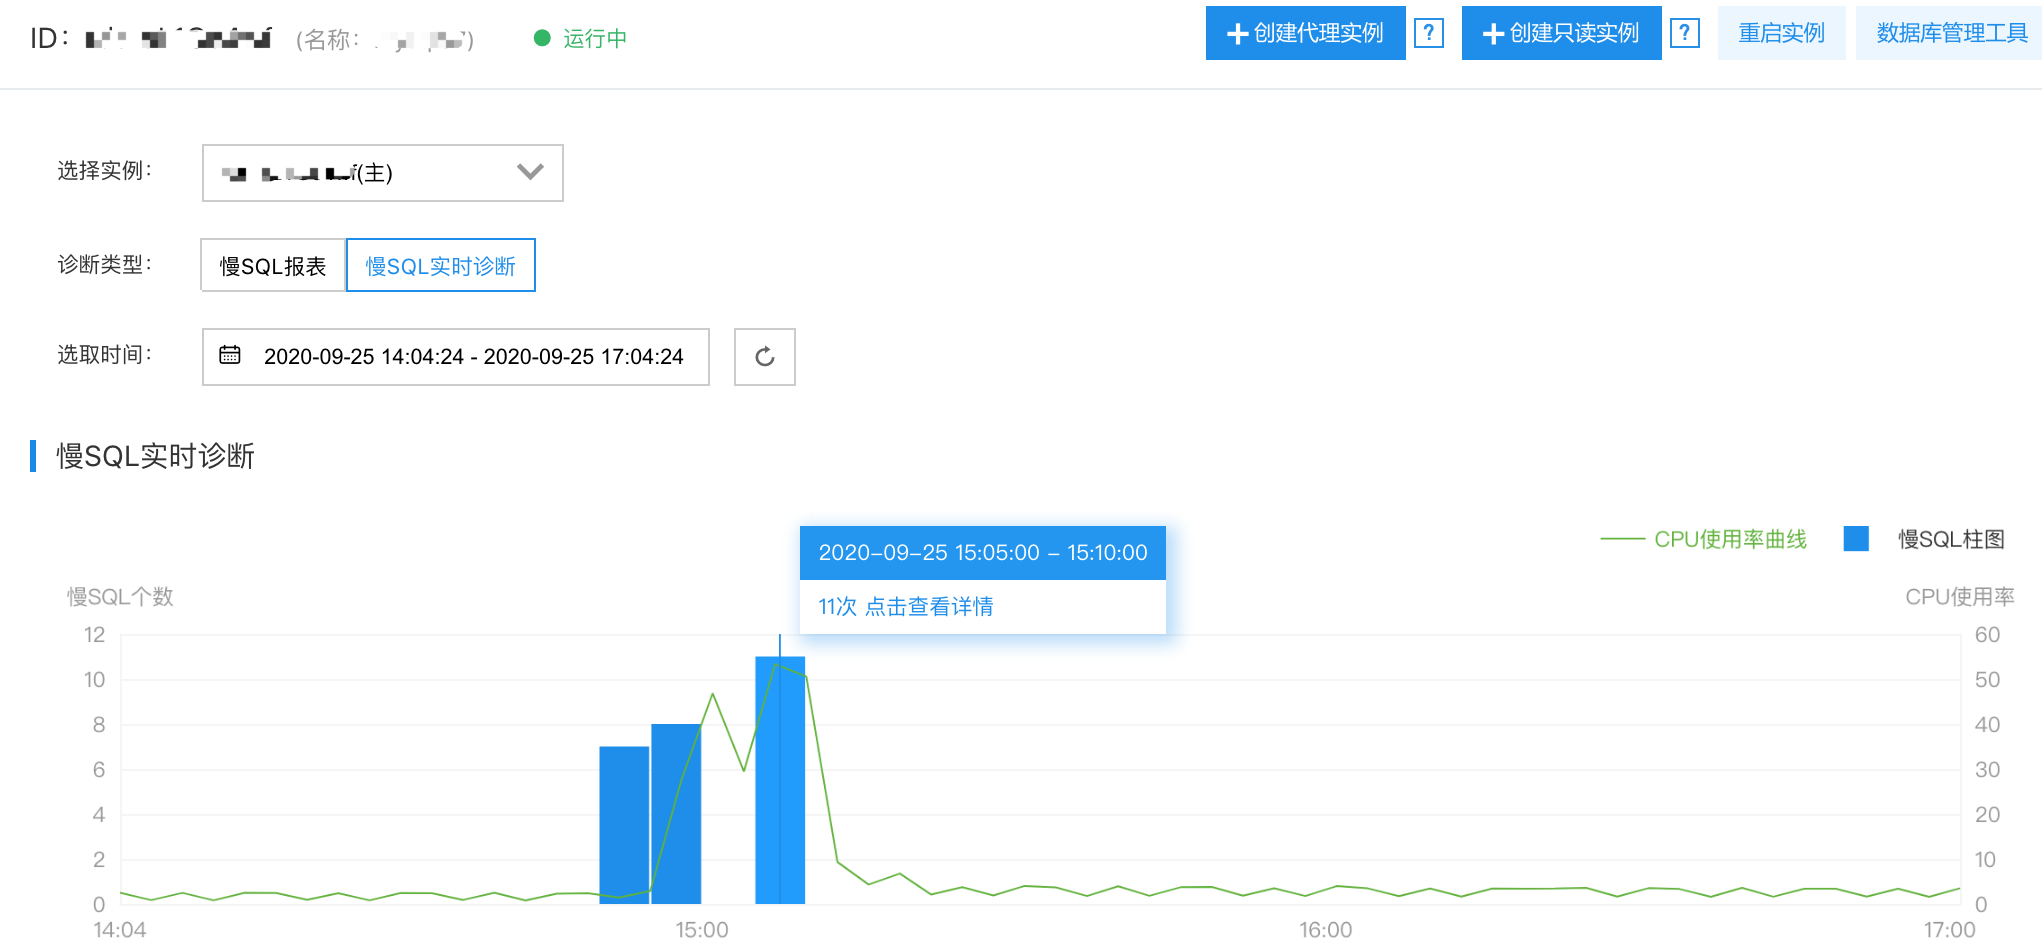
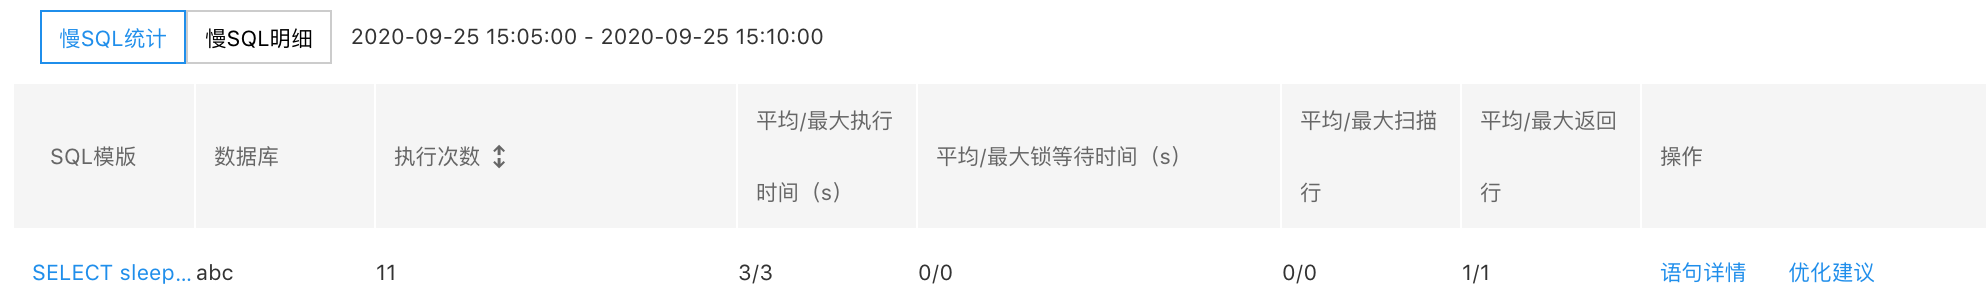
- Select any slow SQL histogram and click it to view details. The Details includes two parts: "Slow SQL Statistics" and "Slow SQL Breakdown". Also, "Optimization recommendations" are given in the last column of the table. Thus, you can optimize SQL by making reference to the recommendations.
- For more contents, see the Operation Guide for Slow SQL Real-time Diagnosis.