
Flow log
Baidu AI Cloud flow logs capture network flow details for instances such as EIP, NAT gateway, IPv6 gateway, peering connections, dedicated gateway, SSL VPN gateway, and Cloud Smart Network, enabling traffic analysis, visualization, fault diagnosis and troubleshooting, and architecture optimization. Core fields include five-tuple, statistical information, timestamp, and traffic operations (whether governed by access control or not), among others.
Application scenarios:
- Fault Diagnosis: Flow logs retain the context of faults to assist in quickly diagnosing network issues and resolving root causes, such as identifying if the inaccessibility of a Baidu Cloud Compute instance is due to incorrect security group settings or ACL configurations.
- Architecture Optimization: Flow logs collect network interface card traffic data to enhance data-driven network operations, enabling strategic optimization of network architecture. For example, they can analyze historical network data to establish benchmarks, quickly spot performance bottlenecks for proper capacity expansion or load reduction, analyze user access regions to expand business coverage strategically, and review network traffic to refine security policies.
- Threat Alert: Introducing traditional traffic checkpoints may impact cloud host performance. Flow logs can identify network security threats without affecting performance. For example, they can detect attempts to connect to large IP ranges, communications with known malicious IPs, or the use of uncommon protocols, thereby strengthening system security.
Before Configuration, you should know:
- A maximum of 10 flow logs can be created per region.
- Flow logs can only be associated with LogStores within the same region and cannot be linked across regions.
Create flow log
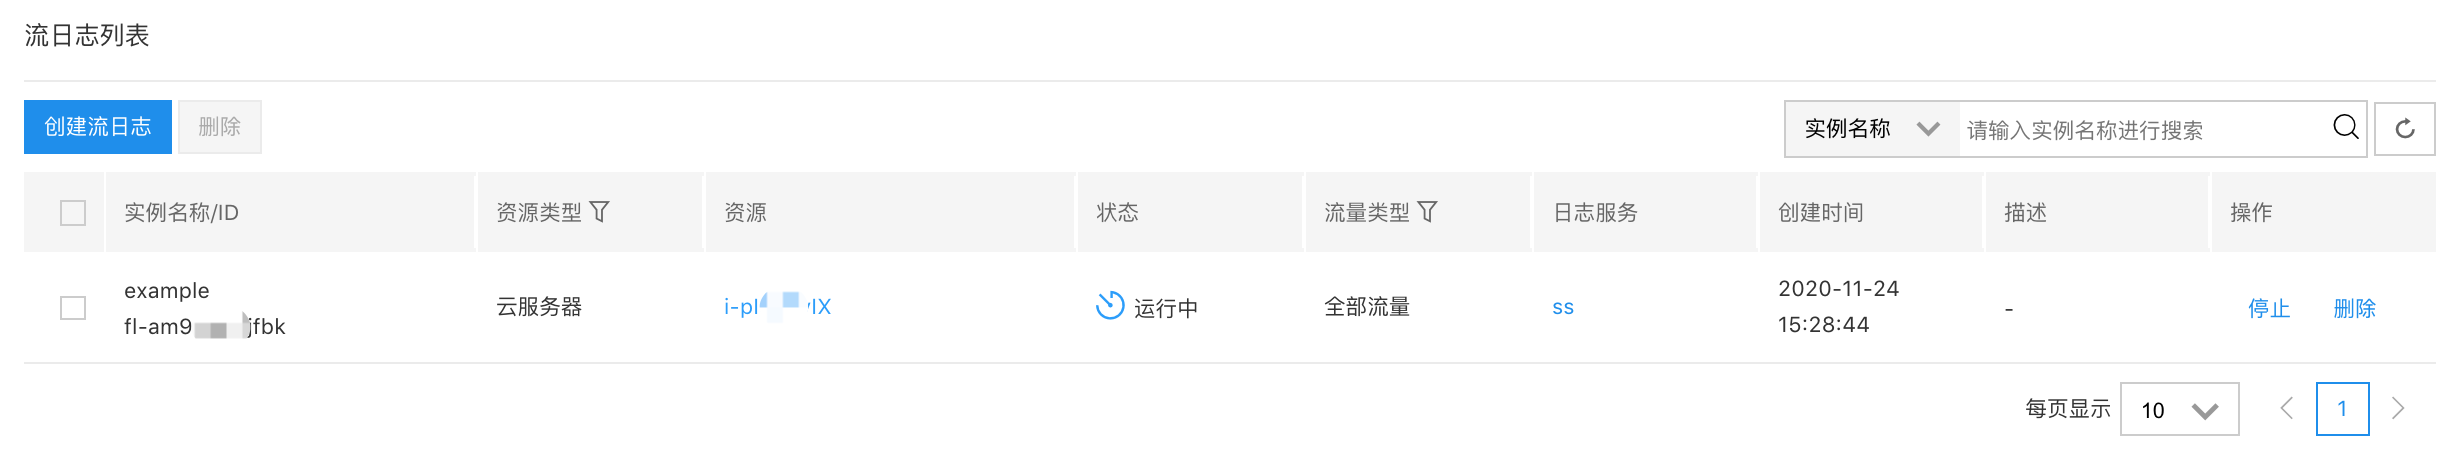
- On the Network Diagnostic Service (NDS) console, click on Flow Logs in the left navigation menu to access the Flow Logs List page.
- Click the Create Flow Log button.
- Fill in the following configuration information:
| ConfigMap | Description |
|---|---|
| Current region | Switch via the region selector in the upper-left corner |
| Name | User-defined flow log name |
| Resource type | Select the resource type for which to capture traffic, then select the corresponding resource |
| Network where the resource is located | Select the network where the resource is located |
| Traffic type | Select the type of traffic to capture: All traffic: Capture all traffic of the specified resource. Allow: Capture traffic allowed by security groups or ACL rules for the specified resource. Deny: Capture traffic denied by security groups or ACL rules for the specified resource |
| Destination type | Select destination type |
| Destination | Select the LogStore for storing captured traffic: Select existing LogStore: Select a LogStore for storing captured traffic from existing projects Create new LogStore: Create a new LogStore for storing captured traffic |
| Description | Enter a description for the flow log (up to 200 characters) |
Description:
- Flow logs themselves incur no fees. Data stored in the logging service will be charged according to the standard pricing of the logging service.
- Click "OK" to finalize the creation of the flow log.
Create LogStore
You need to create a LogStore in log service to store and view flow logs. For details, refer to [LogStore Operation Guide](BLS/Operation guide/LogStore/LogStore.md).
Delete flow log
- On the Network Diagnostic Service (NDS) console, click on Flow Logs in the left navigation menu to access the Flow Logs List page.
- Choose the flow log you wish to delete and click "Delete" to confirm the action.
Description:
- Deleting a flow log does not remove the associated LogStore.
View flow log records
Users can view flow logs in log service to quickly locate service issues. Users can select multiple log topics within the same log set for cross-topic queries. For specific operations, refer to Log Query.