
Monitoring and Alarm
Last Updated:2021-05-12
When you expect to view the monitoring information of the instance of the cloud database DocDB for MongoDB, click "Monitoring" on the left of the detail page of the instance to enter.
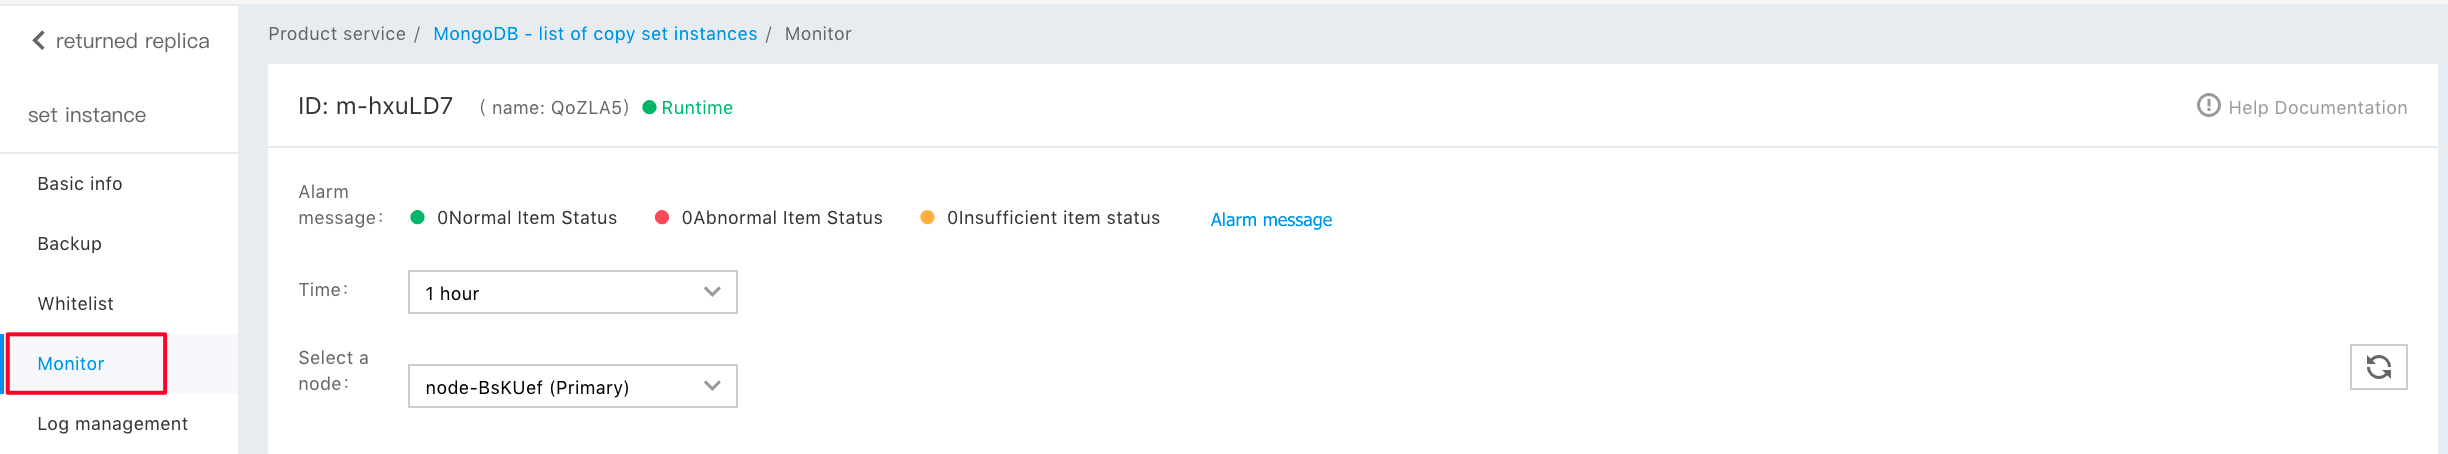
In the monitor information page, the last 1 hour of monitor information for this instance is displayed by default. You can also switch the time dimension to see the instance in operation.
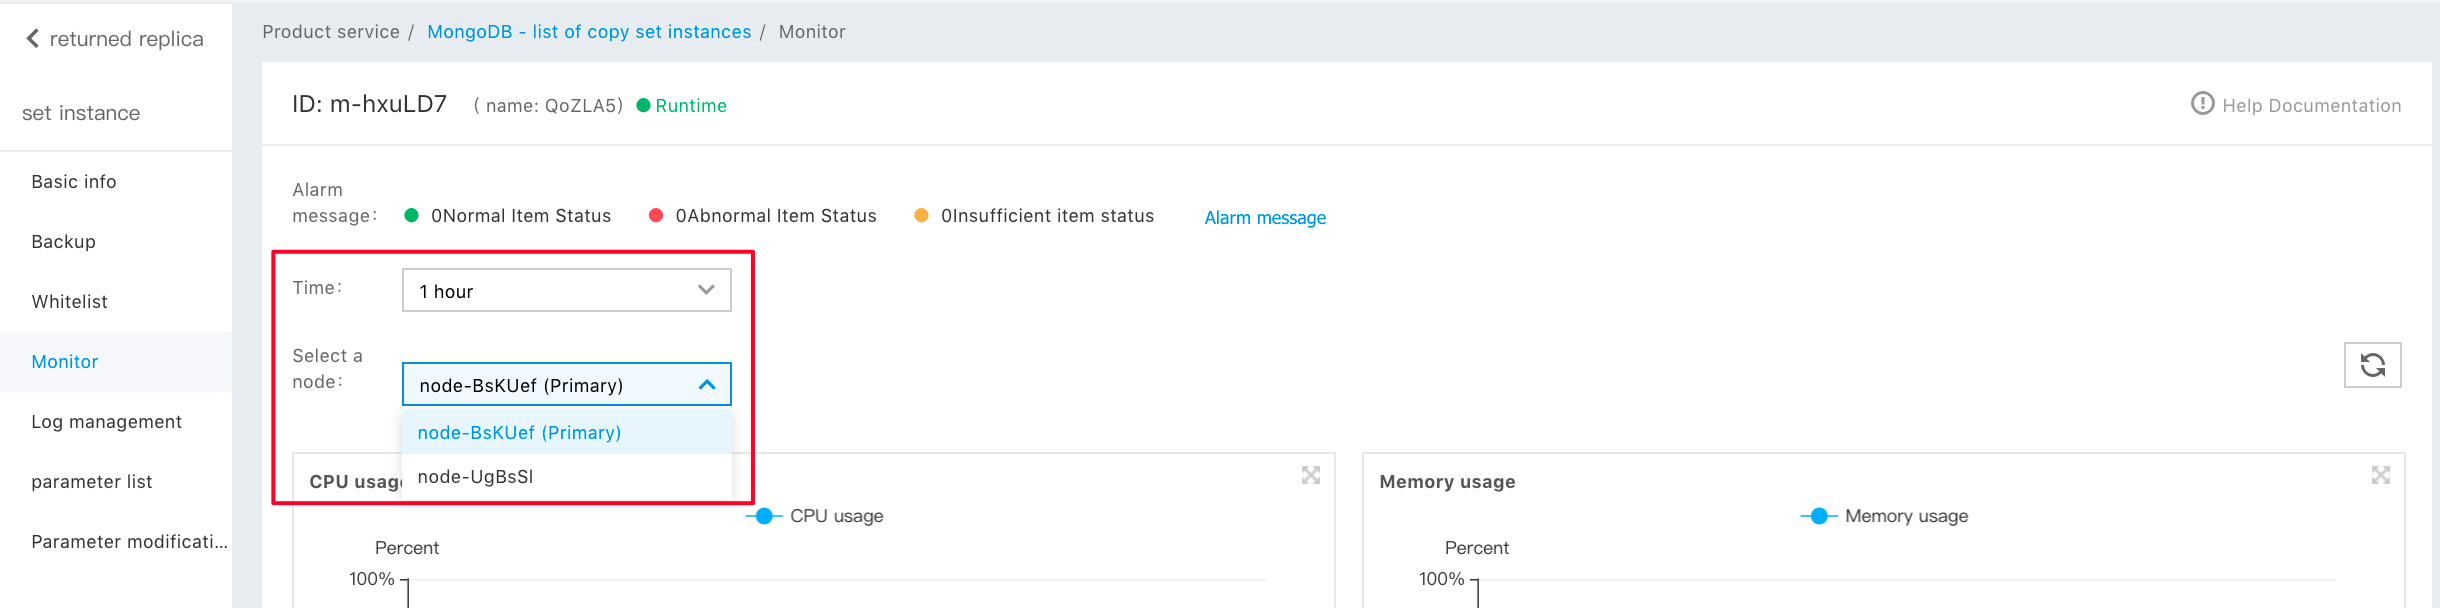
Meanwhile, the Primary node and Secondary node of the Baidu AI Cloud database DocDB for MongoDB instance respectively conduct detailed data statistics. You can check the monitoring information of the two nodes by switching.
Baidu AI Cloud database DocDB for MongoDB provides the following monitoring items:
| Monitoring items | Instruction |
|---|---|
| CPU Usage | CPU usage of instances |
| Memory utilization | Memory utilization of instance |
| The number of disk IOPS | The number of disk IOPS storied in this instance |
| Disk space storage capacity used size | Data storage of disk storied in this instance |
| Disk space storage capacity usage | The ratio of the current amount of data in this instance to the maximum amount of storage purchased |
| The number in operation | QPS operants of instances include: insert operand query operand delete operand update operand getmore operand command operand |
| Linking number of instances | The number of clients connected to the instance |
| Traffic | Entry traffic: Traffic generated by the upload in this instance Exit traffic: traffic generated by the download in this instance |