Data Visualization-Sugar
- Features
- Advantages
- Dashboard Demos
- Report Demos
- Pricing
Features
Multiple Data Source Connections
Supporting to directly connect many common-used data sources, such as Mysql, SQL Server, PostgreSQL, Greenplum, Oracle, SAP Hana, Hive, Spark, Presto, etc.
Diverse Visualization Widgets
Providing over 65 professional visualization charts based on Apache Echarts and more than 10 filtering widgets, also user-defined figure, fully satisfying your diversified visual requirements.
User-friendly Interface
With Sugar's visual interface and wedgit configuration options, users can create visualization with dragging, dropping and clicking. No programming is required.
Impressive and Professional Dashboards
By making use of large range of dashboard templates in Sugar, customers can complete their own visualization with least customization in many scenarios.
Data Analysis
With Sugar, enterprise can realize business intelligence in the easiest way, utilizing the value of their own large amount of data. Every personnel becomes data analyst, and begins to make decisions based on data.
Access Control
Providing enterprise level management, such as data isolation between spaces and the-role-and-user-based authorization. Sugar has various mechanisms to ensure your data security.
Advantages
Combining Business Intelligence and Visualization
It integrates BI report and dashboard functions, meeting customers' visualization needs in different scenarios.
Automatically Adapted to Mobile and Pad
It automatically adapts to the mobile interface, so you can view and analyze the visual data anytime and anywhere.
Open, Flexible and Secure
Supporting to sharing reports and dashboards by urls(w or w/o password) or emails, also can easily be embedded into third-party systems.
Supporting SaaS Service and Private Deployment
Customers can choose to use SaaS Sugar or deploy Sugar on their own servers.
Dashboard Demos
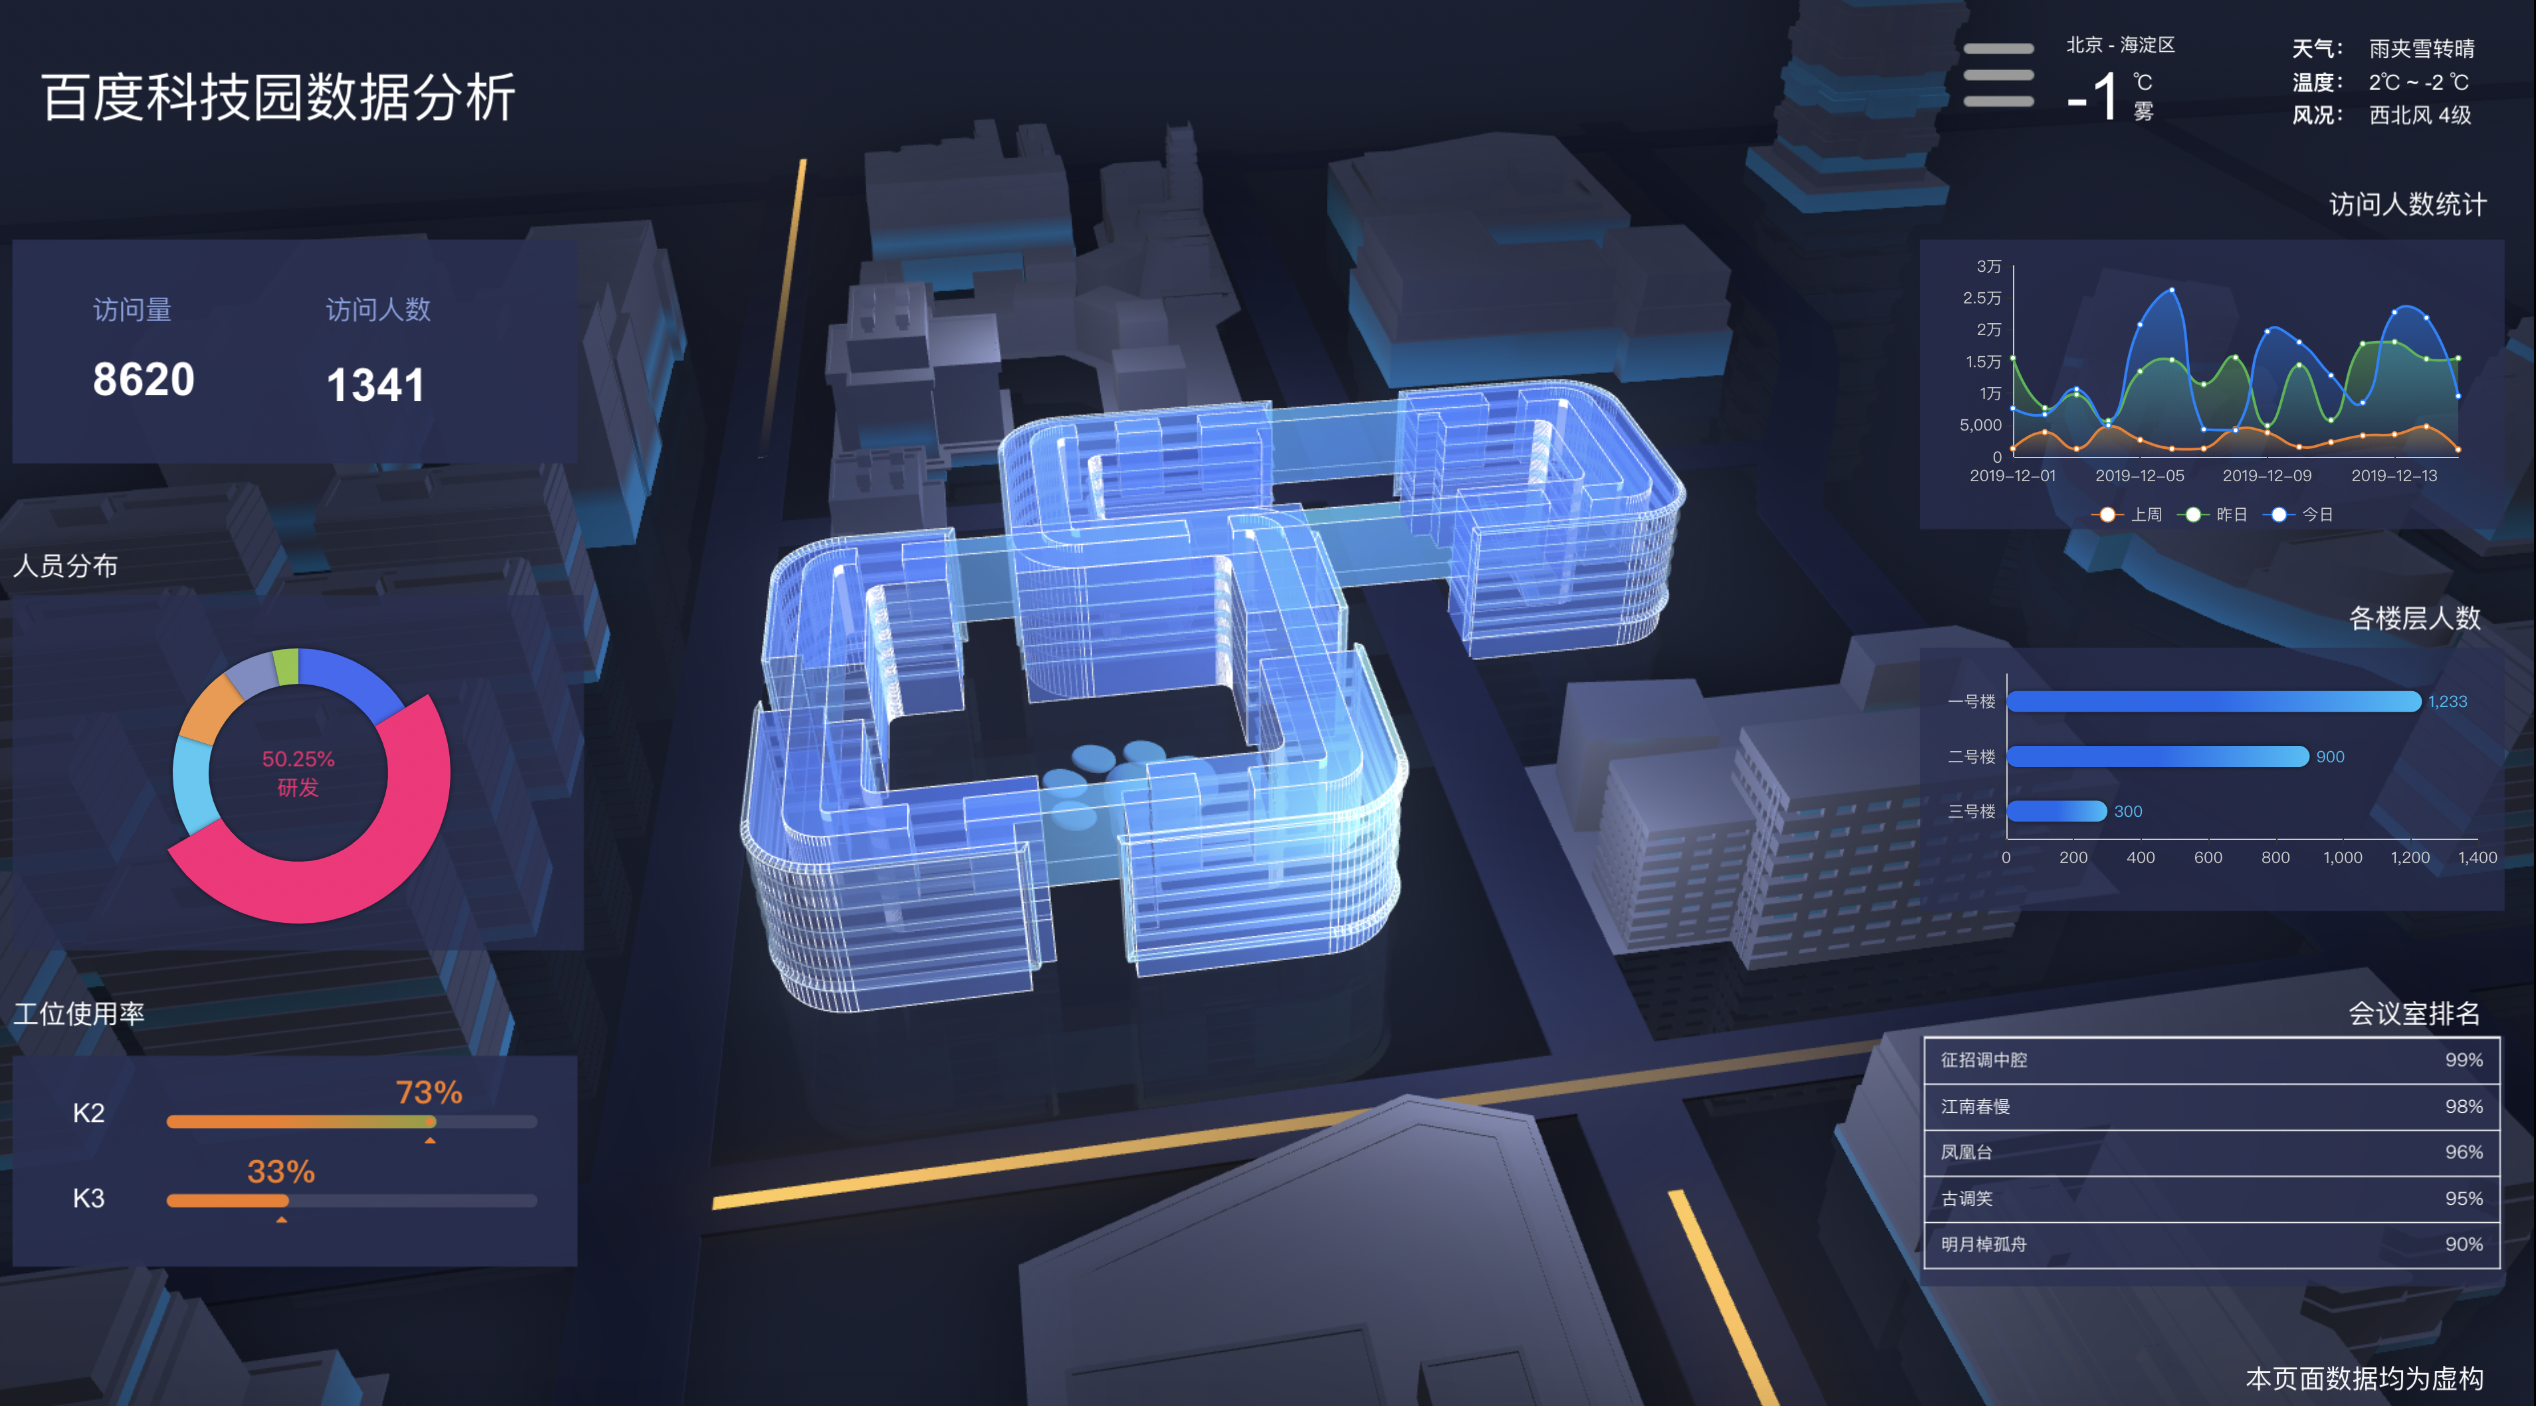
Demo1: 3D Dashboard
_5294b30.png)
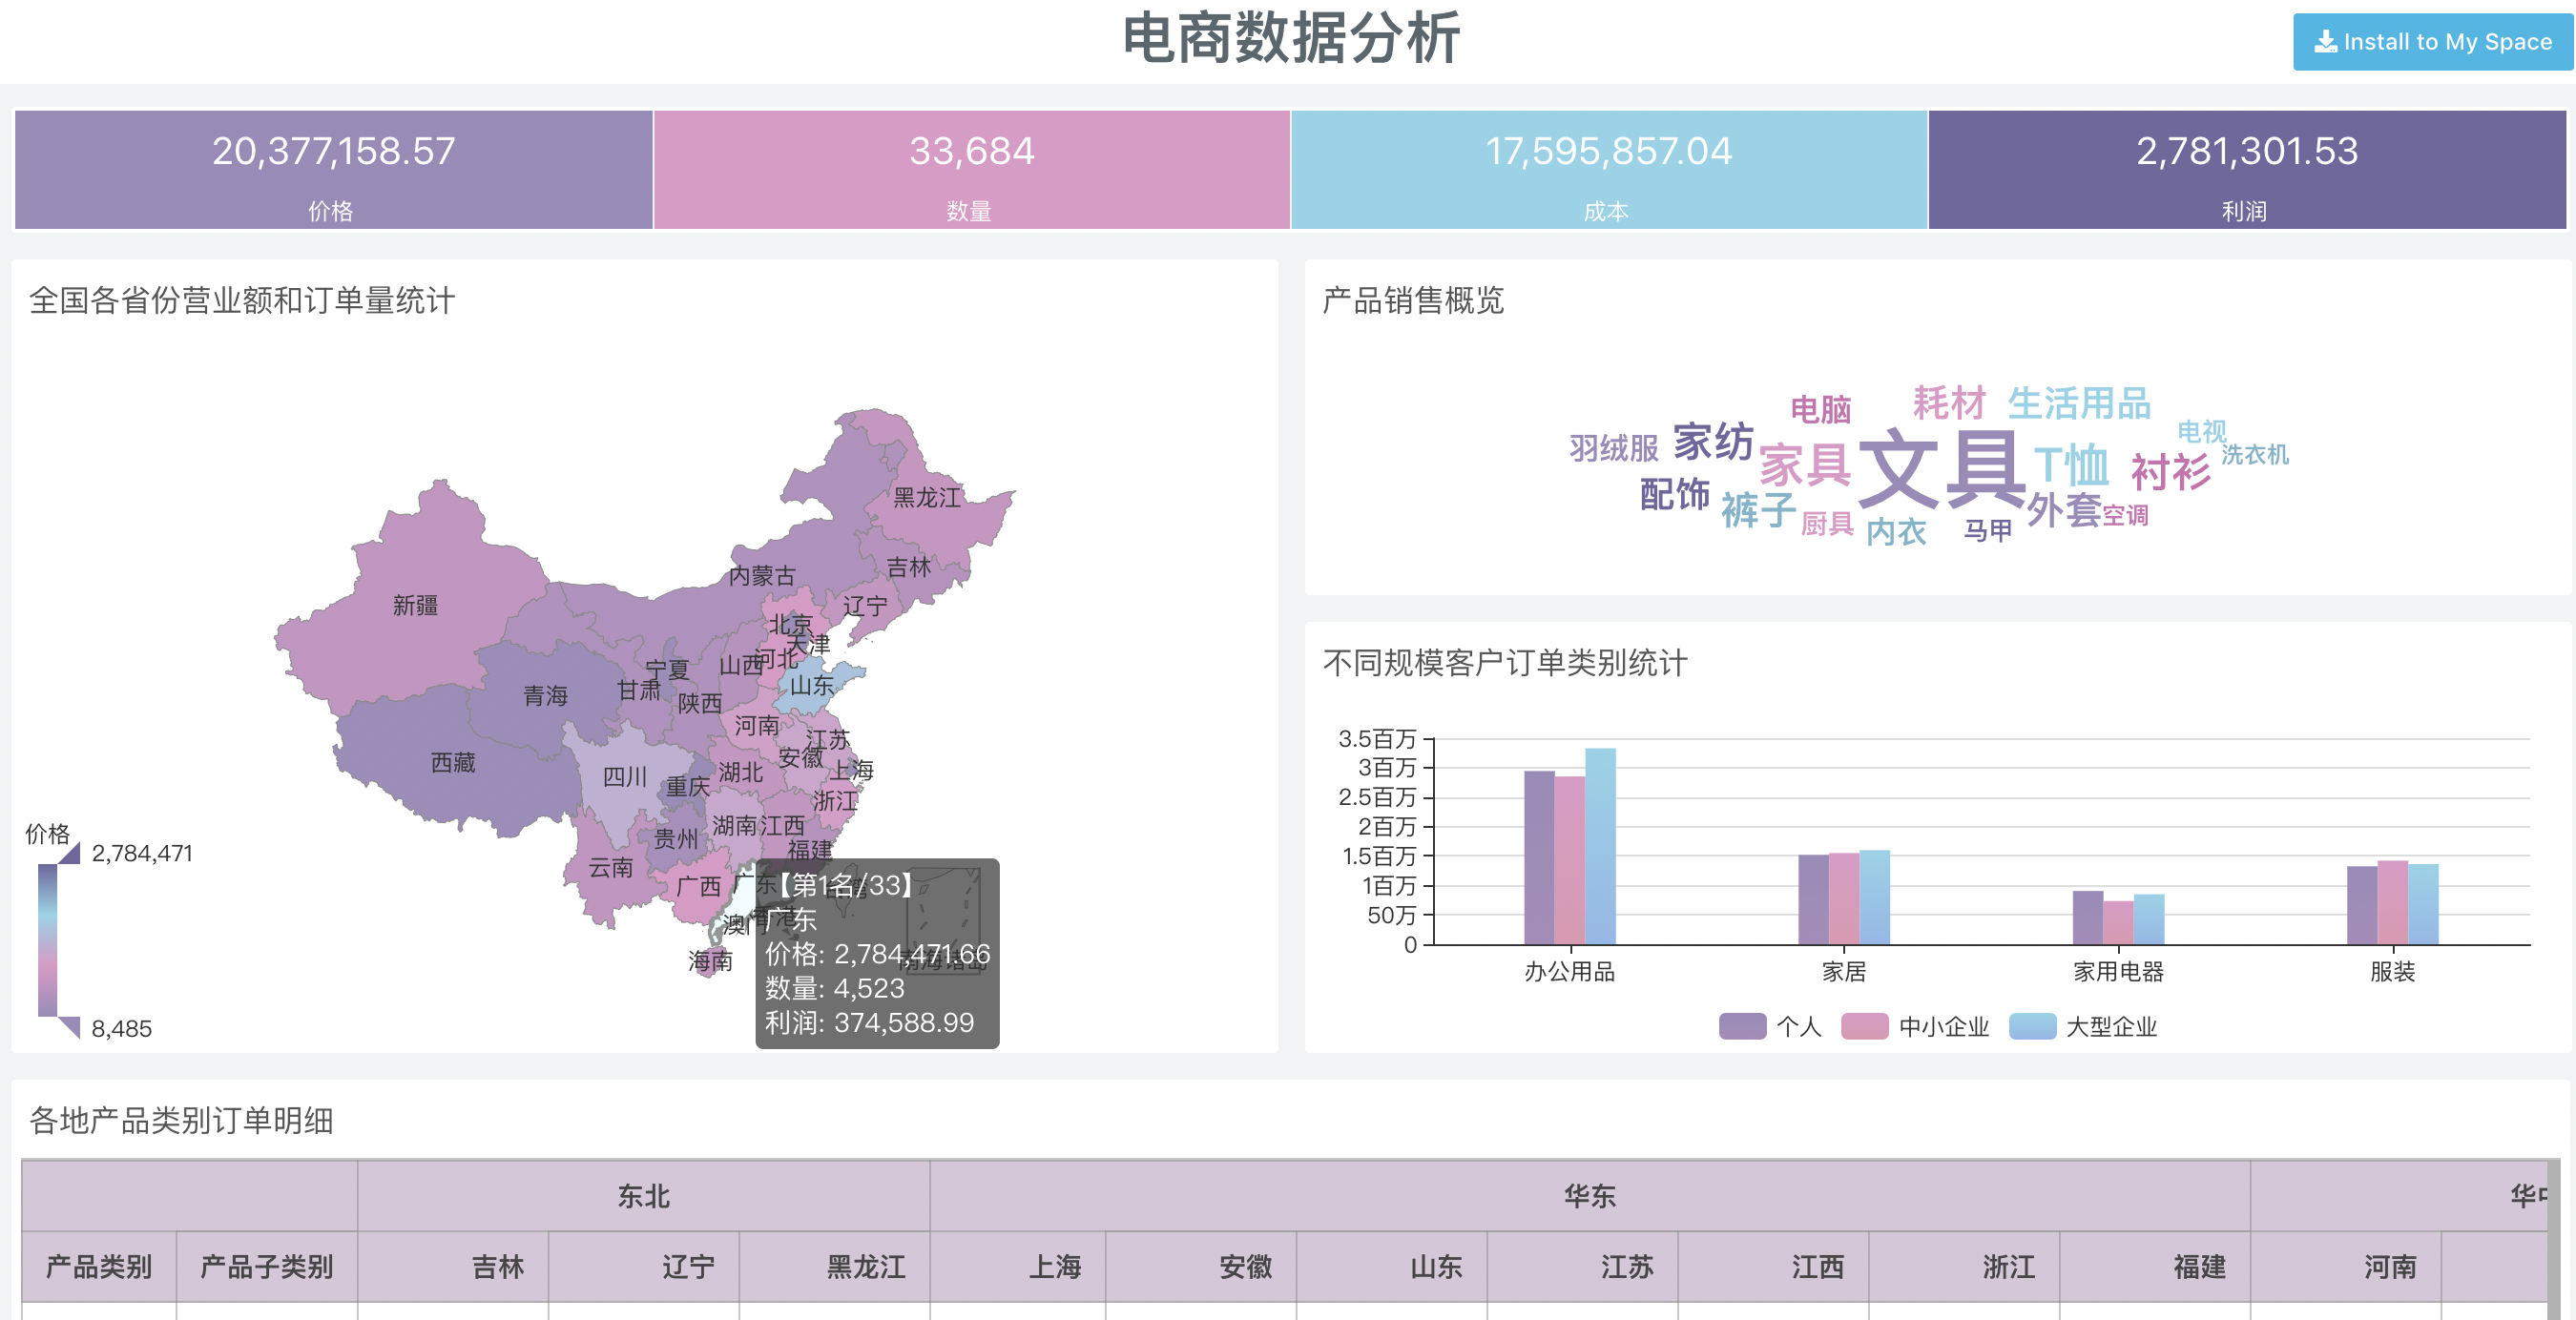
Demo2: E-Commerce Dashboard
_bb9aee1.png)
Demo3: Data Monitoring
Report Demos
Demo1: E-Commerce Analysis
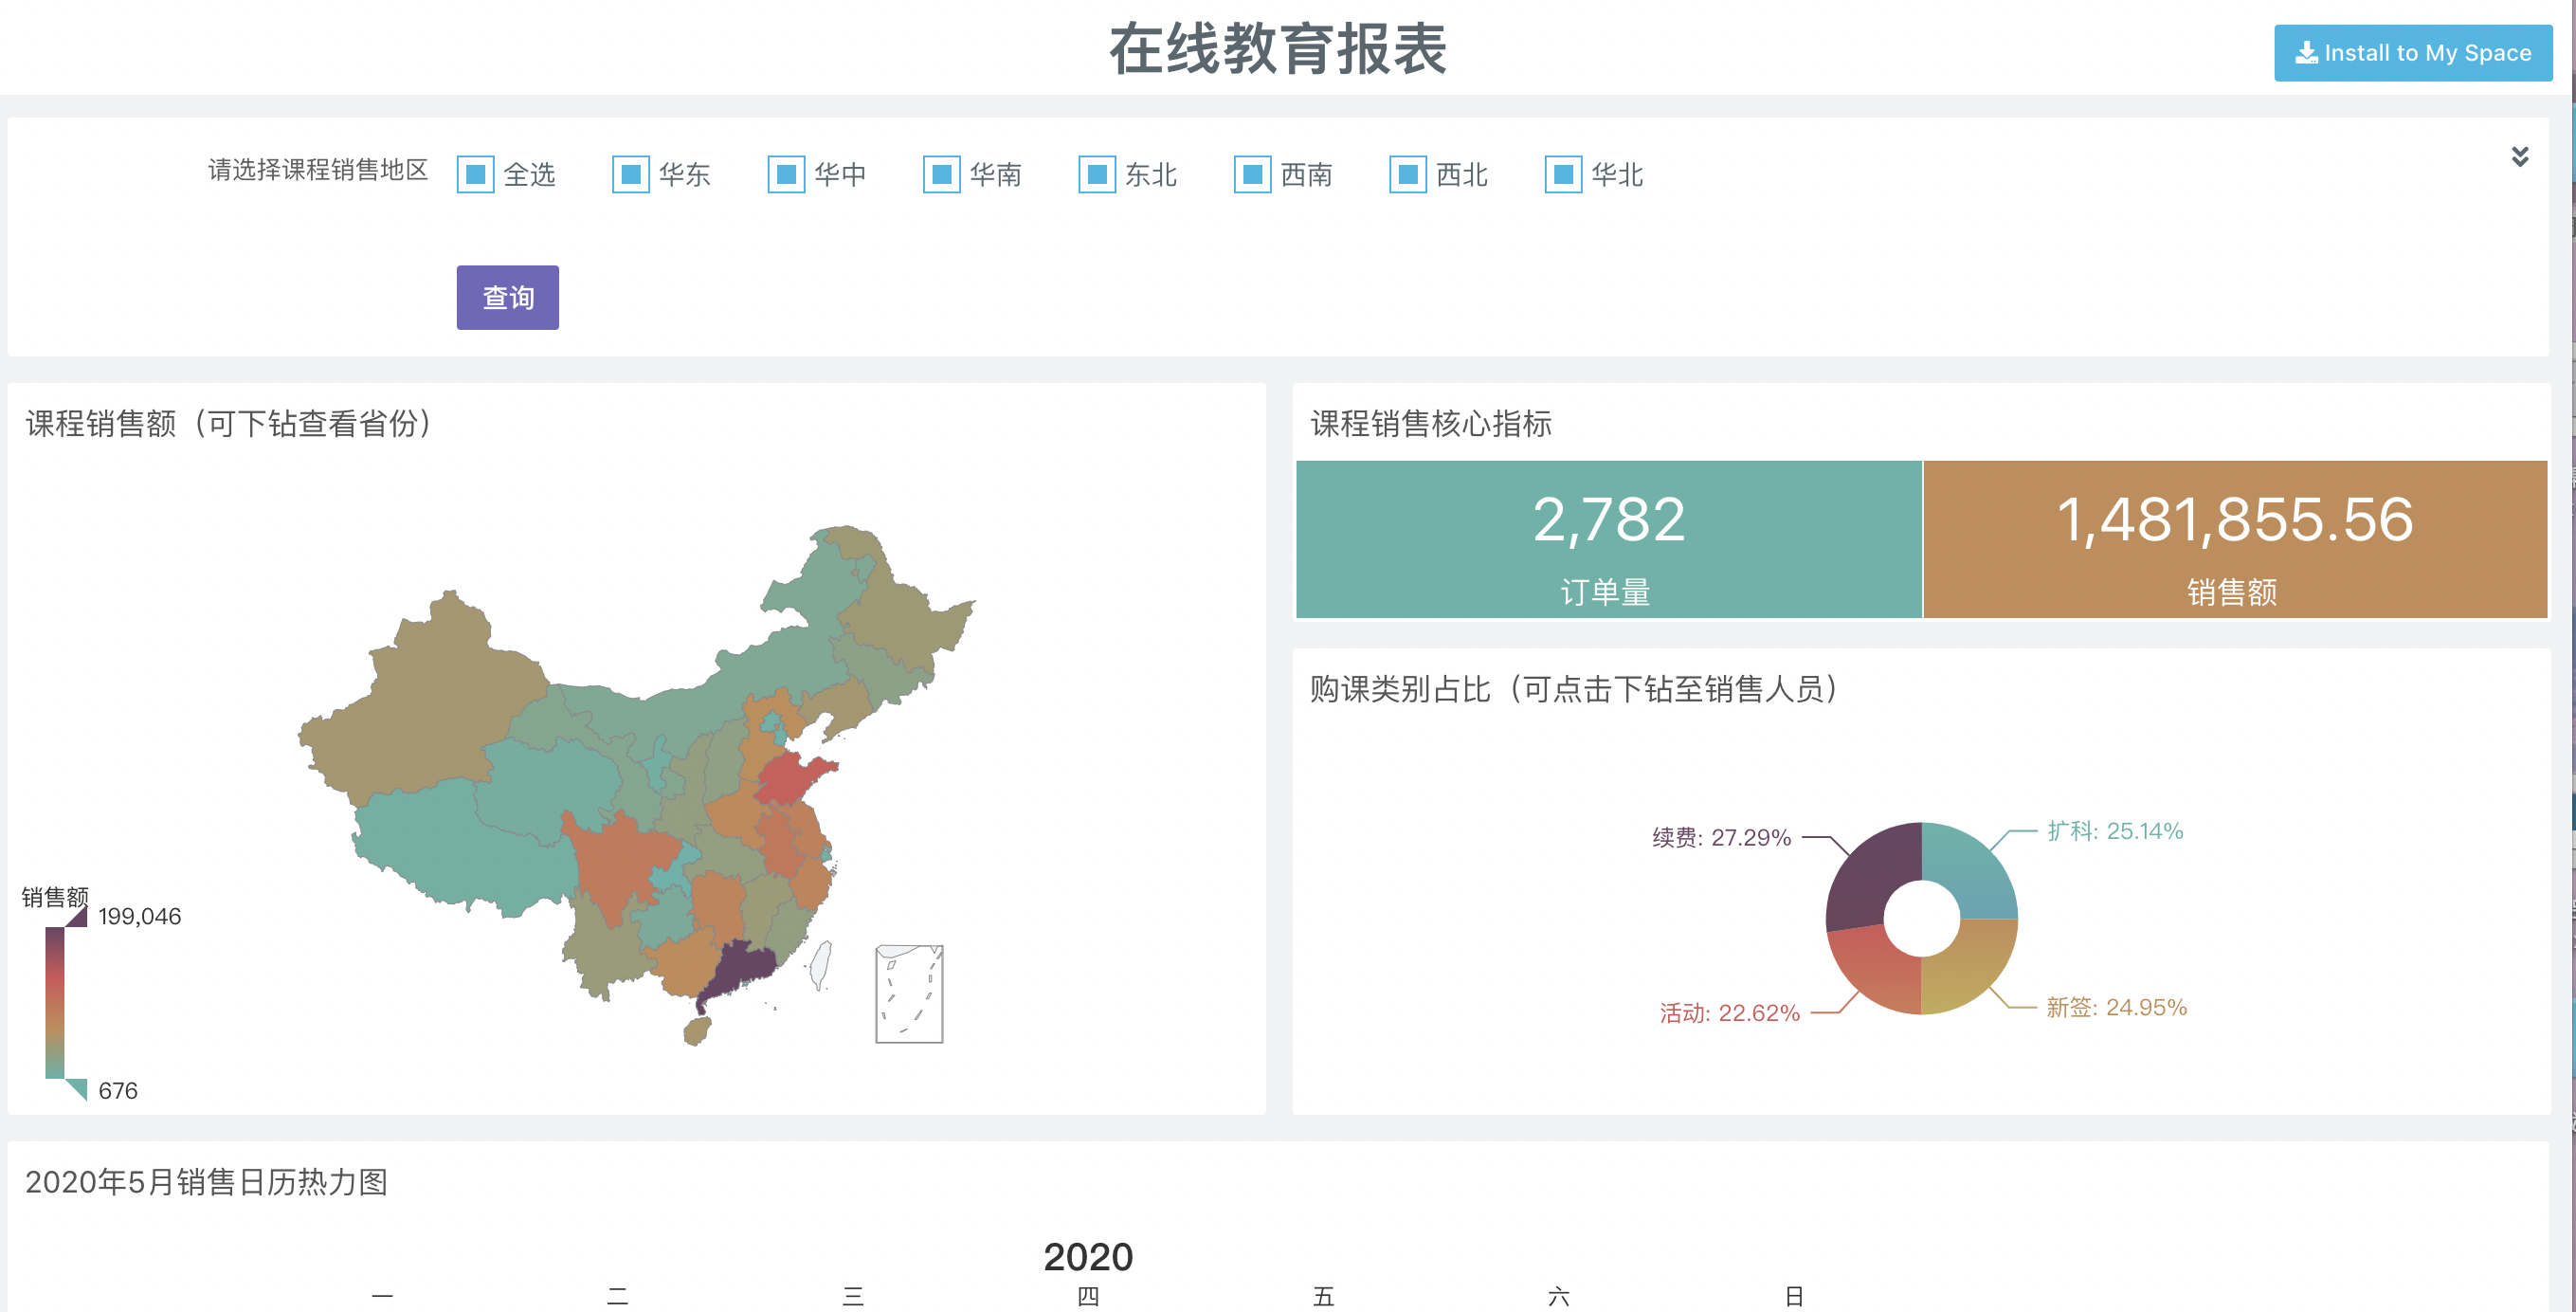
Demo2: Online Education Analysis
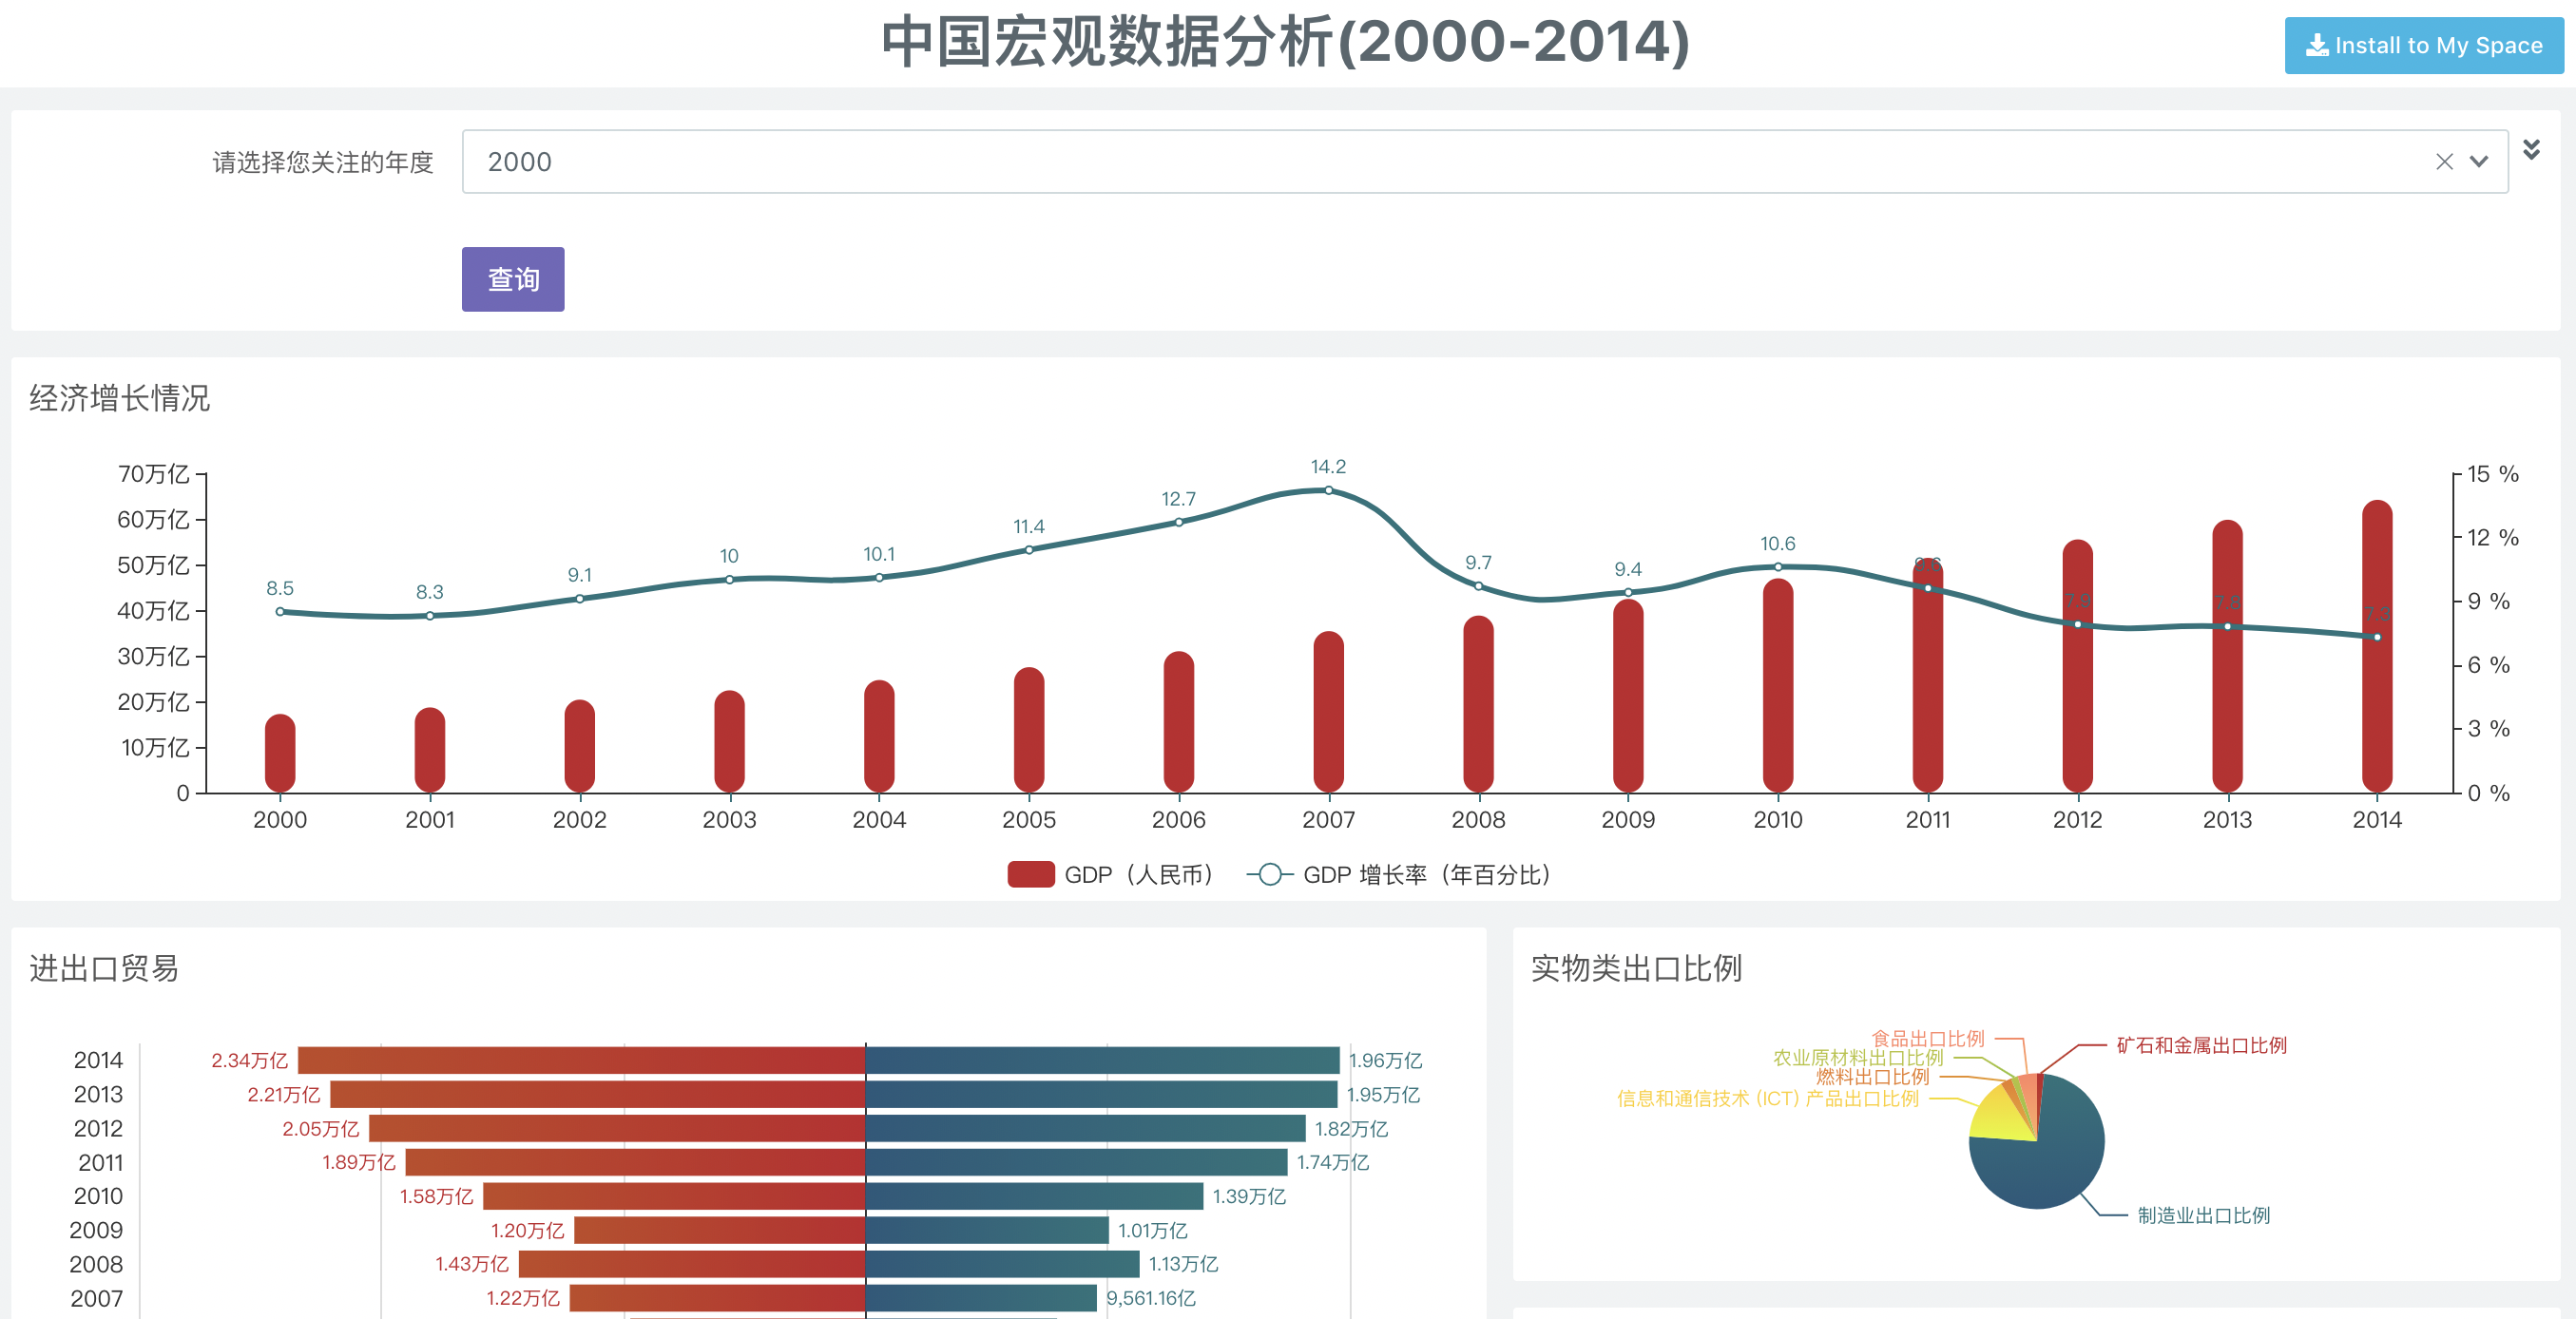
Demo3: Macro-Economy Analysis
Pricing

Fresh Version
It provides basic features for dashboard, and it suits for individual trial.
¥48Buy Now/year
- componentsGeneral
- workspace1
- large screens5
- reports0
Basic Version
It provides basic features for BI report and dashboard. It can be used by 3 users at most.
¥300Buy Now/year
- componentsGeneral & Advanced
- workspace10
- large screens10
- reports0
Advanced Version
Recommended version. It concludes all features ant applicable to multiple users in enterprise.
¥700Buy Now/month
- componentsAll
- workspace50
- large screens20
- reports2
Private Deployment
It is suitable for the private network deployment, and can connect to LAN data source.
¥30,000Buy Now/year
- componentsAll
- workspaceunlimited
- large screensunlimited
- reportsunlimited