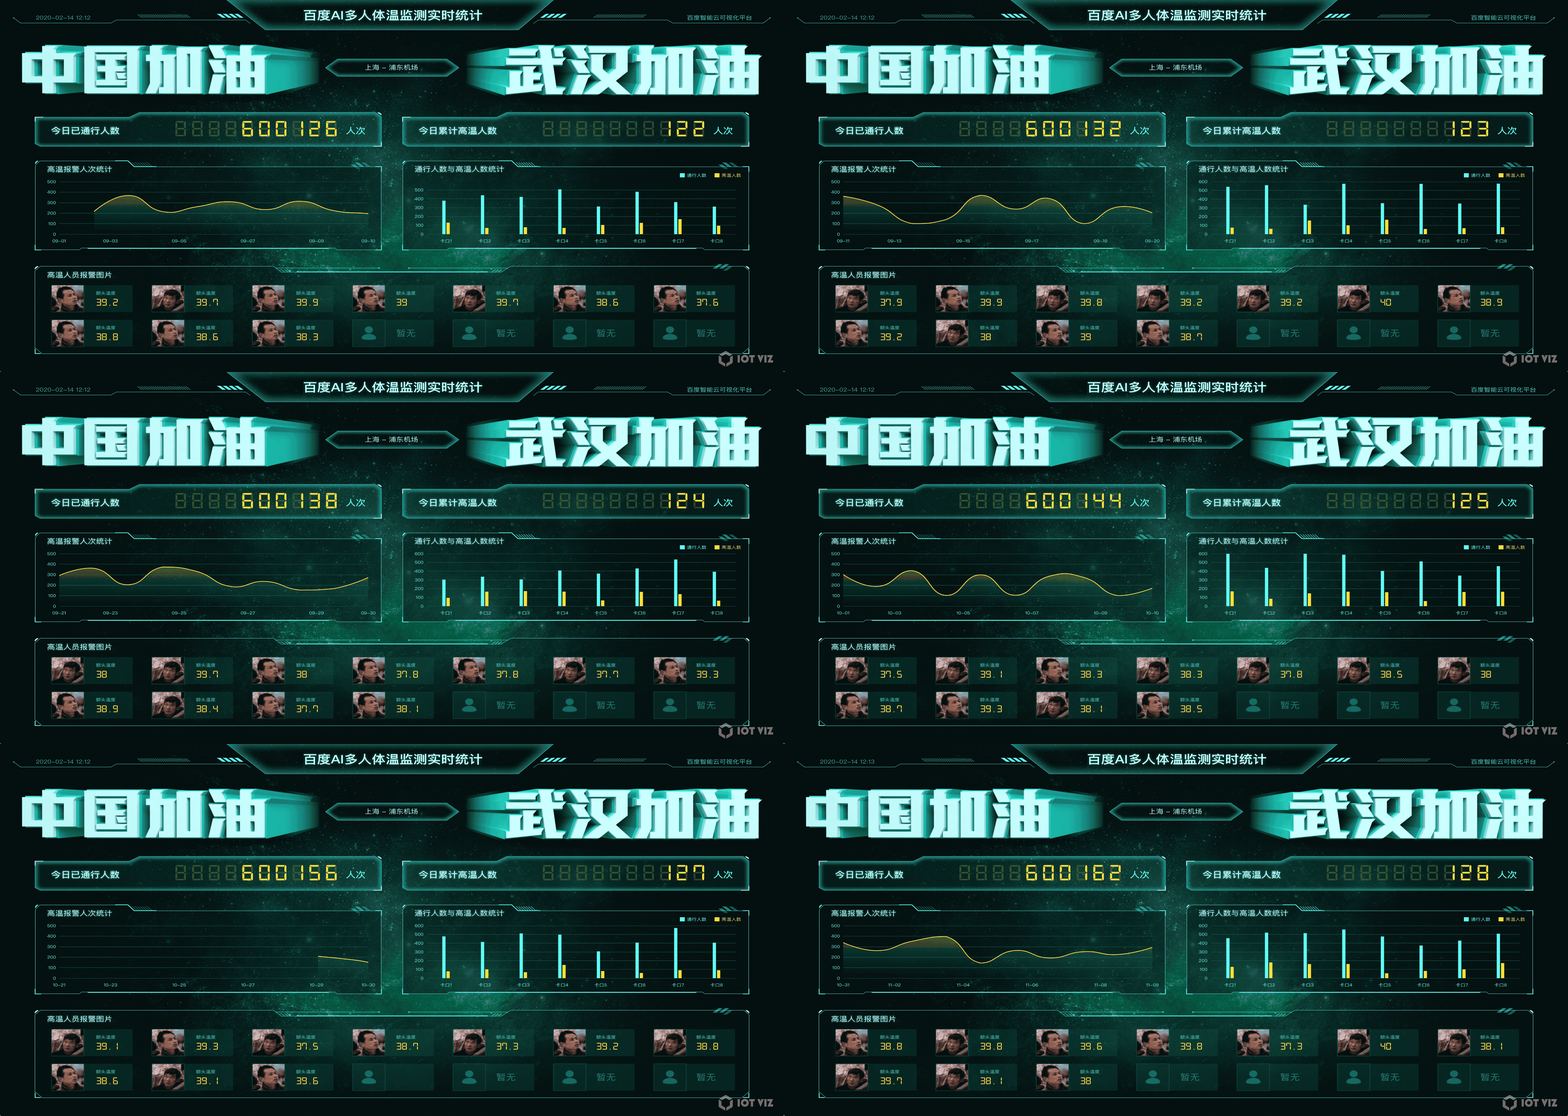
AI crowds’ body temperature monitoring and analysis
IoTVIZ helps transportation hubs, colleges and other crowded places quickly build monitoring platforms to display crowds’ body temperature data and locate people with abnormal body temperature. In addition, the monitoring platform can also link with governments’ population database to instantly identify personal information of those people with abnormal body temperature. It has been widely deployed in cities such as Beijing, Suzhou, Chongqing etc.
IoT Visualization

- Product Overview
- Product Features
- User Cases
- Visual Design Process
Product Overview
IoTVIZ is an efficient tool for developing IoT visualization applications based on graphical user interface (GUI). It enables drag-and-drop operations and provides interactive design experience, helping users with less or even no coding experience to quickly develop visualization applications. IoTVIZ has the capability of easily introducing diverse types of data sources, largely reducing the workload of data wash and transformation, and quickly gaining business insights from massive data. IoTVIZ is committed to bringing users a WYSIWYG development experience, and has been widely used in equipment monitoring, traffic planning, logistic tracking and other fields.

Product Features

Easy to Learn and Use
IoTVIZ enables users to design dashboards with drag-and-drop operations, while less or even no coding is needed.

Strong Visual Design Ability
IoTVIZ offers a wealth of visual design components, like statistical charts, web configuration diagrams and so on, and abundant industry-specific dashboards, to display all kinds of business data.

Customized for Vertical Industry Applications
IoTVIZ enables the customization of visual design components and industry-specific dashboards, helping users to both display data vividly and control devices instantly.

Flexible Integration with Third-party tools
IoTVIZ offers the capability of transforming a developed dashboard into well-maintained JS codes, or sharing the URL of that dashboard with clicking just one button. Thus, the dashboard can be integrated with a third-party application easily and quickly.
User Cases
