
Query Monitoring Information
Last Updated:2021-08-30
The Baidu AI Cloud DocDB for MongoDB management console provides abundant real-time monitoring data, facilitating you to view the running status of the instance. No fees are charged for the real-time monitoring feature.
Considerations
- The monitoring data can be saved for 40 days, so you cannot view the monitoring information generated before 40 days.
Operating Steps
- Log in to the MongoDB Management Console.
- In the upper left corner of the console page, select the region where the instance resides.
- In the left navbar, click the replica cluster instance list or sharded cluster instance list.
- Click the Instance name of the target instance to enter the Instance Details page.
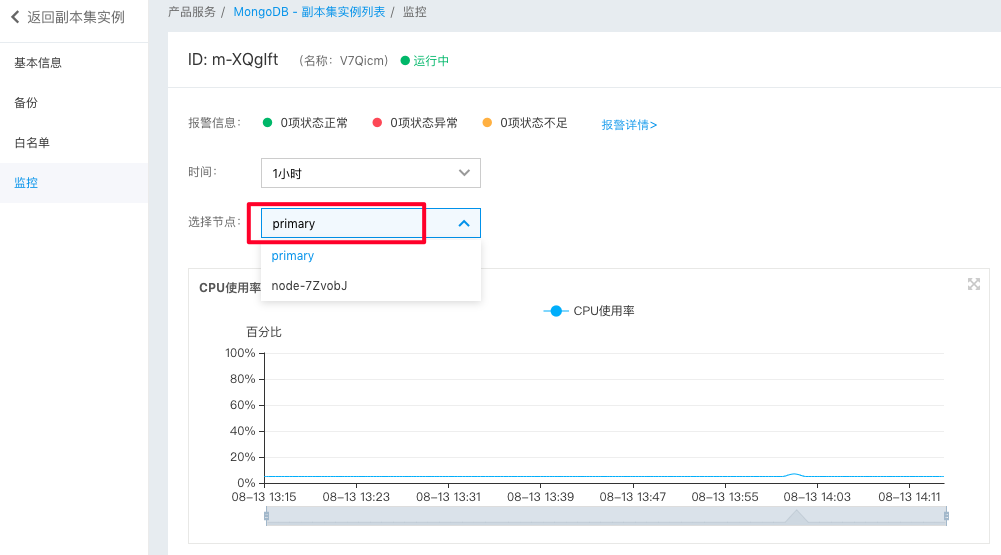
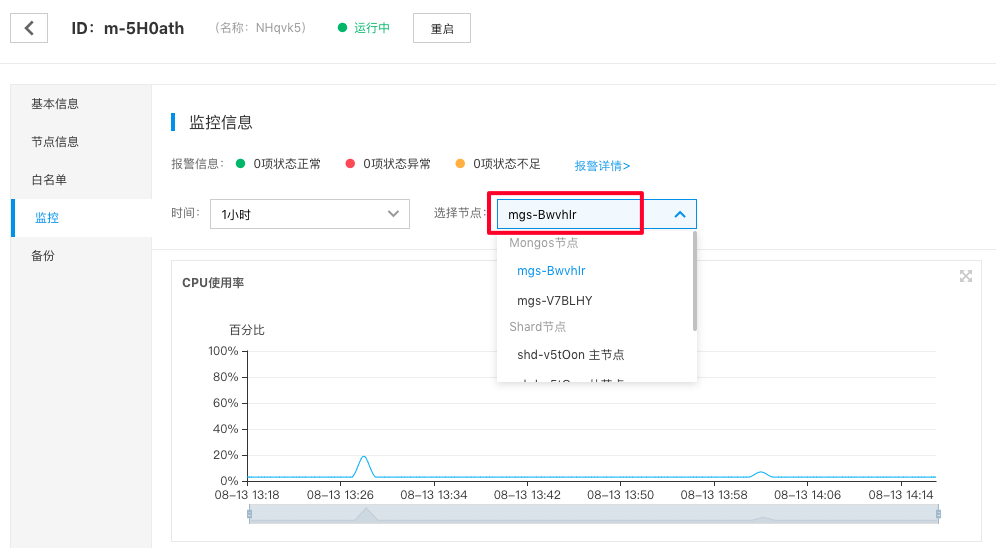
- Click Monitoring in the left navbar and select the node to view monitoring information according to the instance type. Additionally, you can view the monitored data within the period from the last 1 hour to 40 days.
Description: On the monitoring information page, the monitoring data of the instance in the latest 1 hour is displayed by default. You can also change the time to view the historical monitoring data.
- Replica cluster instance: At the top of the page, you can select the Primary or Secondary of the instance.
- Sharded cluster instance: At the top of the page, you can select the Primary or Secondary of the Mongos or Shard node of the instance.
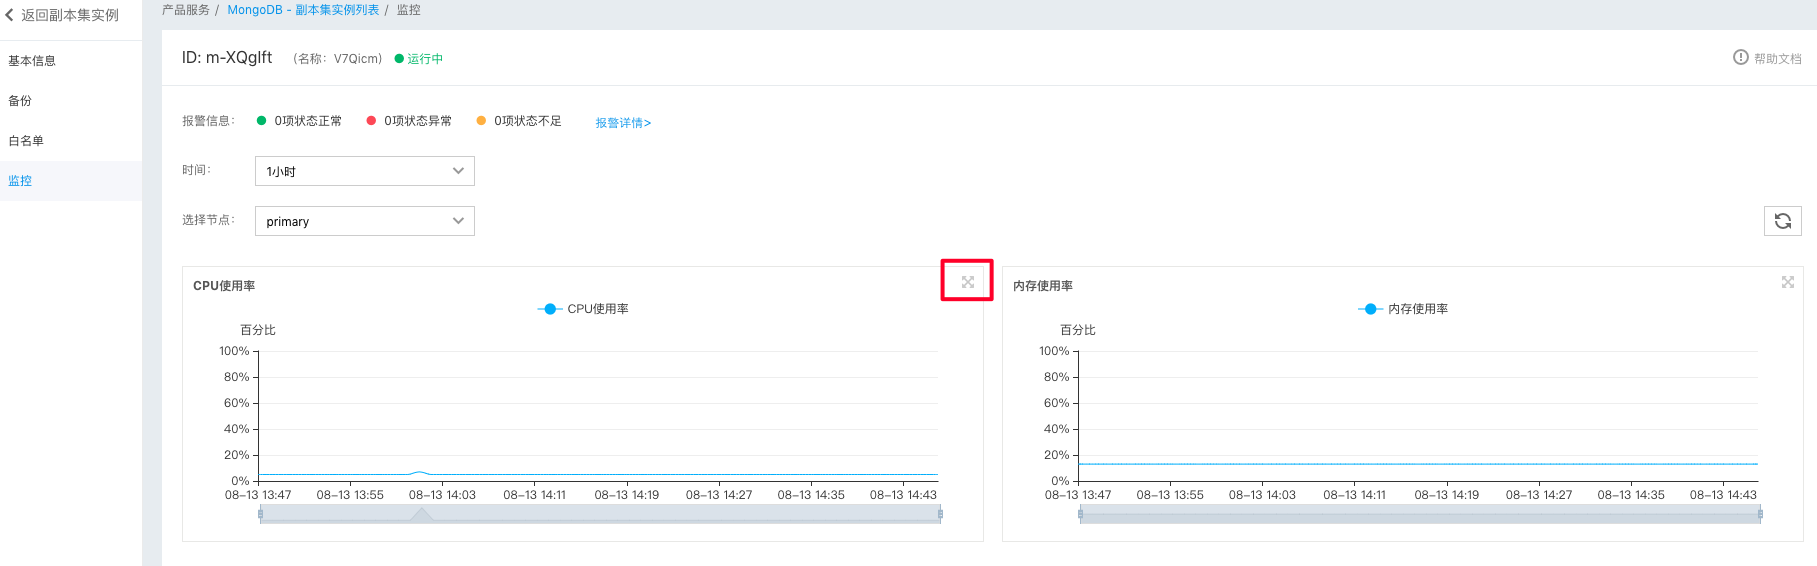
-
Click the zoom button on the monitoring curve to view the detailed information of monitoring items.
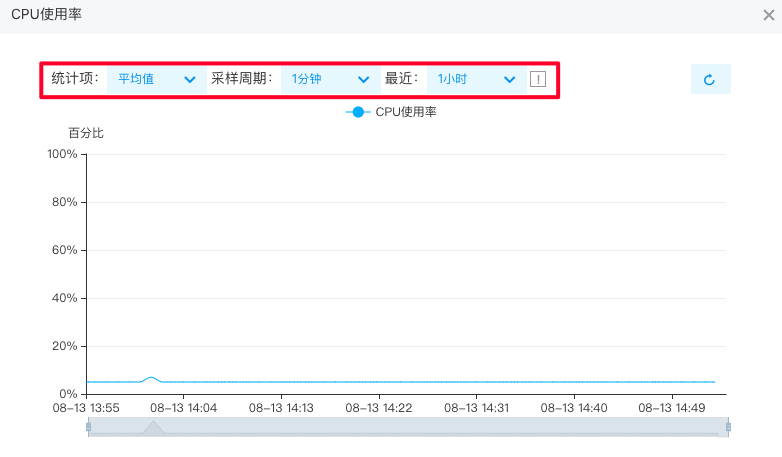
- By taking the "CPU utilization" metric as an example, click the Zoom button for the monitoring curve
- Select the Statistical item, Sampling cycle, and Statistical time to view the monitoring item.
Description of Monitoring Items
Baidu AI Cloud database DocDB for MongoDB provides the following monitoring items:
| Monitoring items | Description |
|---|---|
| CPU utilization | The CPU utilization of the instance |
| Memory utilization | The memory utilization of the instance |
| Disk space storage capacity used | The disk storage space used by this instance. |
| Disk space storage capacity usage rate | The ratio of the current disk space usage in this instance to the maximum storage capacity purchased |
| The amount in operation | The QPS operants of instances, including: insert operand query operand delete operand update operand getmore operand command operand |
| Number of instance connections | Current number of instance connections |
| Traffic | Instance network traffic: including: Entry traffic: the traffic generated by the upload in the instance. Exit traffic: the traffic generated by the download in this instance. |