
Off-line Application Scenario
Scenarios Description
Off-line data analysis is suitable for scenarios of large data scale and ordinary real-time processing, such as user behavior analysis, user retention analysis, reports, and statistics, etc. Based on big data platform of Baidu AI Cloud, you can efficiently realize off-line data analysis, including data collection, data cleaning, data warehouse, and business intelligence presentation. In particular, you can realize the above scenarios by using BLS (Baidu LogService), BOS (Baidu Object Storage), BMR (Baidu MapReduce), and Palo (Baidu OLAP engine). The common scenario of user access log analysis is taken as an example to describe off-line processing architecture as follows:
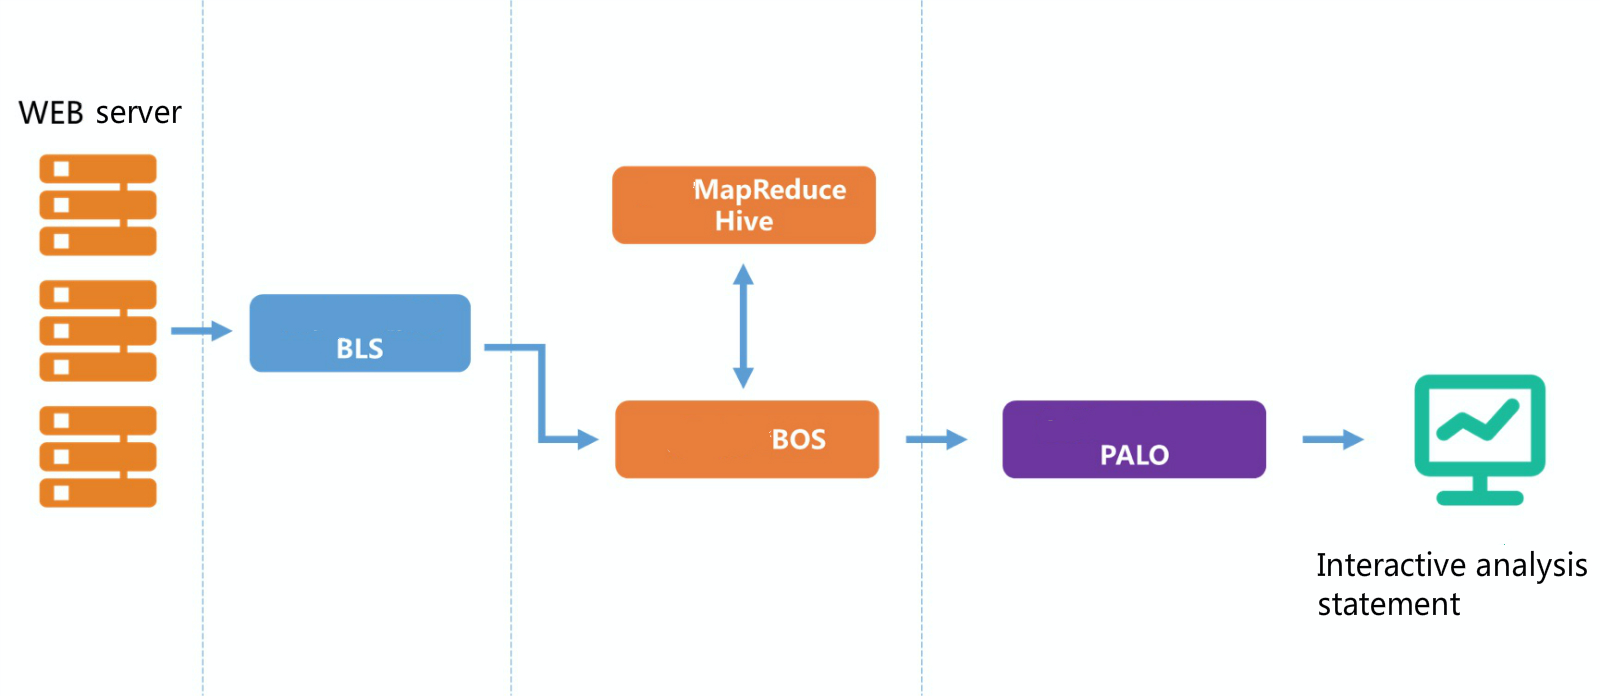
Save user access logs at file system of WEB server, and collect logs on the server to BOS for storage by creating transmission task at BLS. Clean and process log data by using the BMR cluster to run the Hive step and save the output target data at BOS. Import target data from BOS to OLAP engine Palo, and then conduct multi-dimensional analysis. Baidu AI Cloud also matches with visual analysis and application of compatible JDBC interface, allowing for more visible and efficient presentation of data analysis outcome.
Data Collection
Part 1 Collect Logs via BLS
See Documentation
Before using BLS, you need to install collector on the target machine. The collector is used to receive transmission tasks from BLS and upload log data from local disk to BOS specified directory.
In this case, the Web server runs the nginx process and configures nginx log generation path under /var/log/nginx/. The log file format access.log.yyyyMMdd is rotated according to dates. A new log file is generated every day. For example, all logs of March 20, 2017 are saved in a file named access.log.20170320. To collect log files to BOS for storage, create a transmission task at BLS. The following figure shows the specific configurations. Set source type as "Directory", configure "Source Log Directory" to be nginx log’s directory: /var/log/nginx, and configure "Match File Rules" to be log file’s regular expression: ^access.log.[0-9]{8}$.
In destination setup, select "BOS" as "Log Delivery Destination", and select “bos://quanmin-log/” as BOS destination path through drop-down box. Besides, you can reorganize the directory architecture of log data at BOS based on log aggregation needs. Take the "Time-based Aggregation" in this case as an example. Note that the time stamp of the source log file is yyyyMMdd, which matches with regular expression of the time stamp in the log file name on the server. BLS collector matches the log file name according to this regular expression to obtain time data for log file modification. After then, select "User Custom" to configure a specific aggregation path. Enter the configuration “%Y%m%d”, which means the configuration of the BOS destination path is bos://nginx-logs/%Y%m%d/. Because of different Web servers, you need to show the server of log source in the log save path. Check "CVM Server-based Aggregation" and select aggregation based on CVM server ip. The path of log data saved on BOS conforms to the format of bos://quanmin-log/%Y%m%d/%{ip}.
Data Cleaning
Part 2 Create BMR Clusters and Run Timed Tasks
After the configuration of the BLS transmission task, the logs generated every day are transmitted to the specified BOS directory. The nginx log contains many fields, and you need to select and convert fields to obtain satisfactory data. You can use BMR scheduled task to run Hive steps regularly every day and conduct active user retention statistics based on data imported into BOS.
In this case, the specific operating steps are as follows:
-
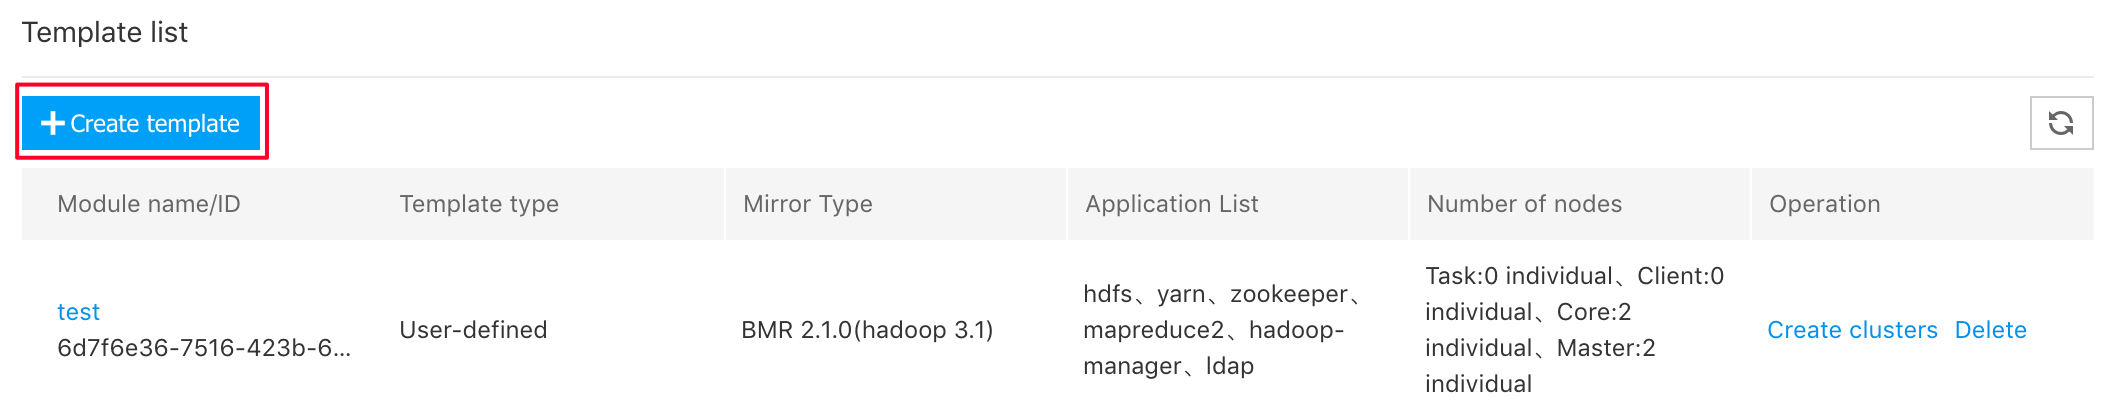
Create cluster template by clicking the "Create Cluster" button in the middle of "Cluster Template" page (left navbar of BMR console):
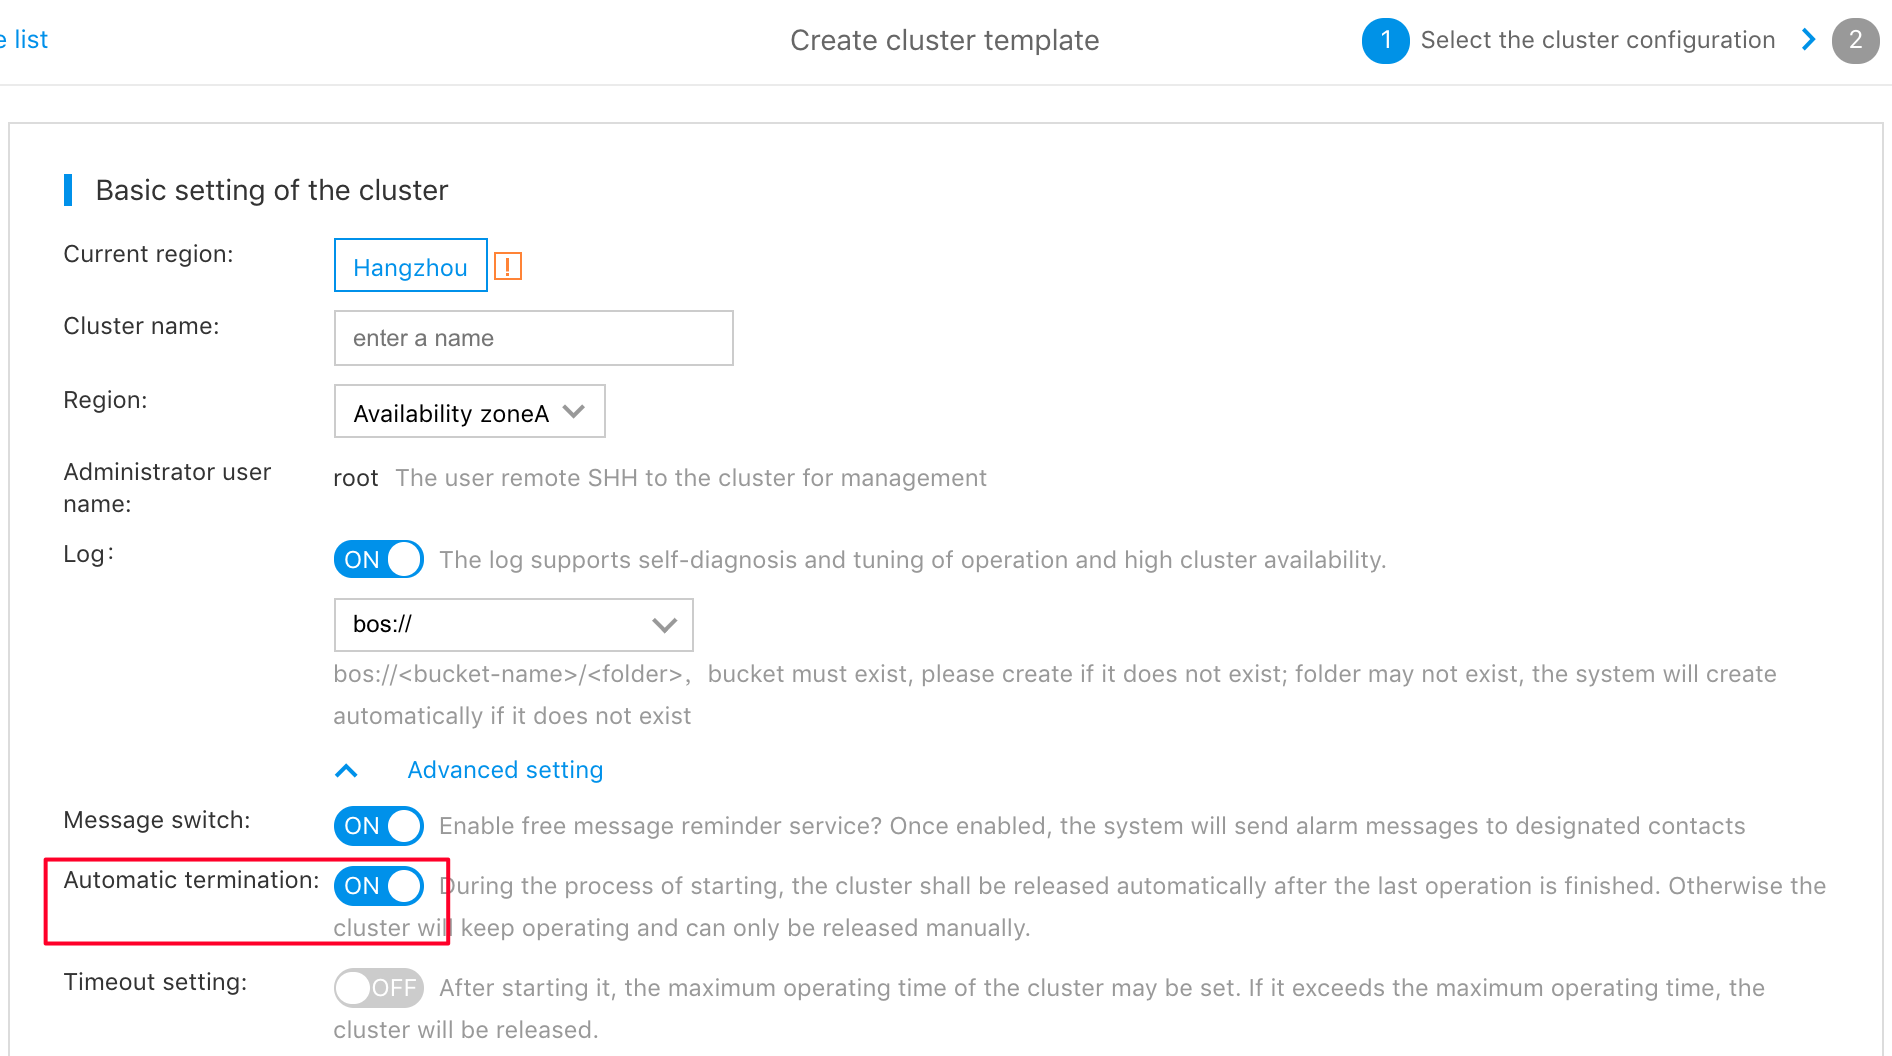
Two notes on entering template creation parameters:
- Enable "Automatic Termination" to automatically release cluster and stop billing after completing the scheduled task. If not enabled, the cluster created during the running of scheduled task keeps active and is included in product costs:
- Add hive application, or the cluster cannot run hive step:
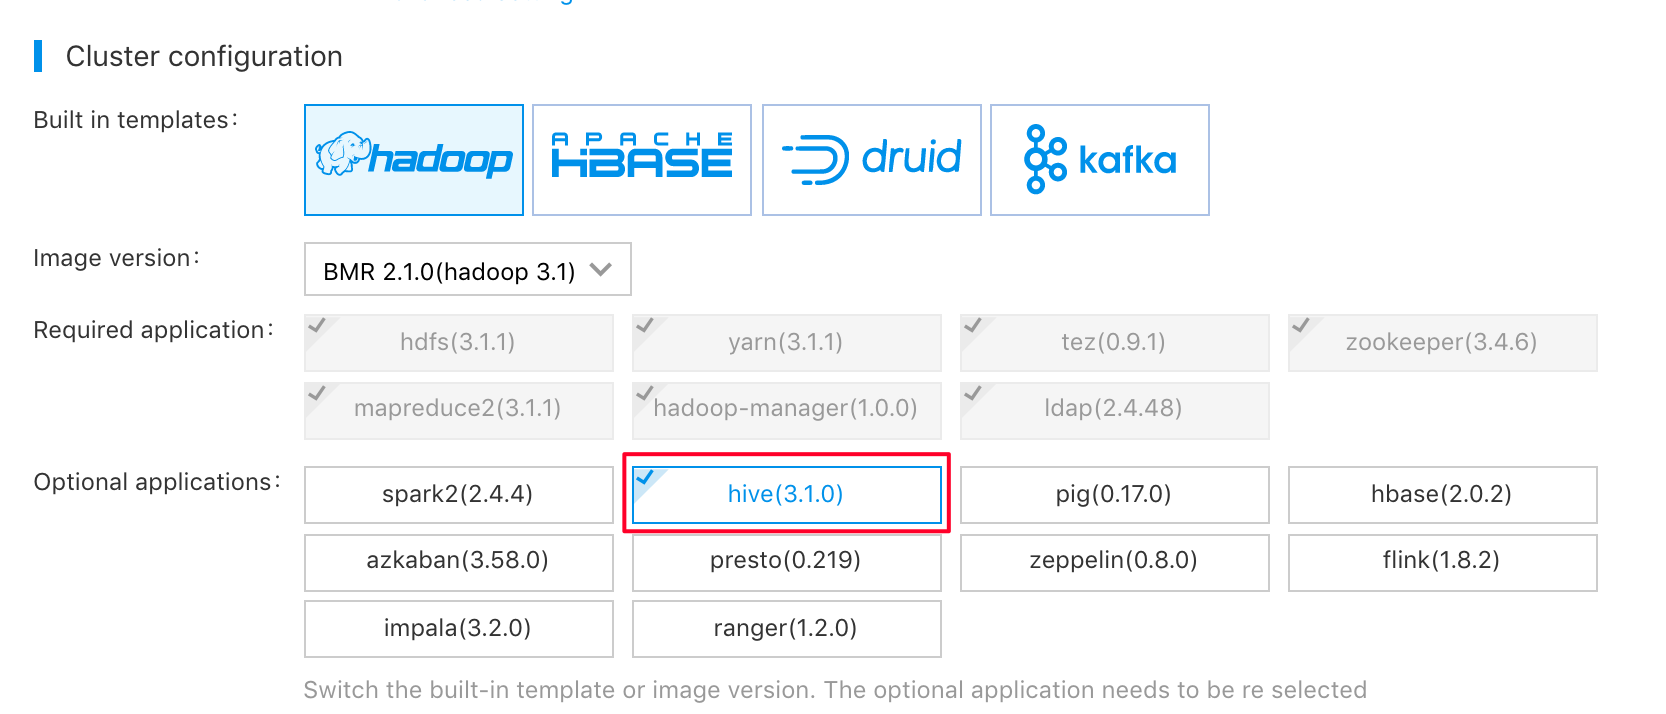
The configuration of the cluster node is based on the scale of the task. If you do not know the actual scale, you can keep default node configuration and then change it according to the exact running time.
-
Create a scheduled task by clicking the "Create Task" button in the middle of "Timed Task" page (left navbar of BMR console):
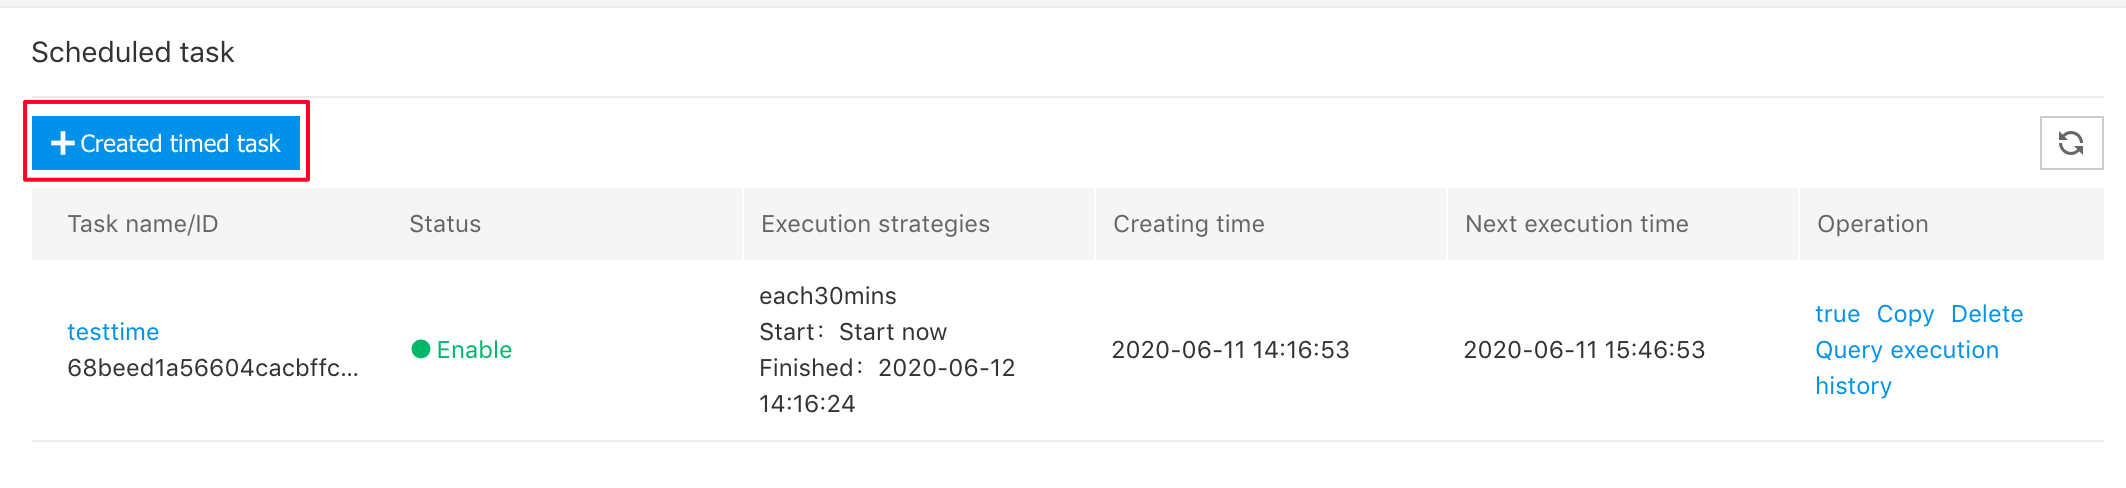
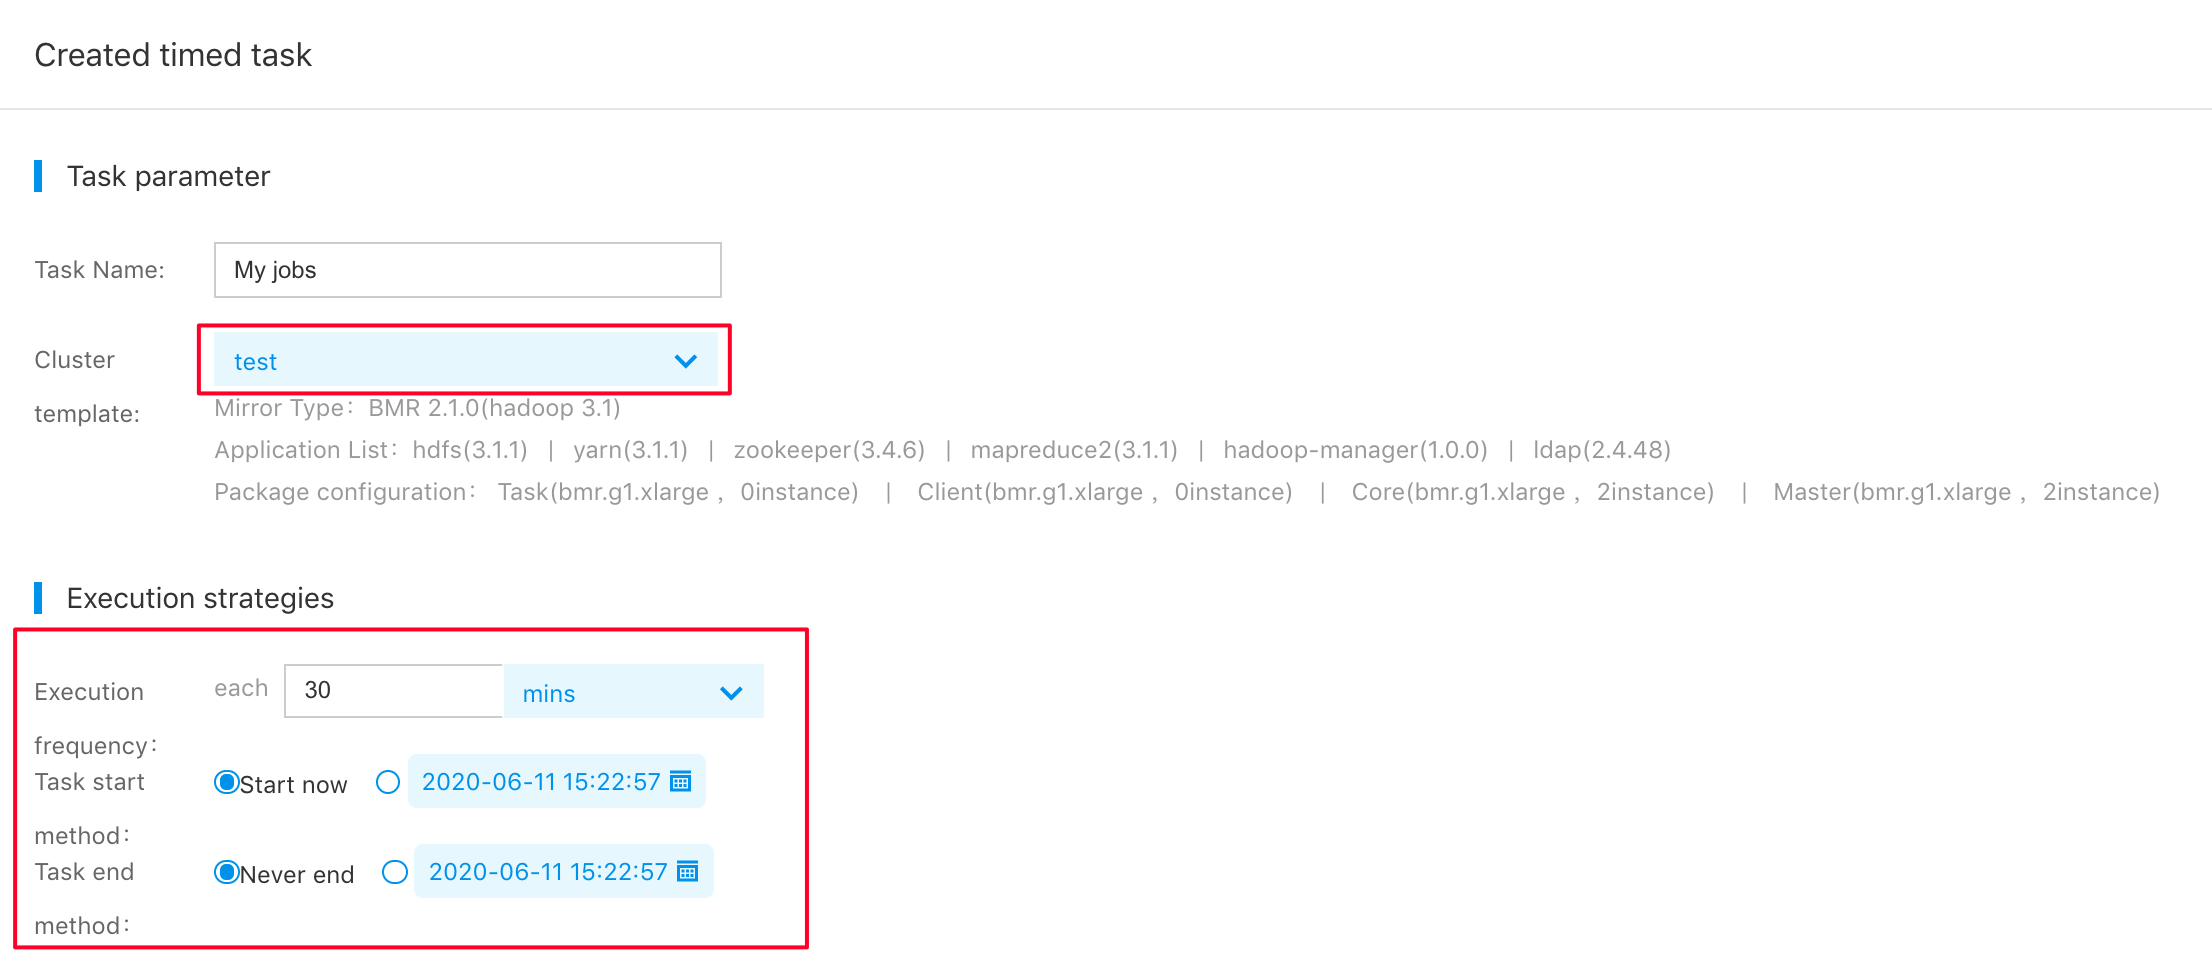
Configuration of scheduled tasks mainly involves cluster template, execution policy, and step. You need to select a cluster template which is just created. You can select an execution policy according to actual business needs. The analysis of daily running data is taken as an example, and the executive configuration frequency is 1 day. The task start time is an immediate start. If you want to see data outcome in the morning of the next day, you can set the start time to be a specific time point early in the morning.
-
Add the Hive step to the scheduled task. Hive step written by us processes original log data as follows:
- Attribute a value meaningless to business to the null value.
Palo does not support null value fields, so you need to process null value fields in the log (processed as 0 at present).
- Convert IP information to location information.
IP-GEO base and UDF can be used to convert IP information to geographical location information accurate to the city level. Longitude and latitude information is provided to use visualization tools to prepare map reports.
- Break time field into multiple fields.
For easy download and query, the time field in logs is broken into year, month, day, hour, and minute. To accelerate query by presenting the date type in Palo and keep the field’s meaning, you need to make sure year and month fields are legal values conforming to yyyy-mm-dd format. Hence, the year field is always the first day of the year, and the month field is always the first day of the month. For example, the year 2016 means 2016-01-01, and July 2016 means 2016-07-01.
- Conduct statistics on user retention of the next day.
Retention of the next day means access IP subsets of the last day among all access IPs of the current day. In other words, the client IP conforms to the retention of the next day if it appears in the nginx access log on a specific day and a day before that.
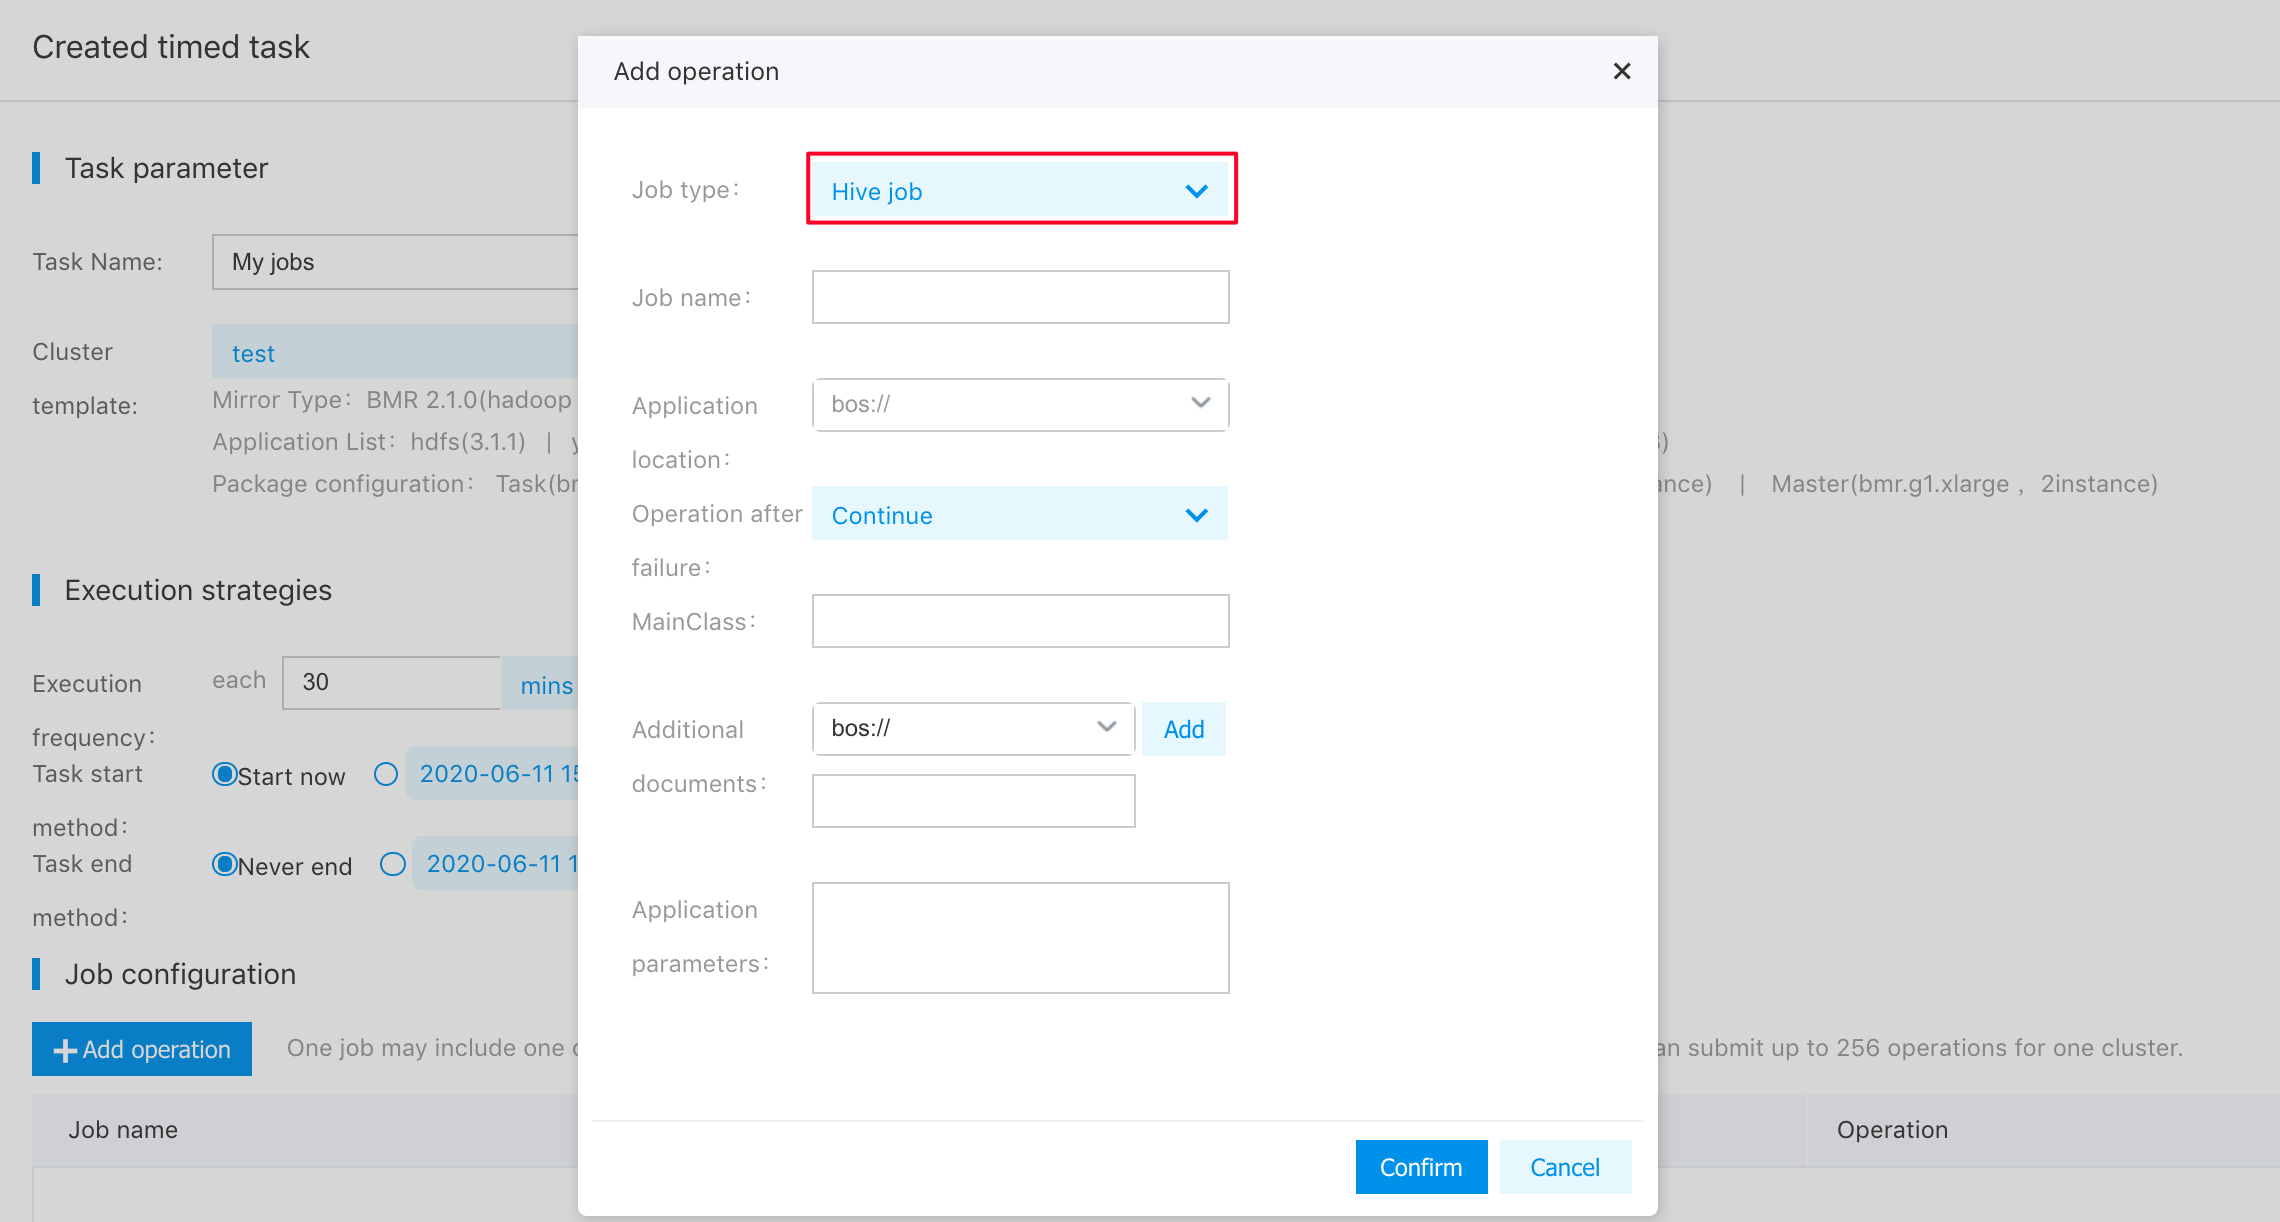
Click "OK". The example of the scheduled task only has one Hive step, so you can click "Finish" to submit the scheduled task.
For standard steps of creating a scheduled task, please see Documentation;
For a standard example of Hive step, please see Documentation.
Reports Presentation
Part 3 Palo Table Creation and Data Import
The data processed by BMR after it runs the hive step is saved at BOS. In this case, the scheduled task above runs the hive step, and the configured BOS output address is bos://quanmin-bmr/hive-output/%Y%m%d/access_pv/, where “%Y%m%d” is replaced with numbers (for example 20160601) according to the actual date of task execution. To import BMR cleaned data to Palo, you need to establish a database table in advance in Palo. Firstly, create a cluster at Palo service. For creation steps, please see Documentation.
After the cluster is created, Palo provides an interface compatible with MySQL, which can directly use MySQL-related bases or tools to connect Palo clusters. Currently, Palo only supports MySQL client of version above 5.0, and you need to confirm the client version before connection. Take MySQL Workbench for example:
-
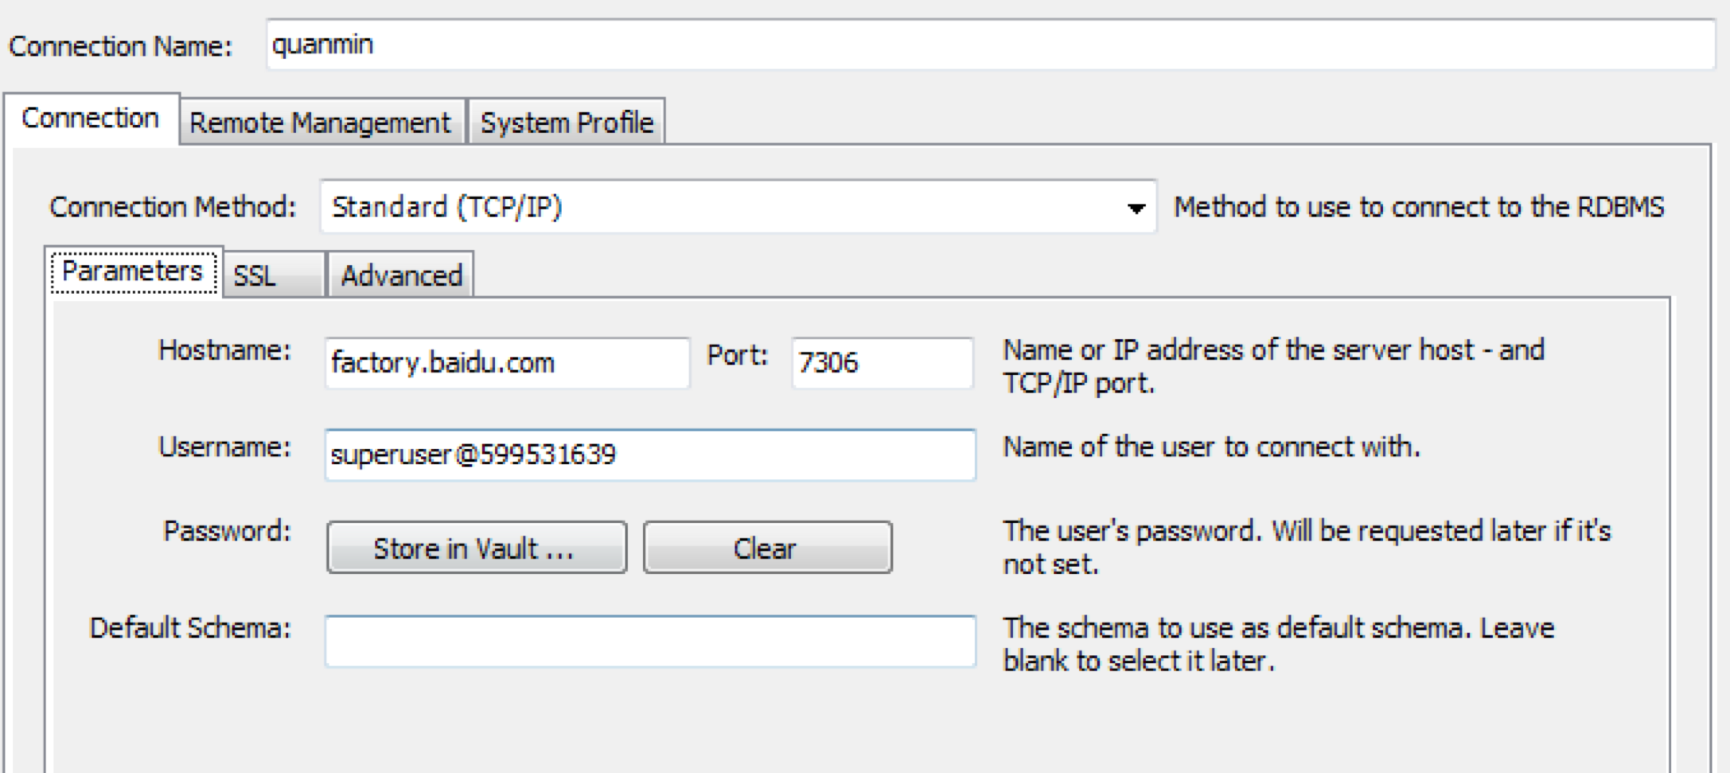
Connect the Palo cluster. The information on used configurations is available on Palo cluster details page:
- hostname: factory.baidu.com
- port: 7036
- username: superuser@cluster_id, and cluster_id is 599531639 in the instance
-
Create database.
CREATE DATABASE QUANMIN;
-
Create data table. Currently, you need to establish two tables: one is detail table of all data and fields, and another one is retain_day table (all fields included in current page). Creation statement for detail table is as follows:
CREATE TABLE detail ( platform int, action varchar(100),
v1 varchar(100),
v2 varchar(100),
year date, month date, day date, hour datetime,
minute datetime, time datetime, user_id int, device varchar(50), ip varchar(20),
server_ip varchar(20),
province_name varchar(50),
city_name varchar(50),
longitude varchar(20),
latitude varchar(20),
pv int sum ) engine = olap partition by range(time) ( PARTITION p1 VALUES LESS THAN ("2016-08-01 00:00:00"), PARTITION p2 VALUES LESS THAN ("2016-10-01 00:00:00") ) distributed by hash(platform) - Finally, import BOS data, and continue to execute statement in MySQL Workbench:
load label detail1 (
data infile("bos://quanmin-bmr/hive-output/2016-07-30/*") into table
`detail` columns terminated by "," (platform, action, v1, v2, user_id, device, time, year, month, day, hour,minute, ip, server_ip, province_name, city_name,longitude, latitude, pv)
)
PROPERTIES(
"bos_accesskey" ="your_ak",
"bos_secret_accesskey" = "your_sk",
"bos_endpoint"= "http://bj.bcebos.com"
);-
Use mainstream BI/Visualization tools to analyze and present data. Palo supports connection and access via the JDBC interface. Hence, BI/Visualization tools compatible with the JDBC interface can connect the Palo cluster to conduct visualization analysis on imported data.
For complete statement rules on Palo import of BOS data, please see Documentation.
Notes:
- After the successful import, if you want to use different import labels next time, you need to replace your_ak and your_sk in import statement with real ak and sk. Baidu AI Cloud uses ak and sk to verify user identity, and you need to keep them properly.
- During the import, you can use the “SHOW LOAD;” command to view the load process.
- After the successful import, you can use MySQL client and BI/Visualization tools for query and analysis.