
Use Hive to Analyze Website Logs
Overview
The website log contains user access information. Analyzing log can help us understand user behavior (such as website traffic, page visits, page visitors, and time frame of frequent visits) to improve the commercial value of the website. The hosting Hadoop service like Baidu MapReduce (BMR for short) is very suitable for website as it generates massive logs every day. Besides, BMR integrates Hive and Hue, and the use constraints are significantly reduced as the developer can interact with the Hadoop cluster in browser, analyze and process data, and create dataset and query Hive.
Example Log
Example log is Nginx log and stored in a publicly readable path of Baidu Object Storage (BOS):
- The storage path of sample data in the “North China - Beijing” region is bos://datamart-bj/web-log-10k/, and it is only available for BMR clusters in the North China region.
- The storage path of sample data in the “South China - Guangzhou” region is bos://datamart-gz/web-log-10k/, and it is only available for BMR clusters in the South China region.
For the region description of Baidu AI Cloud, please see Description of Region Selection.
Summary of Analysis Process
How to use BMR to analyze Niginx log:
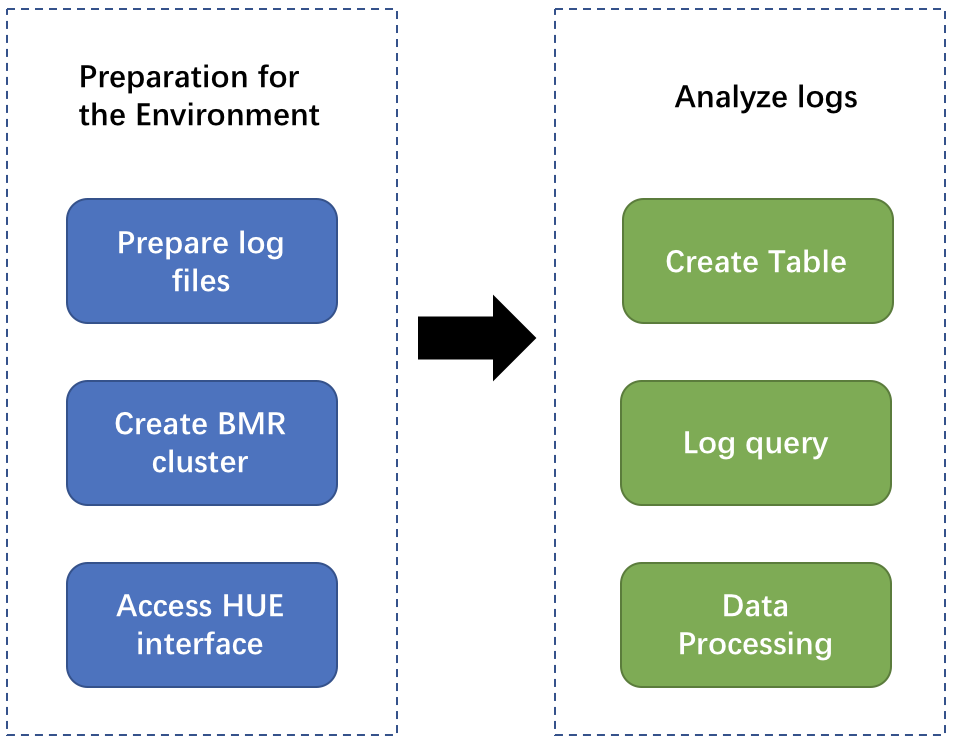
Environment Preparation
Prepare Log Files
You can skip it and directly use the example log provided by Baidu AI Cloud. After knowing how to analyze the log, you can refer to Data Preparation to select your log data.
Create a BMR Cluster
- Open "Product Service>MapReduce>Baidu MapReduce-Cluster List", and click "Create Cluster" to enter the cluster configuration page.
-
Cluster configuration: Follow page instructions to enter information. Refer to the following figure:
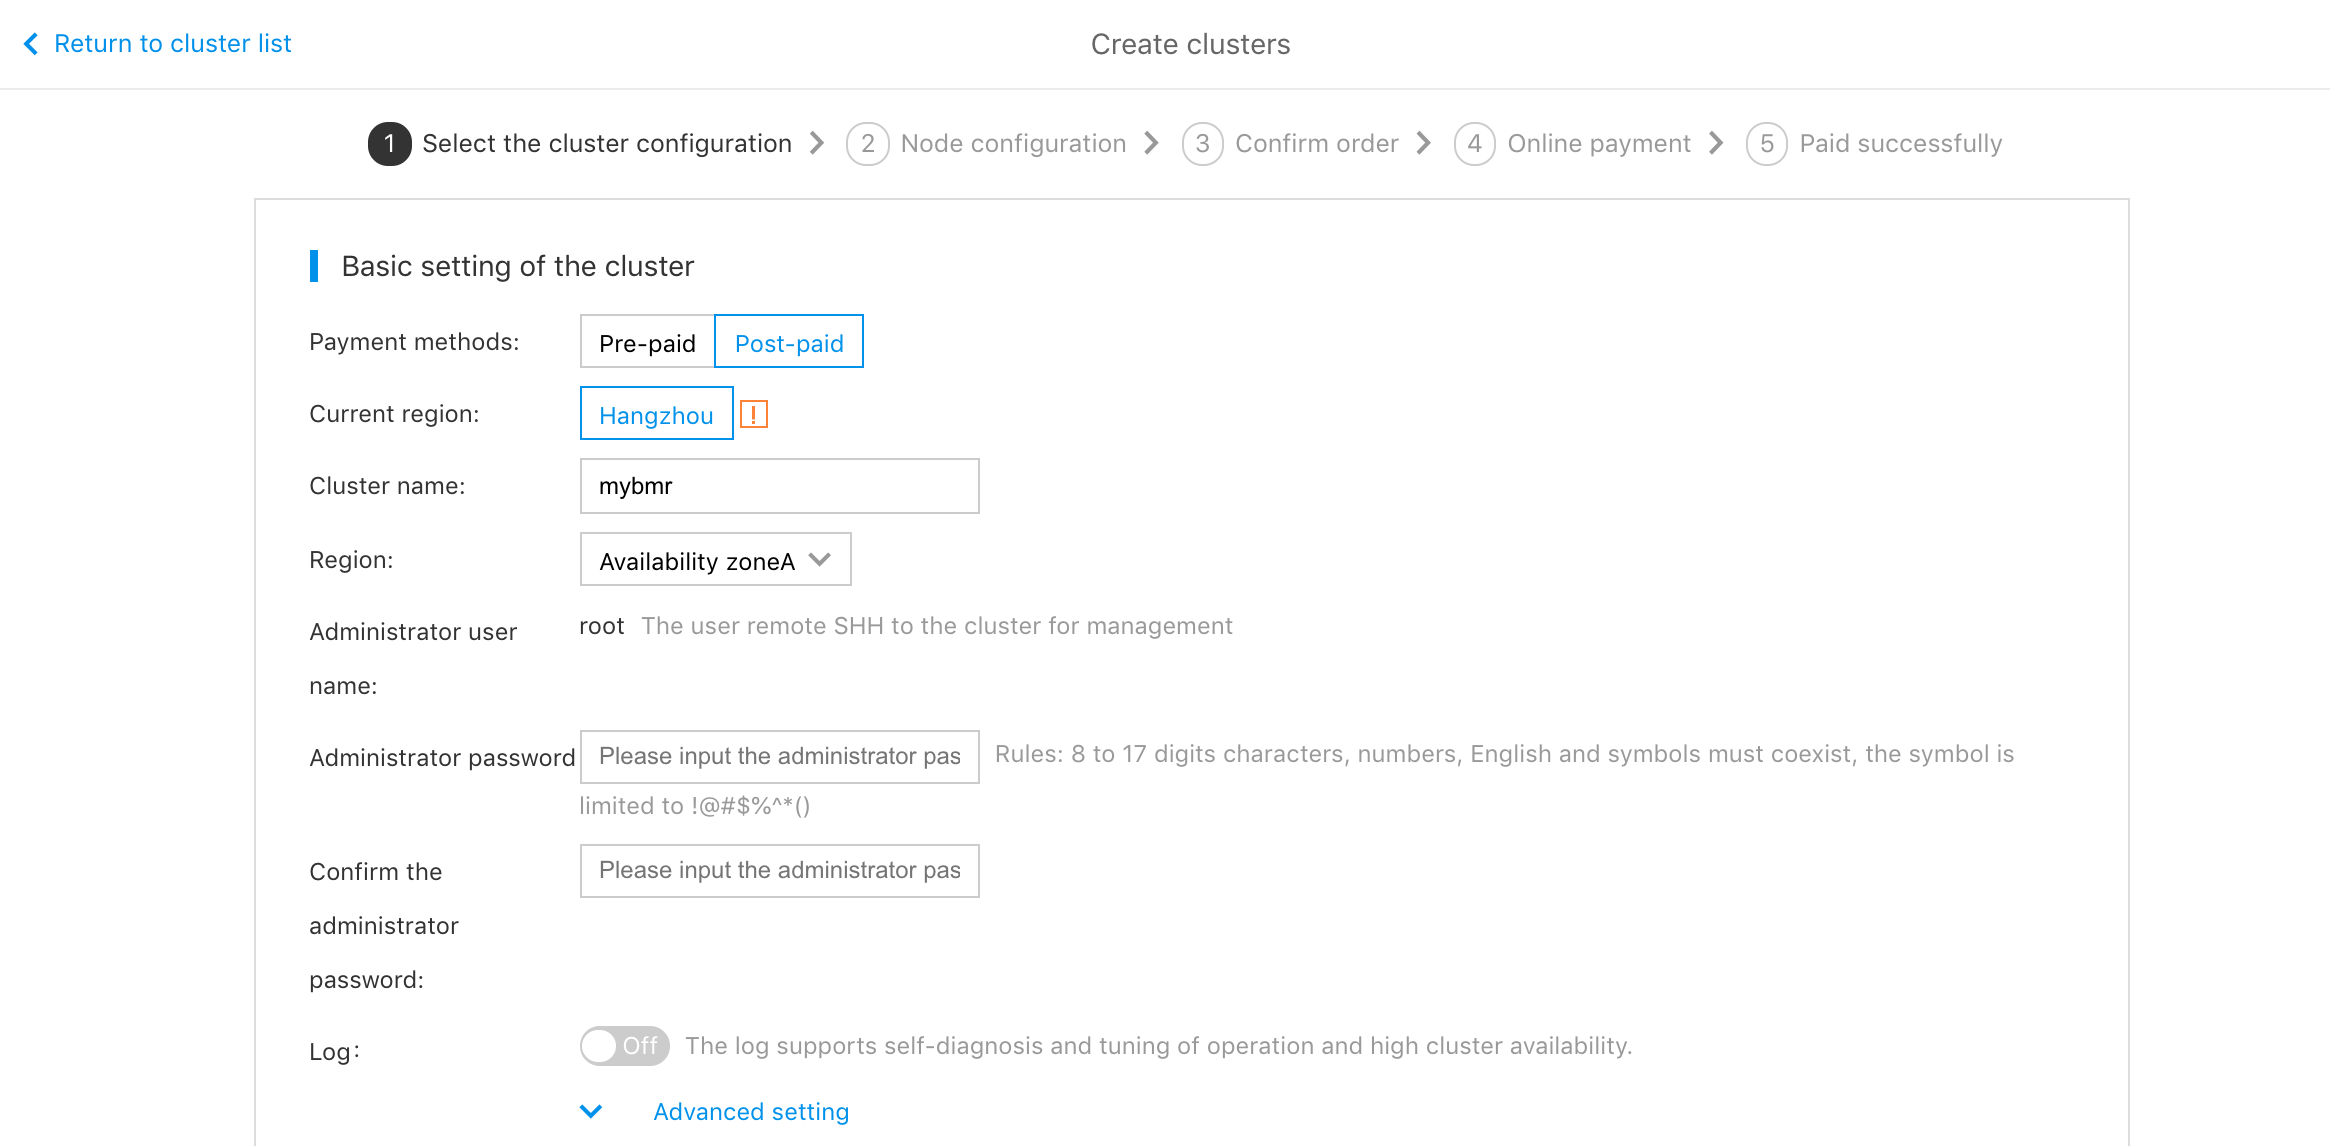
- In "Cluster Configuration" section, select image version BMR 1.0.0(hadoop 2.7), and select template “hadoop”.
- Keep other default setups, and click "Next Step" to save default setups. Click "Next Step" again to enter the order confirmation page.
- Click "Submit Order". After the order payment, the cluster is created within about ten minutes.
Access Hue Web Interface
- Open "Product Service>MapReduce>Baidu MapReduce-Cluster List", and click the created cluster to enter the instance details page.
- Click "Hue Web UI" in "Related Application" bar.
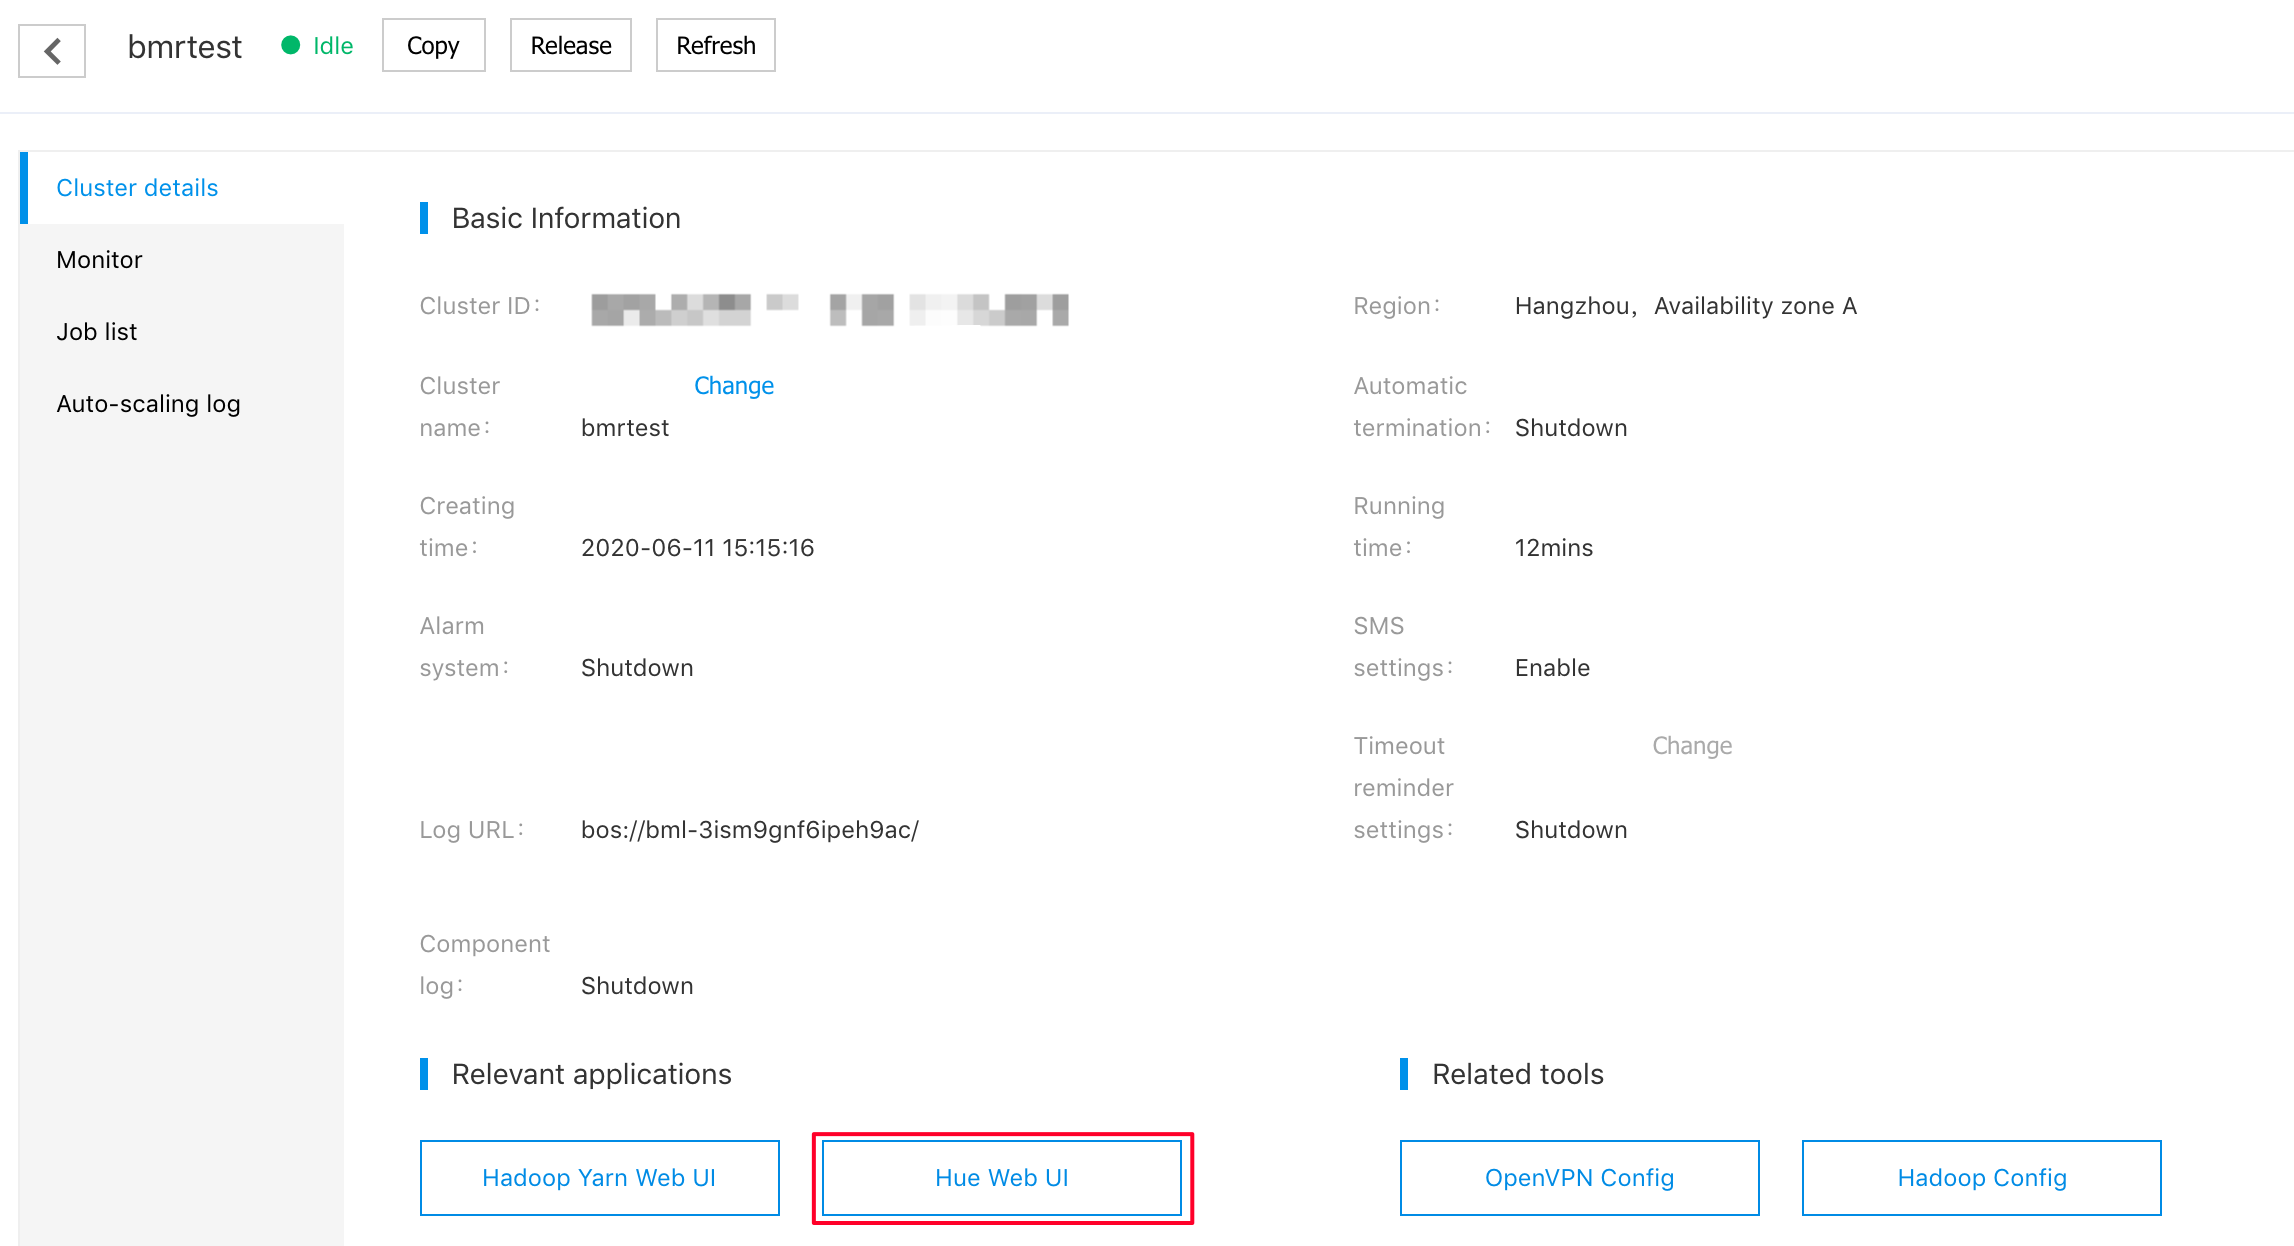
- After the authentication page pops up, enter the user name and password set during the creation of a cluster, and click "Login".
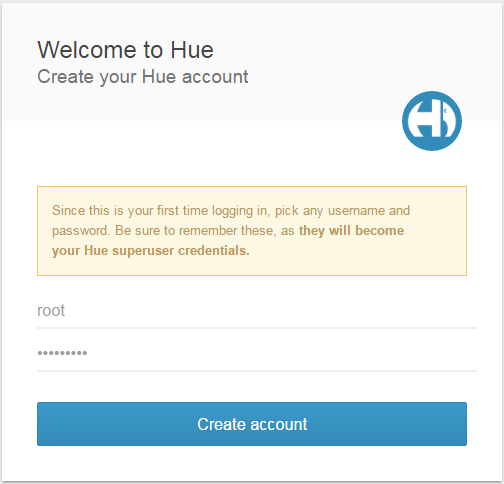
- Create and enter user name and password for logging in Hue service, and click "Create Account" to enter the Hue Web page.
Analyze Website Logs
Create Tables
-
Before analysis, you need to create a Hive table based on website logs. In the Hue menu bar, select "Query Editor>Hive", and enter the following SQL statement:
DROP TABLE IF EXISTS access_logs; CREATE EXTERNAL TABLE access_logs( remote_addr STRING comment 'client IP', time_local STRING comment 'access time', request STRING comment 'request URL', status STRING comment 'HTTP status', body_bytes_sent STRING comment 'size of response body', http_referer STRING comment 'referer', http_cookie STRING comment 'cookies', remote_user STRING comment 'client name', http_user_agent STRING comment 'client browser info', request_time STRING comment 'consumed time of handling request', host STRING comment 'server host', msec STRING comment 'consumed time of writing logs' ) COMMENT 'web access logs' ROW FORMAT SERDE 'org.apache.hadoop.hive.serde2.RegexSerDe' WITH SERDEPROPERTIES ( "input.regex" = "([0-9\\.]+) - \\[([^\\]]+)\\] \"([^\"]*)\" ([\\d]+) ([\\d]*) \"([^\"]*)\" \"([^\"]*)\" ([\\S]+) \"([^\"]*)\" ([0-9\\.]+) ([\\S]+) ([0-9\\.]+)" ) STORED AS TEXTFILE LOCATION "bos://datamart-bj/web-log-10k"; - After entering the statement, click the left triangular symbol to execute the command. In this way, Hive recreates an access_logs table and parses log files through regular expression.
-
After creating access_logs table, click the refresh button on the left of Hive Editor to find access_logs table and preview example data:

Query
You can query after defining the table.
-
For statistics of page request results, you can use the following statement:
SELECT status, count(1)
FROM access_logs
GROUP BY status
The query result can be switched to the chart page, and the data can be visualized in pie chart, as the following figure shows:

-
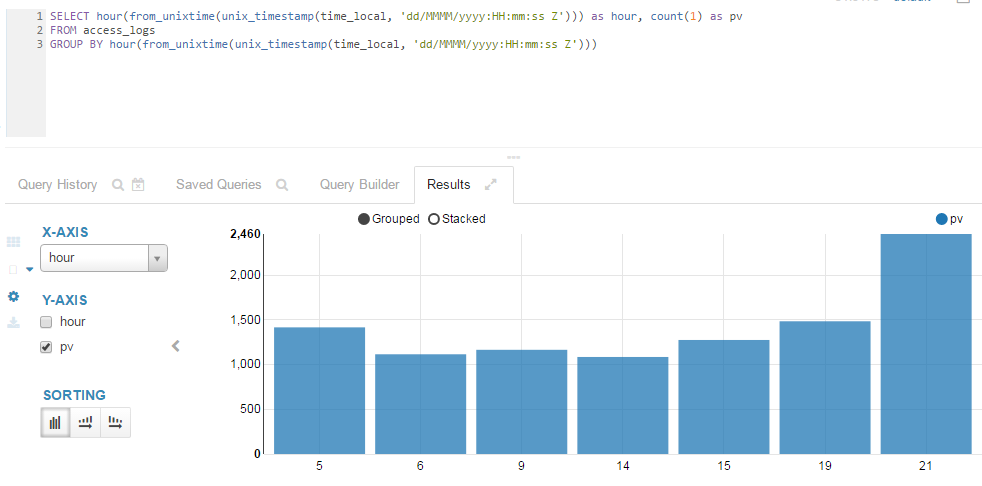
If you want to know which time frame has maximum page visits, you can use the following statement:
SELECT hour(from_unixtime(unix_timestamp(time_local, 'dd/MMMM/yyyy:HH:mm:ss Z'))) as hour, count(1) as pv
FROM access_logs
GROUP BY hour(from_unixtime(unix_timestamp(time_local, 'dd/MMMM/yyyy:HH:mm:ss Z')))
The query result can be switched to the chart page, and bar chart makes it more visual:
Analyze Results
The time point for maximum page visits is 21:00.