
Hue
Hue Introduction
The website log analysis is taken as an example to introduce Hue services, which the Web can access in this document. In the Web interface, the developer can use SQL statements to analyze massive logs. It dramatically reduces the usage constraints.
Hue provides a graphic interface system for Hadoop data analysis. You can use the browser to import, process, and analyze data on the Hadoop platform.
Create Clusters
- Prepare the data. For more information, please see Data Preparation.
- Prepare Baidu AI Cloud Environment.
-
Log in to the console, select "Product Service->Baidu MapReduce BMR", and click "Create Cluster" to enter the cluster creation page and configure the following:
- Set cluster name
- Set administrator password
- Disable log
- Select image version “BMR 1.0.0(hadoop 2.7)”
- Select the built-in template “hadoop”.
- Keep other default configurations of the cluster, and click "Submit Order". After paying for the order, you can view the created cluster in the cluster list page. The cluster is created successfully when cluster status changes from "Initializing" to "Waiting".
Hue Usage
Log in to Hue Web Interface
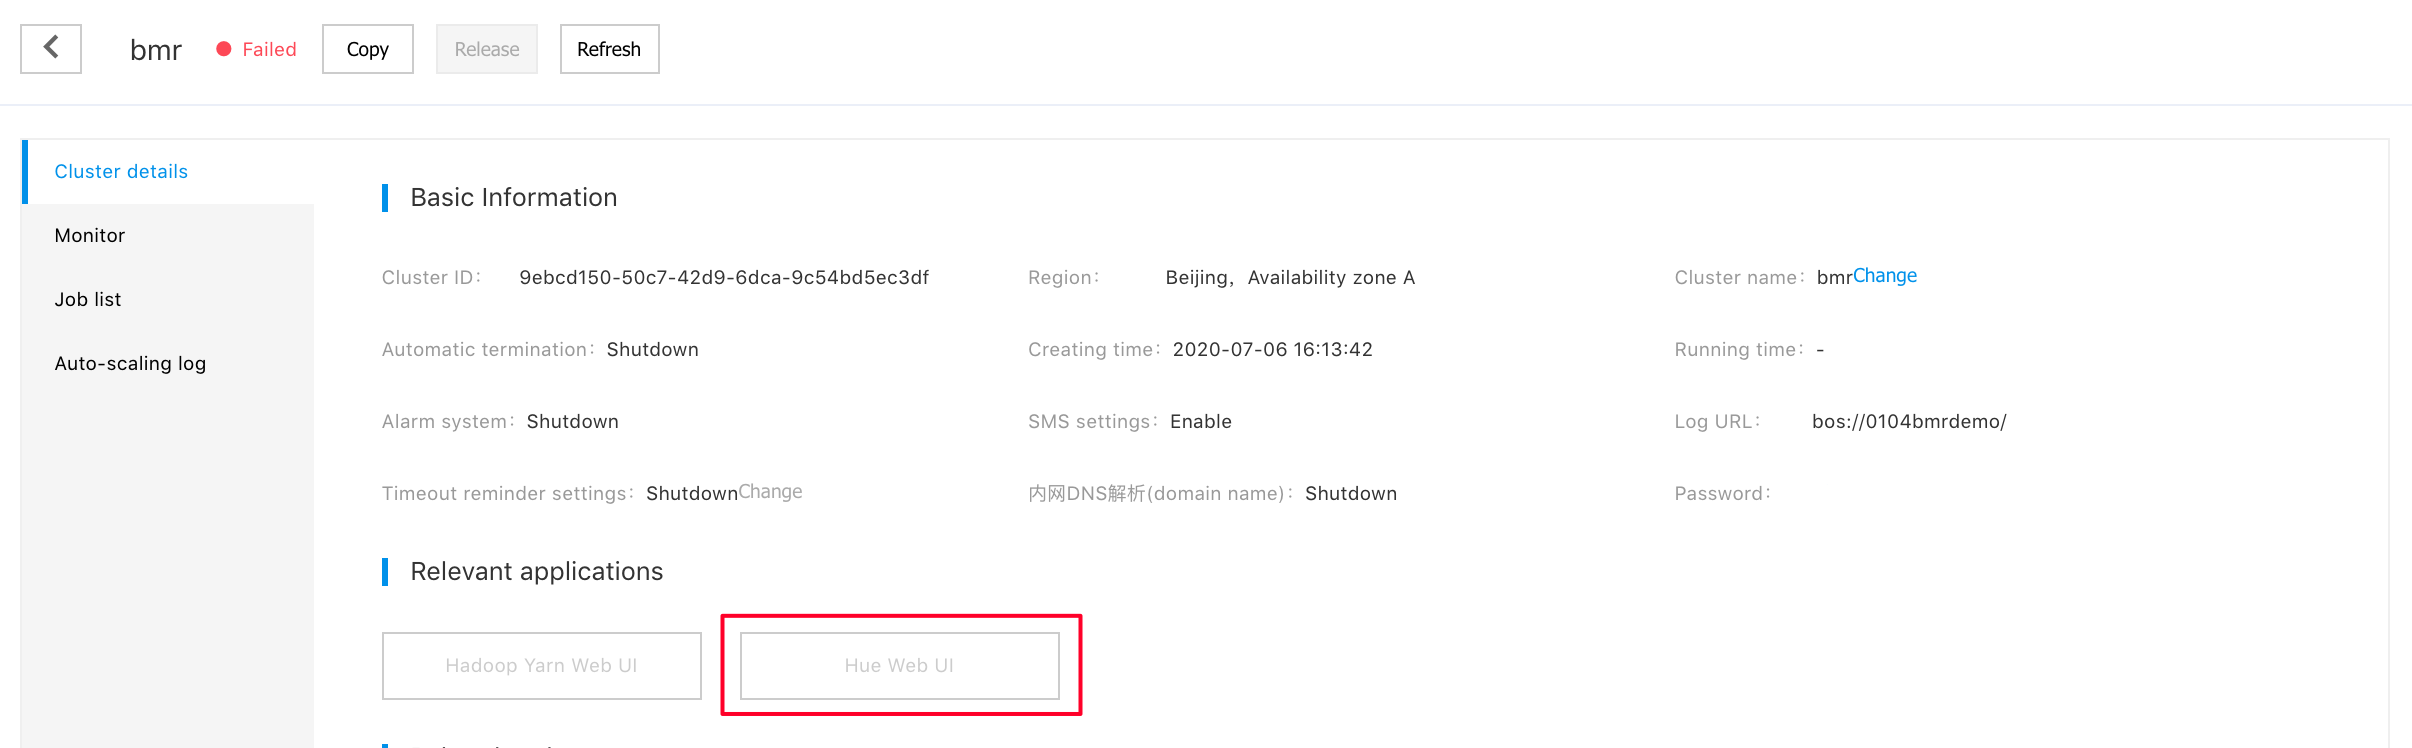
- Log in to the console, select "Product Service->Baidu MapReduce BMR", and click the created cluster to enter the cluster details page.
- Click "Hue Web UI" in "Related Application" bar.
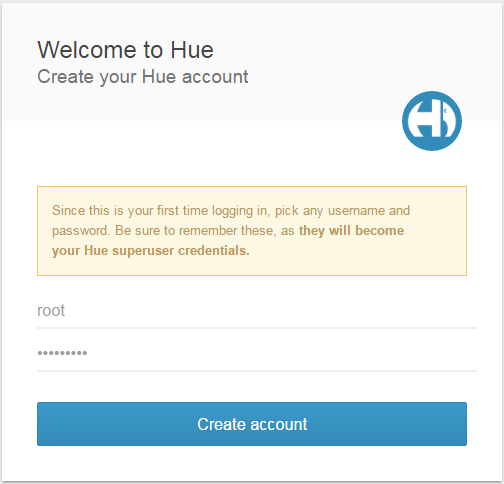
- After the authentication page pops up, enter the user name and password set during the creation of cluster and click "Login".
- Create and enter user name and password for logging in to Hue service, and click "Create Account" to enter the Hue Web interface.
Create Tables
- Before analysis, you need to create a Hive table based on website logs. In the Hue menu bar, select "Query Editors>Hive", and enter the following SQL statement:
sql  DROP TABLE IF EXISTS access_logs;
   CREATE EXTERNAL TABLE access_logs(
       remote_addr STRING comment 'client IP',
       time_local STRING comment 'access time',
   request STRING comment 'request URL',
   status STRING comment 'HTTP status',
   body_bytes_sent STRING comment 'size of response body',
   http_referer STRING comment 'referer',
   http_cookie STRING comment 'cookies',
   remote_user STRING comment 'client name',
   http_user_agent STRING comment 'client browser info',
   request_time STRING comment 'consumed time of handling request',
   host STRING comment 'server host',
   msec STRING comment 'consumed time of writing logs'
   )
   COMMENT 'web access logs'
   ROW FORMAT SERDE 'org.apache.hadoop.hive.serde2.RegexSerDe'
   WITH SERDEPROPERTIES (
   "input.regex" = "([0-9\.]+) - \\[([^\\]]+)\\] \"([^\"]*)\" ([\\d]+) ([\\d]*) \"([^\"]*)\" \"([^\"]*)\" ([\\S]+) \"([^\"]*)\" ([0-9\.]+) ([\\S]+) ([0-9\.]+)"
   )
   STORED AS TEXTFILE
LOCATION "bos://datamart-bj/web-log-10k";- After entering the statement, click the execution button. In this way, Hive recreates an access_logs table and parses log files through regular expression.
- After creating access_logs table, click the refresh button on the left "Table" bar to find access_logs and preview example data:

Query
You can query after defining the table.
-
For statistics of page request results, you can use the following statement:
        SELECT status, count(1)
        FROM access_logs
        GROUP BY status
The query result can be switched to the chart page, and the data can be visualized in pie chart, as the following figure shows:

-
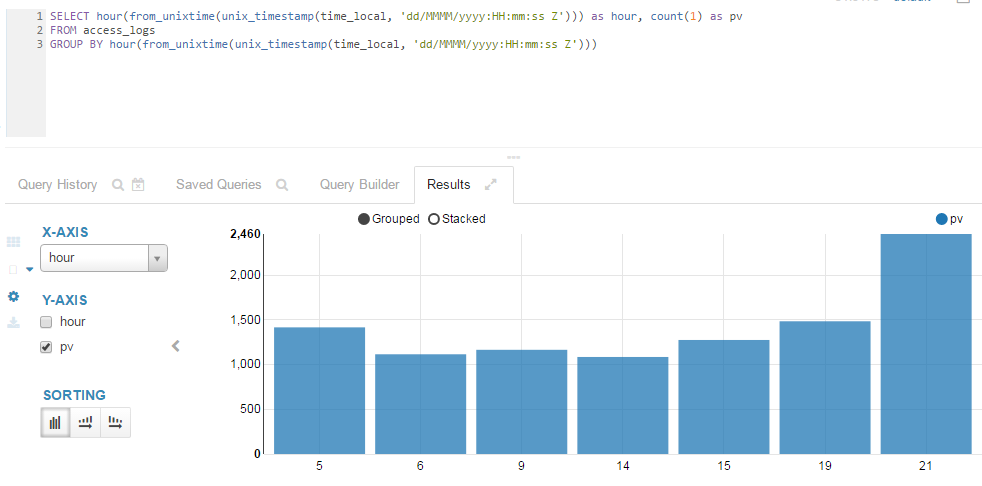
If you want to know which time frame has maximum page visits, you can use the following statement:
  SELECT hour(from_unixtime(unix_timestamp(time_local, 'dd/MMMM/yyyy:HH:mm:ss Z'))) as hour, count(1) as pv
  FROM access_logs
  GROUP BY hour(from_unixtime(unix_timestamp(time_local, 'dd/MMMM/yyyy:HH:mm:ss Z')))
The query result can be switched to the chart page, and bar chart makes it more visual:
In Baidu AI Cloud, Hue can be used to access Hive and easily make a visual map. As the following figure shows, the user map is generated based on log information. For more information, please contact bce@baidu.com.