Management Dashboard Charts

BCM

  • Function Release Records
  • Product Announcement
    • Site Monitor Billing Announcement
  • Product Description
    • Product Introduction
    • Core concepts
    • Product advantages
    • Product features
  • Product pricing
    • Product pricing
    • Site Monitor Pricing
  • Quick Start
  • Operation guide
    • Enter Cloud Monitor
    • Dashboard
      • Overview
      • Management Dashboard Charts
      • Management Dashboard
    • Alarm Service
      • Overview
      • Alarm strategy
      • Alarm history
      • Alarm Template
      • Alarm Notification Template
      • Alarm callback
    • Cloud product monitor
      • Instance monitor
      • Instance Group
      • View Metrics
    • Site Monitor
      • Timed Detection (Formerly Site Monitor)
        • Overview
        • Manage Timed Probe Tasks
        • Purchase Guide
        • View timed probe tasks
      • IP advanced fault diagnosis
        • Manage IP Advanced Fault Diagnosis Tasks
        • View IP Advanced Fault Diagnosis Tasks
      • Instant probe
        • Overview
        • Manage instant probe tasks
    • Event Monitor
    • Event Bus
      • Event Delivery History
      • Overview
      • Event summary
      • Event Set
      • Event Rules
        • Event Rules
        • Event content conversion
        • Event pattern
  • API Reference
    • Overview
    • Service domain
    • Error response
    • Query Monitoring Data for Partial Dimensions
    • Dashboard API
    • Common Request and Response Headers
    • Alarm Management API
    • Alarm Management Interface V2
    • Alarm history
    • Push Data API
    • Event Bus Push
    • Application Monitor
    • Dimension Value TopN and Monitoring Data Query Interface
    • Batch Query Monitoring Data Interface V2
    • Dimension Value TopN Query Interface
    • Instance Group Interface
    • Site Monitor
    • Query Latest Metric Data for Partial Dimensions
    • General Description
    • Query Data API
    • Event Monitor
    • Instant Probe
    • Event Alarm History
    • Notification Template
  • Java-SDK
    • Overview
    • Initialization
    • Install the SDK Package
    • BcmClient
    • Query Monitoring Data for Partial Dimensions
    • Dimension Value TopN and Monitoring Data Query Interface
    • Batch Query Monitoring Data Interface V2
    • Dimension Value TopN Query Interface
    • Query Latest Metric Data for Partial Dimensions
    • Query Data API
    • Alarm Strategy-related APIs
    • Batch Query Data Interface
    • Alarm History-related APIs
  • Python-SDK
    • Overview
    • Initialization
    • Install SDK
    • BcmClient
    • Query Monitoring Data for Partial Dimensions
    • Batch Query Monitoring Data Interface V2
    • Dimension Value TopN Query Interface
    • Query Latest Metric Data for Partial Dimensions
    • Query Data API
    • Alarm Strategy List API
    • Batch Data Query Interface
  • Go-SDK
    • Overview
    • Initialization
    • Install the SDK Package
    • BcmClient
    • Query Monitoring Data for Partial Dimensions
    • Dimension Value TopN and Monitoring Data Query Interface
    • Batch Query Monitoring Data Interface V2
    • Dimension Value TopN Query Interface
    • Query Latest Metric Data for Partial Dimensions
    • Query Data API
    • Alarm Strategy-related APIs
    • Alarm History-related APIs
    • Batch Data Query Interface
  • BCM-Agent
    • Functions
    • Monitoring Trend Chart
    • BCM-Agent-Frequently Asked Questions
    • Appendix
  • FAQs
    • Common Questions Overview
    • Fault-related questions
    • Configuration-related questions
    • Performance-related questions
  • Cloud Product Monitor List
    • Cloud Product Metric List (Legacy Version Hidden)
    • Cloud Product Monitor Object Type List
    • Cloud Product Event List
    • Cloud Product Metric List
      • Database
        • Cloud Database TableStorage
        • Cloud Database DocDB for MongoDB
        • Data transmission service (DTS)
        • Cloud native database GaiaDB
        • Vector Database (VectorDB)
        • Dedicated Database Cluster (DDC)
        • Cloud Database Redis
        • Cloud database RDS
        • Cloud Database HBase
      • Enterprise Application
        • Message Service for RabbitMQ
      • Network
        • Service Network Interface Card (SNIC)
        • Peering Connections
        • IPv6 gateway
        • NAT Gateway
        • Load Balancer Dedicated Cluster LBDC
        • Baidu Load Balance (BLB)
        • Network probe NP
        • Dedicated channel
        • Elastic IP EIP
        • Elastic Network Interface Card (ENIC)
        • Cloud Smart Network (CSN)
        • Dedicated gateway
        • Virtual Private Network (VPN) Gateway
        • Layer 2 Gateway LTGW
        • Physical dedicated line
      • Intelligent Big Data
        • MapReduce BMR
        • Message service for Kafka-dedicated
        • Message Service for RocketMQ
        • Baidu Stream Computing (BSC)
        • Baidu Elasticsearch
        • Log Service BLS
        • Data warehouse DORIS
      • Cloud native
        • Cloud Function Computing
        • Baidu container instance (BCI)
      • Compute
        • Baidu Cloud Compute (BCC)
        • Elastic Baremetal Compute BBC
      • Storage and CDN
        • Parallel Filesystem Service (PFS)
        • Cloud File System (CFS)
        • Content delivery network (CDN)
        • Baidu object storage (BOS)
        • Cloud Disk Server (CDS)
        • Baidu edge computing (BEC)
      • Website service
        • Baidu Cloud Virtual Host (BCH)
      • Large Model Platform
        • Qianfan Large Model Platform ModelBuilder
  • Typical Practices
    • Scenarios for Batch Creation of Alarm Strategies
    • Usage Scenarios for Different Notification Channels
  • Service Level Agreement (SLA)
    • Site Monitor Service Level Agreement SLA
  • BCM-Tool
    • Uninstallation Method
    • Installation method
    • BCM-Tool-Frequently Asked Questions
    • Functions
    • Multi-Region Service
    • Application method
All documents
menu
No results found, please re-enter

BCM

  • Function Release Records
  • Product Announcement
    • Site Monitor Billing Announcement
  • Product Description
    • Product Introduction
    • Core concepts
    • Product advantages
    • Product features
  • Product pricing
    • Product pricing
    • Site Monitor Pricing
  • Quick Start
  • Operation guide
    • Enter Cloud Monitor
    • Dashboard
      • Overview
      • Management Dashboard Charts
      • Management Dashboard
    • Alarm Service
      • Overview
      • Alarm strategy
      • Alarm history
      • Alarm Template
      • Alarm Notification Template
      • Alarm callback
    • Cloud product monitor
      • Instance monitor
      • Instance Group
      • View Metrics
    • Site Monitor
      • Timed Detection (Formerly Site Monitor)
        • Overview
        • Manage Timed Probe Tasks
        • Purchase Guide
        • View timed probe tasks
      • IP advanced fault diagnosis
        • Manage IP Advanced Fault Diagnosis Tasks
        • View IP Advanced Fault Diagnosis Tasks
      • Instant probe
        • Overview
        • Manage instant probe tasks
    • Event Monitor
    • Event Bus
      • Event Delivery History
      • Overview
      • Event summary
      • Event Set
      • Event Rules
        • Event Rules
        • Event content conversion
        • Event pattern
  • API Reference
    • Overview
    • Service domain
    • Error response
    • Query Monitoring Data for Partial Dimensions
    • Dashboard API
    • Common Request and Response Headers
    • Alarm Management API
    • Alarm Management Interface V2
    • Alarm history
    • Push Data API
    • Event Bus Push
    • Application Monitor
    • Dimension Value TopN and Monitoring Data Query Interface
    • Batch Query Monitoring Data Interface V2
    • Dimension Value TopN Query Interface
    • Instance Group Interface
    • Site Monitor
    • Query Latest Metric Data for Partial Dimensions
    • General Description
    • Query Data API
    • Event Monitor
    • Instant Probe
    • Event Alarm History
    • Notification Template
  • Java-SDK
    • Overview
    • Initialization
    • Install the SDK Package
    • BcmClient
    • Query Monitoring Data for Partial Dimensions
    • Dimension Value TopN and Monitoring Data Query Interface
    • Batch Query Monitoring Data Interface V2
    • Dimension Value TopN Query Interface
    • Query Latest Metric Data for Partial Dimensions
    • Query Data API
    • Alarm Strategy-related APIs
    • Batch Query Data Interface
    • Alarm History-related APIs
  • Python-SDK
    • Overview
    • Initialization
    • Install SDK
    • BcmClient
    • Query Monitoring Data for Partial Dimensions
    • Batch Query Monitoring Data Interface V2
    • Dimension Value TopN Query Interface
    • Query Latest Metric Data for Partial Dimensions
    • Query Data API
    • Alarm Strategy List API
    • Batch Data Query Interface
  • Go-SDK
    • Overview
    • Initialization
    • Install the SDK Package
    • BcmClient
    • Query Monitoring Data for Partial Dimensions
    • Dimension Value TopN and Monitoring Data Query Interface
    • Batch Query Monitoring Data Interface V2
    • Dimension Value TopN Query Interface
    • Query Latest Metric Data for Partial Dimensions
    • Query Data API
    • Alarm Strategy-related APIs
    • Alarm History-related APIs
    • Batch Data Query Interface
  • BCM-Agent
    • Functions
    • Monitoring Trend Chart
    • BCM-Agent-Frequently Asked Questions
    • Appendix
  • FAQs
    • Common Questions Overview
    • Fault-related questions
    • Configuration-related questions
    • Performance-related questions
  • Cloud Product Monitor List
    • Cloud Product Metric List (Legacy Version Hidden)
    • Cloud Product Monitor Object Type List
    • Cloud Product Event List
    • Cloud Product Metric List
      • Database
        • Cloud Database TableStorage
        • Cloud Database DocDB for MongoDB
        • Data transmission service (DTS)
        • Cloud native database GaiaDB
        • Vector Database (VectorDB)
        • Dedicated Database Cluster (DDC)
        • Cloud Database Redis
        • Cloud database RDS
        • Cloud Database HBase
      • Enterprise Application
        • Message Service for RabbitMQ
      • Network
        • Service Network Interface Card (SNIC)
        • Peering Connections
        • IPv6 gateway
        • NAT Gateway
        • Load Balancer Dedicated Cluster LBDC
        • Baidu Load Balance (BLB)
        • Network probe NP
        • Dedicated channel
        • Elastic IP EIP
        • Elastic Network Interface Card (ENIC)
        • Cloud Smart Network (CSN)
        • Dedicated gateway
        • Virtual Private Network (VPN) Gateway
        • Layer 2 Gateway LTGW
        • Physical dedicated line
      • Intelligent Big Data
        • MapReduce BMR
        • Message service for Kafka-dedicated
        • Message Service for RocketMQ
        • Baidu Stream Computing (BSC)
        • Baidu Elasticsearch
        • Log Service BLS
        • Data warehouse DORIS
      • Cloud native
        • Cloud Function Computing
        • Baidu container instance (BCI)
      • Compute
        • Baidu Cloud Compute (BCC)
        • Elastic Baremetal Compute BBC
      • Storage and CDN
        • Parallel Filesystem Service (PFS)
        • Cloud File System (CFS)
        • Content delivery network (CDN)
        • Baidu object storage (BOS)
        • Cloud Disk Server (CDS)
        • Baidu edge computing (BEC)
      • Website service
        • Baidu Cloud Virtual Host (BCH)
      • Large Model Platform
        • Qianfan Large Model Platform ModelBuilder
  • Typical Practices
    • Scenarios for Batch Creation of Alarm Strategies
    • Usage Scenarios for Different Notification Channels
  • Service Level Agreement (SLA)
    • Site Monitor Service Level Agreement SLA
  • BCM-Tool
    • Uninstallation Method
    • Installation method
    • BCM-Tool-Frequently Asked Questions
    • Functions
    • Multi-Region Service
    • Application method
  • Document center
  • arrow
  • BCM
  • arrow
  • Operation guide
  • arrow
  • Dashboard
  • arrow
  • Management Dashboard Charts
Table of contents on this page
  • Basic concepts
  • Create dashboard and charts
  • New chart group
  • New chart
  • View chart
  • Set the dashboard time range
  • Enable real-time data refresh
  • Open advanced details
  • Edit/copy/delete chart
  • Move chart

Management Dashboard Charts

Updated at:2025-11-03

Basic concepts

Term Description
Monitor type Currently supports monitoring for cloud products, applications, custom metrics, and other types.
Statistic Method Configure data analysis methods, including average, sum, maximum, minimum, and count.
Comparison based on time period Compare and display monitoring data from custom time periods alongside current monitoring data.
Chart Type Trend chart, table, dashboard chart, data panel, embedded Website
Types Choose the display type for the trend chart: line chart, bar chart, stacked bar chart, area chart, or stacked area chart.
Decimal places Allows custom configuration for the number of decimal places to display.
Unit Displays the unit of the selected metric; if a unit is not predefined, custom units can be specified.
Null value processing Define how to handle null values in the data. Trend charts support displaying as 0, connecting points, or leaving breakpoints.
Threshold
  • For trend charts, set numerical threshold lines to help users observe metrics more effectively.
  • In dashboard charts, configure different colors to indicate various thresholds.
  • Time Range Set how chart time corresponds to the dashboard's timeline. The dashboard offers three methods for chart time selection:
  • Dashboard time range linkage: The chart time automatically adjusts to match the dashboard's range.
  • Relative time range: Customize a relative time range, such as today, this week, this month, or a user-defined recent period. When the dashboard's range changes, the end time aligns with the dashboard, recalculating the chart time as needed.
  • Absolute time range: Define a fixed time span, specifying an exact start and end. This period remains unaffected by changes to the dashboard's time range.
  • Create dashboard and charts

    New chart group

    1. Select "Dashboard" from the left navigation bar to enter the Dashboard List page.
    2. Click on the dashboard name to navigate to its details page.
    3. In the dashboard details page, click the Chart Group button in the upper right to create a new chart group. Redirect to the configuration chart page by clicking the new chart group
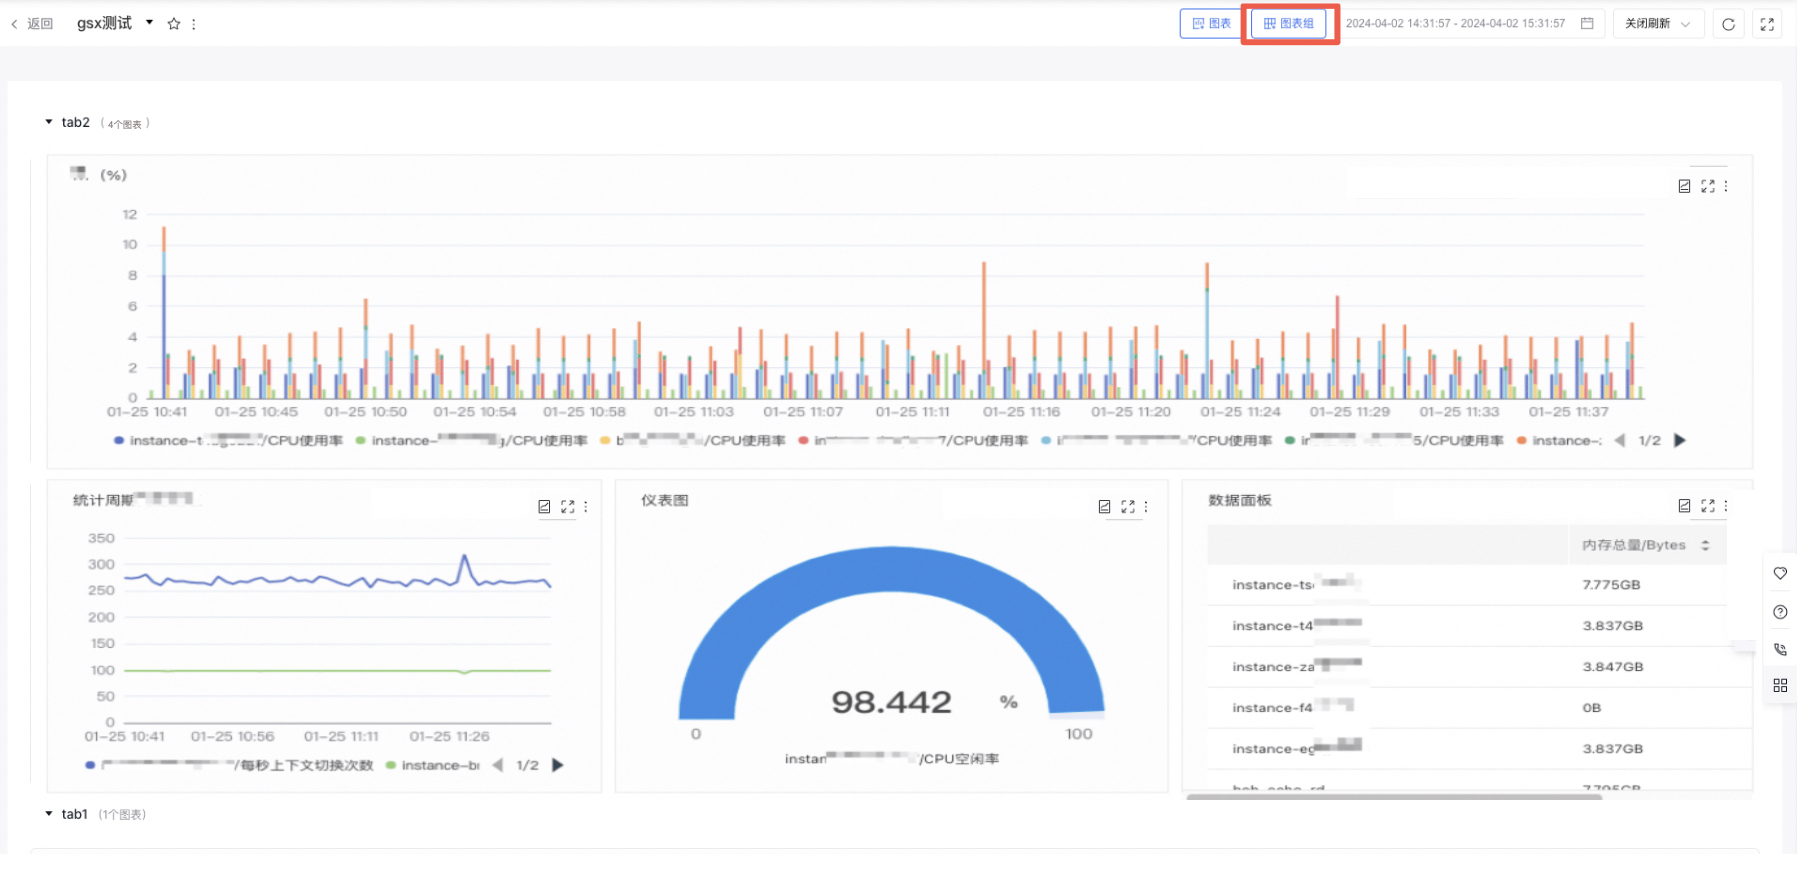
    image.png

    1. Hover over a chart group to enable editing or deletion operations; hold and drag the chart group to sort them
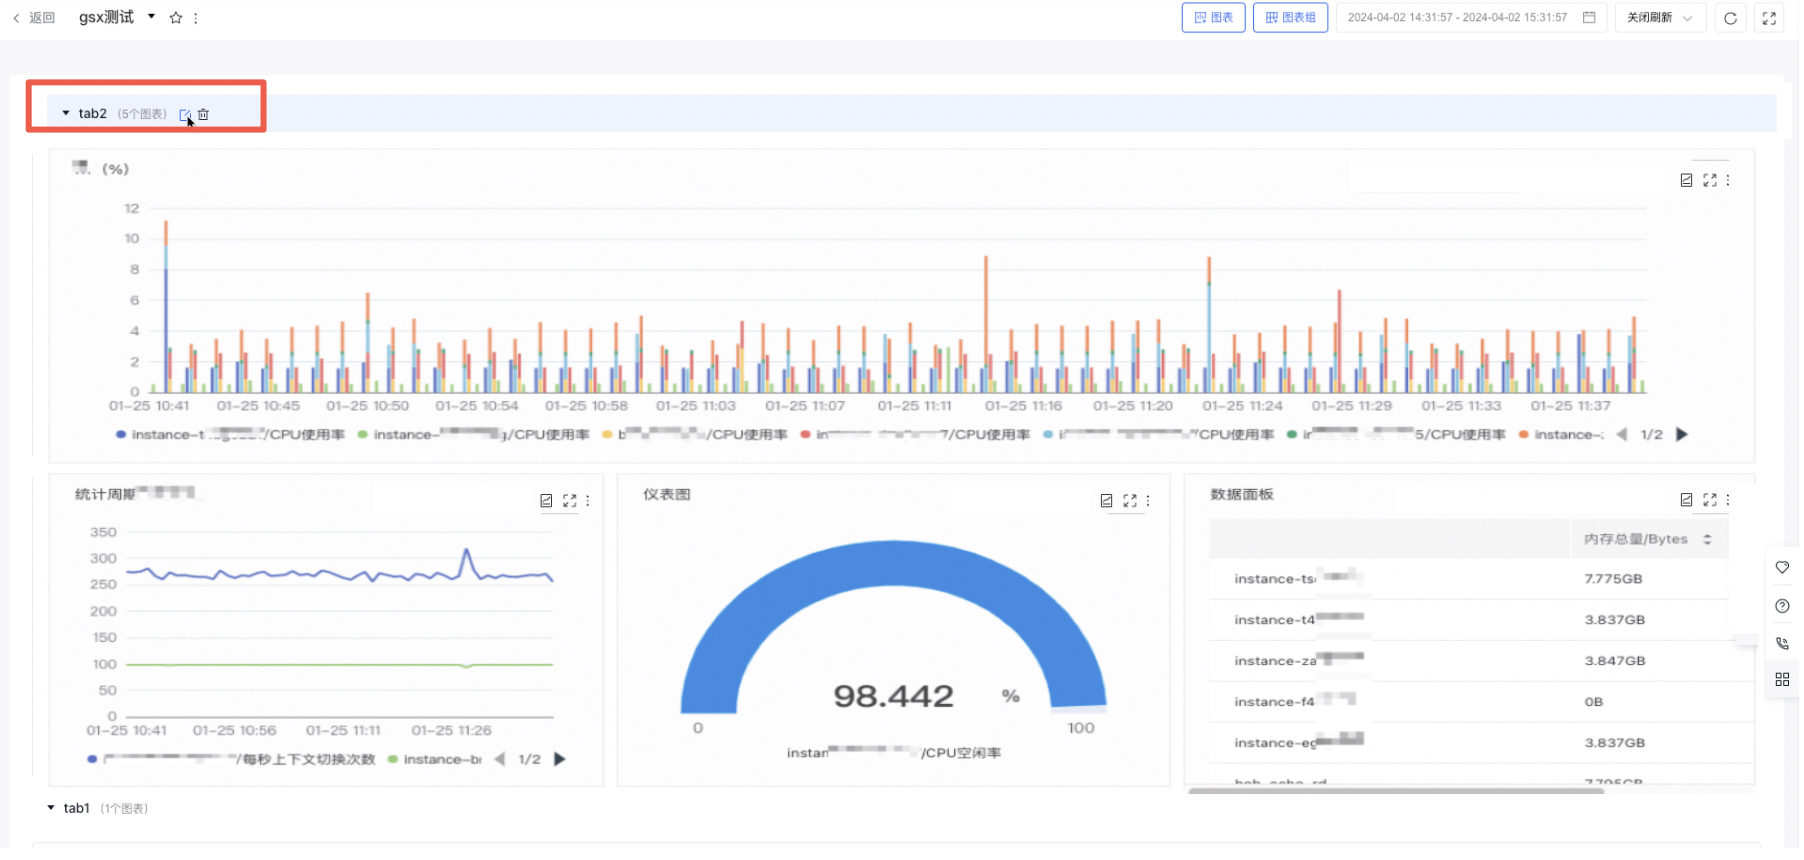
    image.png

    New chart

    1. Select "Dashboard" from the left navigation bar to enter the Dashboard List page.
    2. Click on the dashboard name to navigate to its details page.
    3. In the dashboard details page, click the Chart button in the upper right to create a new chart. Redirect to the configuration chart page by clicking the new chart
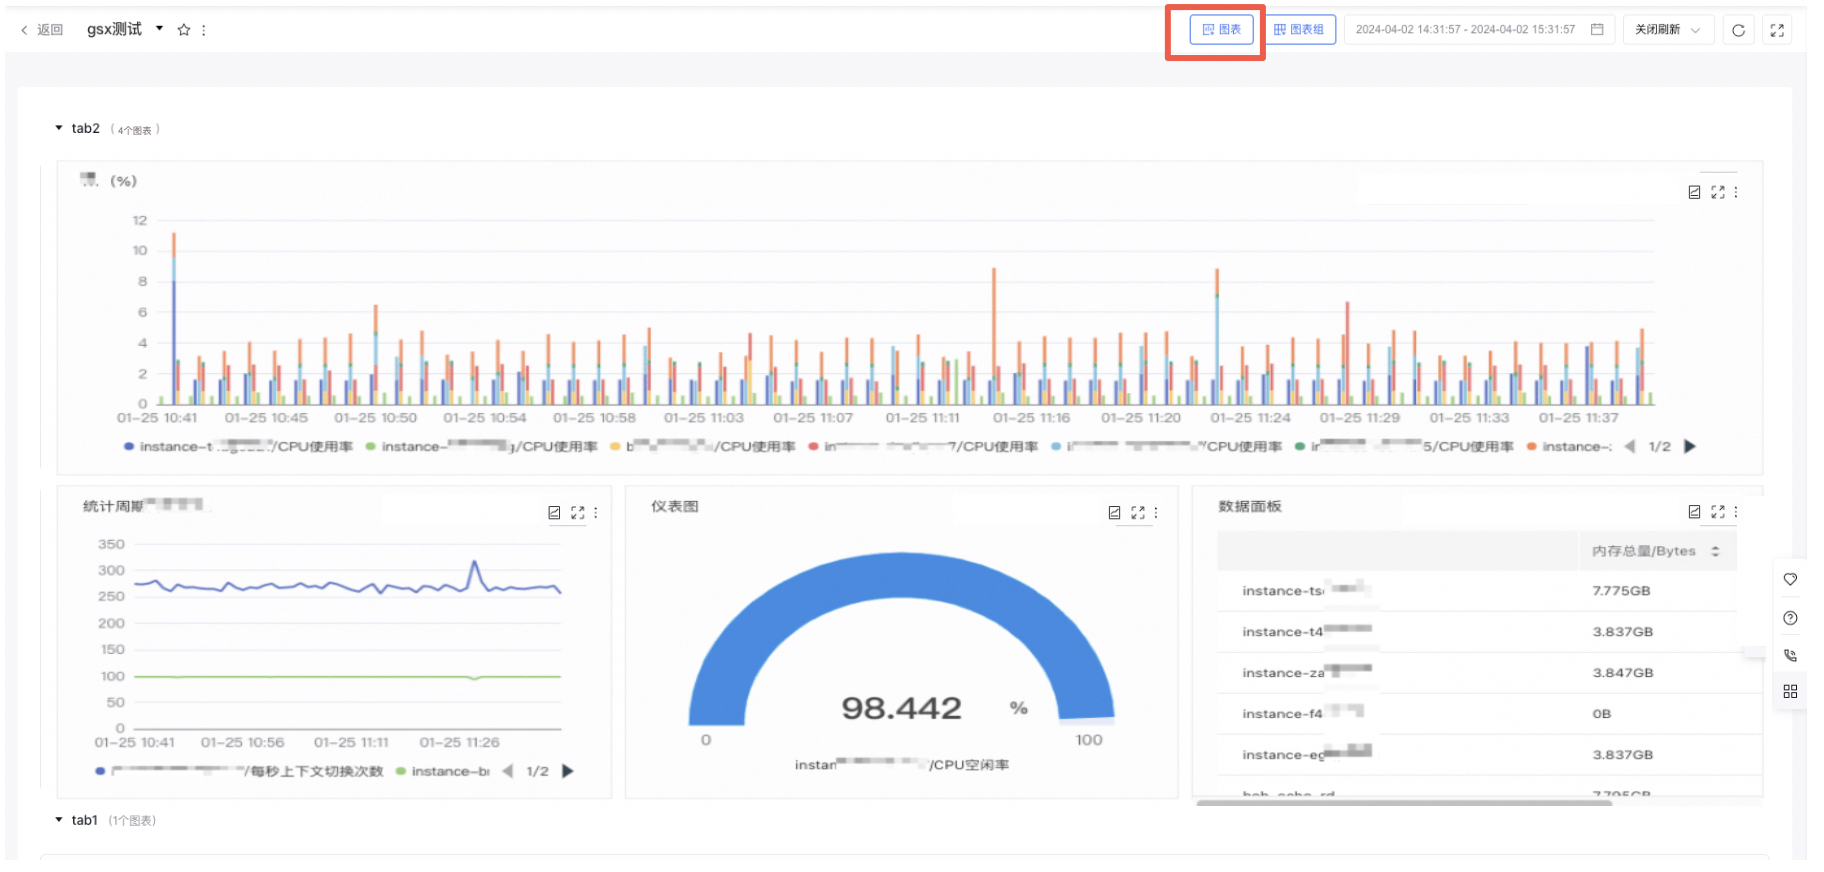
    image.png

    1. Choose the chart type and fill out the related form information.
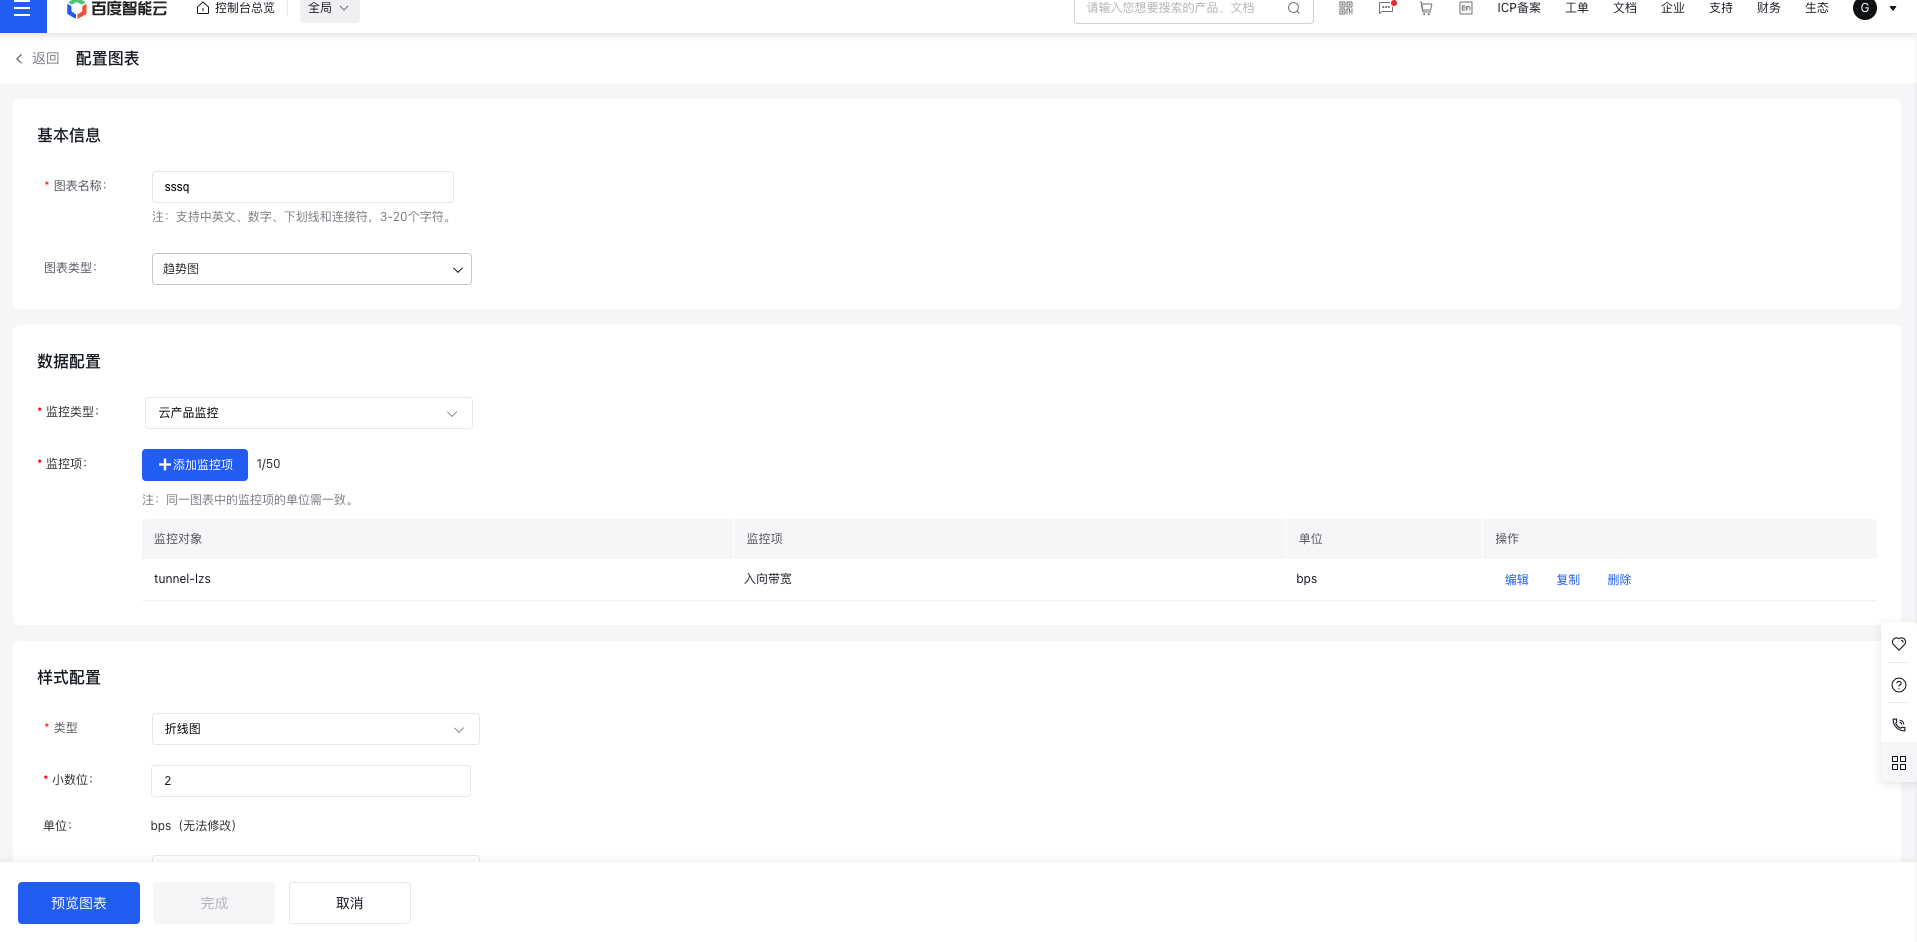
    image.png

    • Trend Chart

    (1) Click the "Add Monitor Object" button to open the corresponding pop-up window.

    (2) Select the instances you want to display and click "Confirm" to successfully add them.
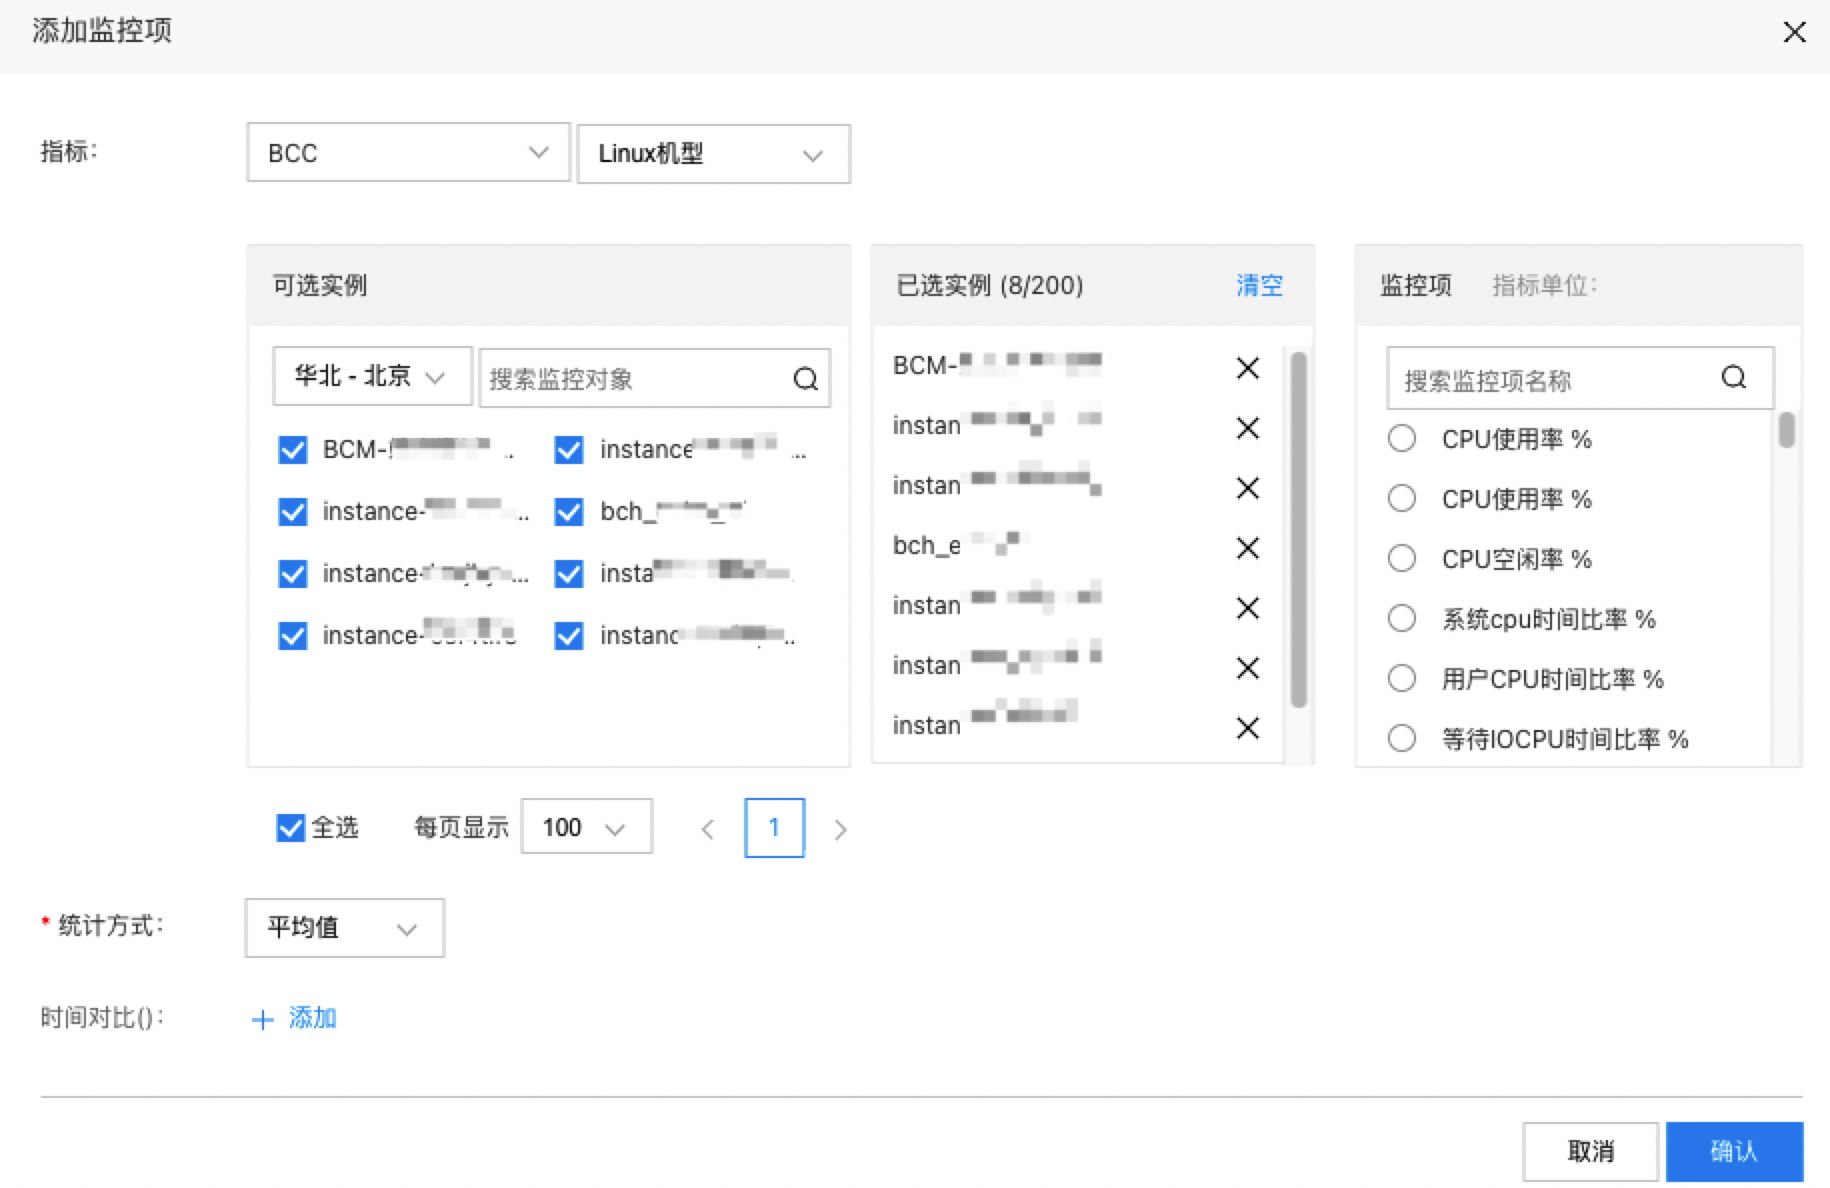
    image.png

    Description:

    • You can select all instances, with a limit of 200 instances per chart.
    • Each chart only supports metrics that share the same unit.
    • Table

    (1) Click the Add Monitor Object button to open the Add Monitor Object pop-up window.

    (2) Select the instances you want to display and click "Confirm" to successfully add them.
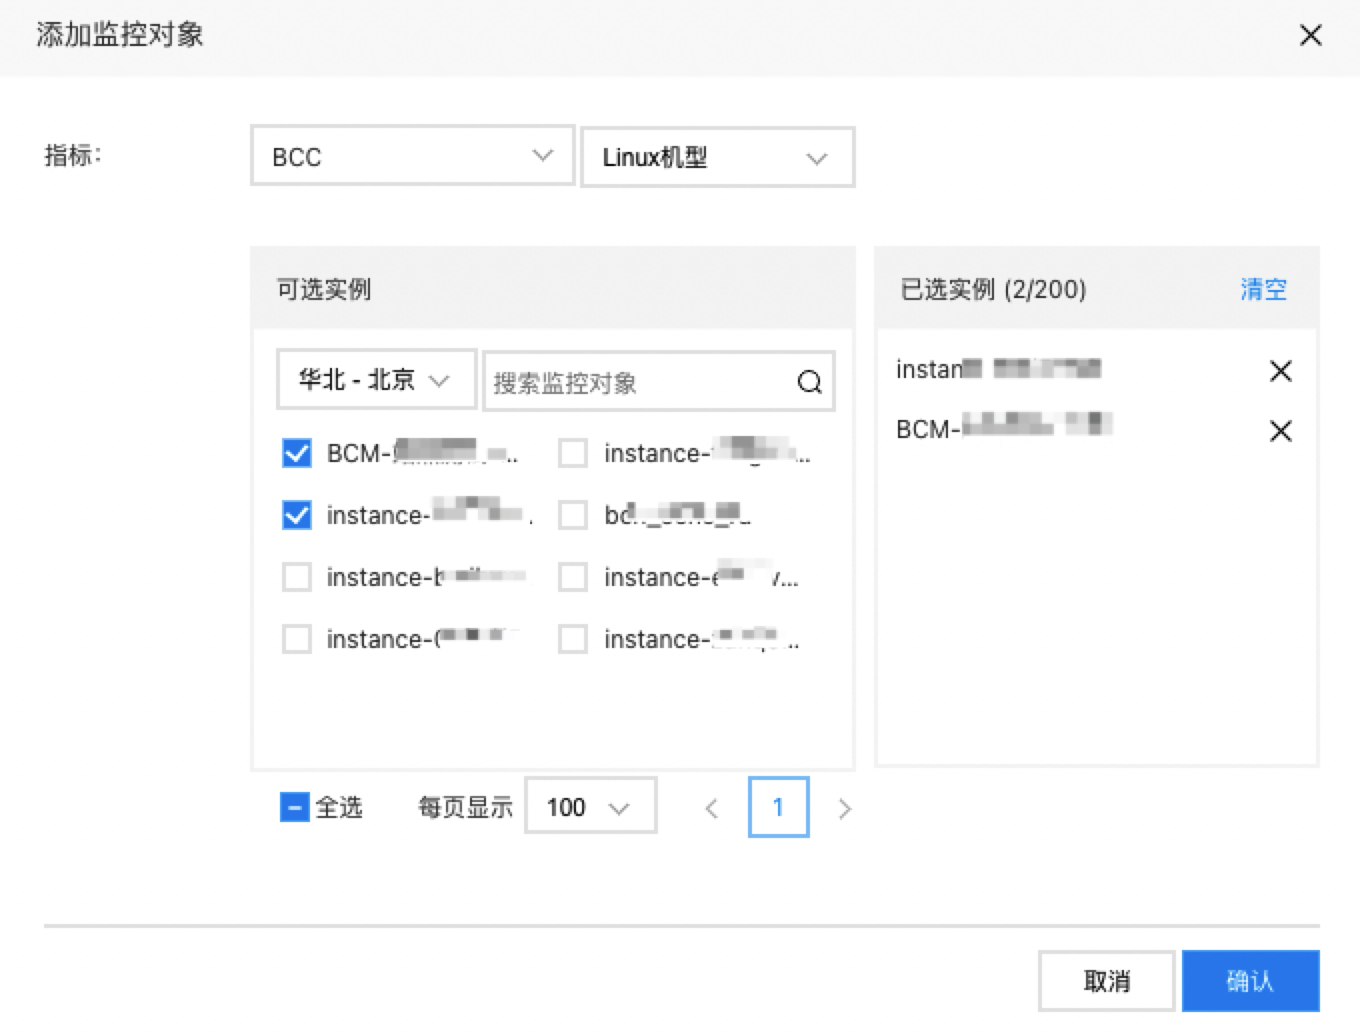
    image.png

    (3) Click "Add Metric," choose the metrics you want to display, and then click "Confirm" to finalize the addition.
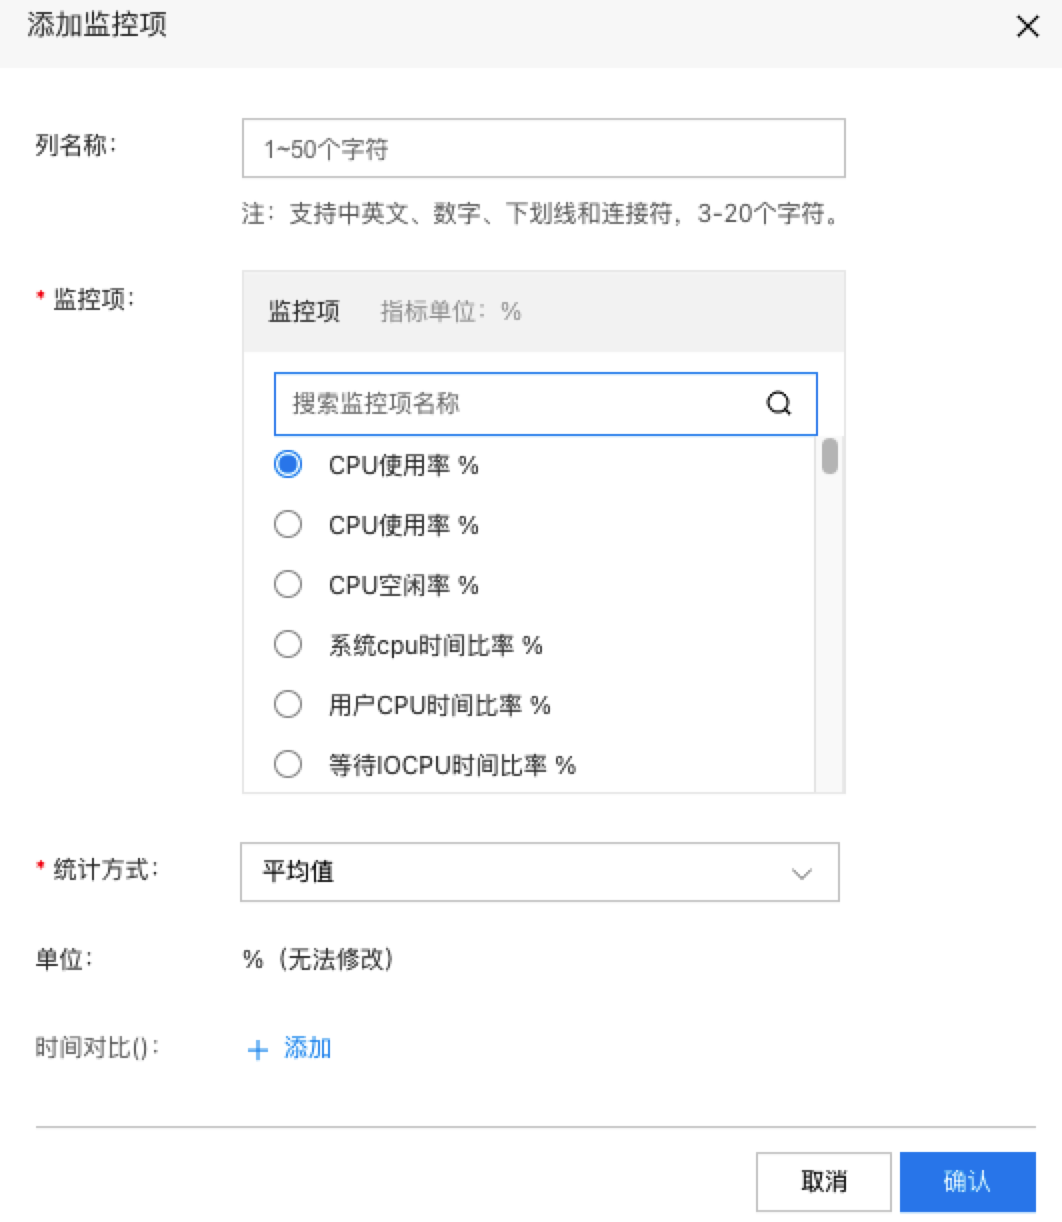
    image.png

    Description:

    • Column name: Displays the metric name by default but allows customization.
    • Each table can only include one product and metrics with the same unit.
    • Dashboard Chart

    (1) Click the "Add Metric" button to open the respective pop-up window.

    (2) Select the instances you want to display and click "Confirm" to successfully add them.
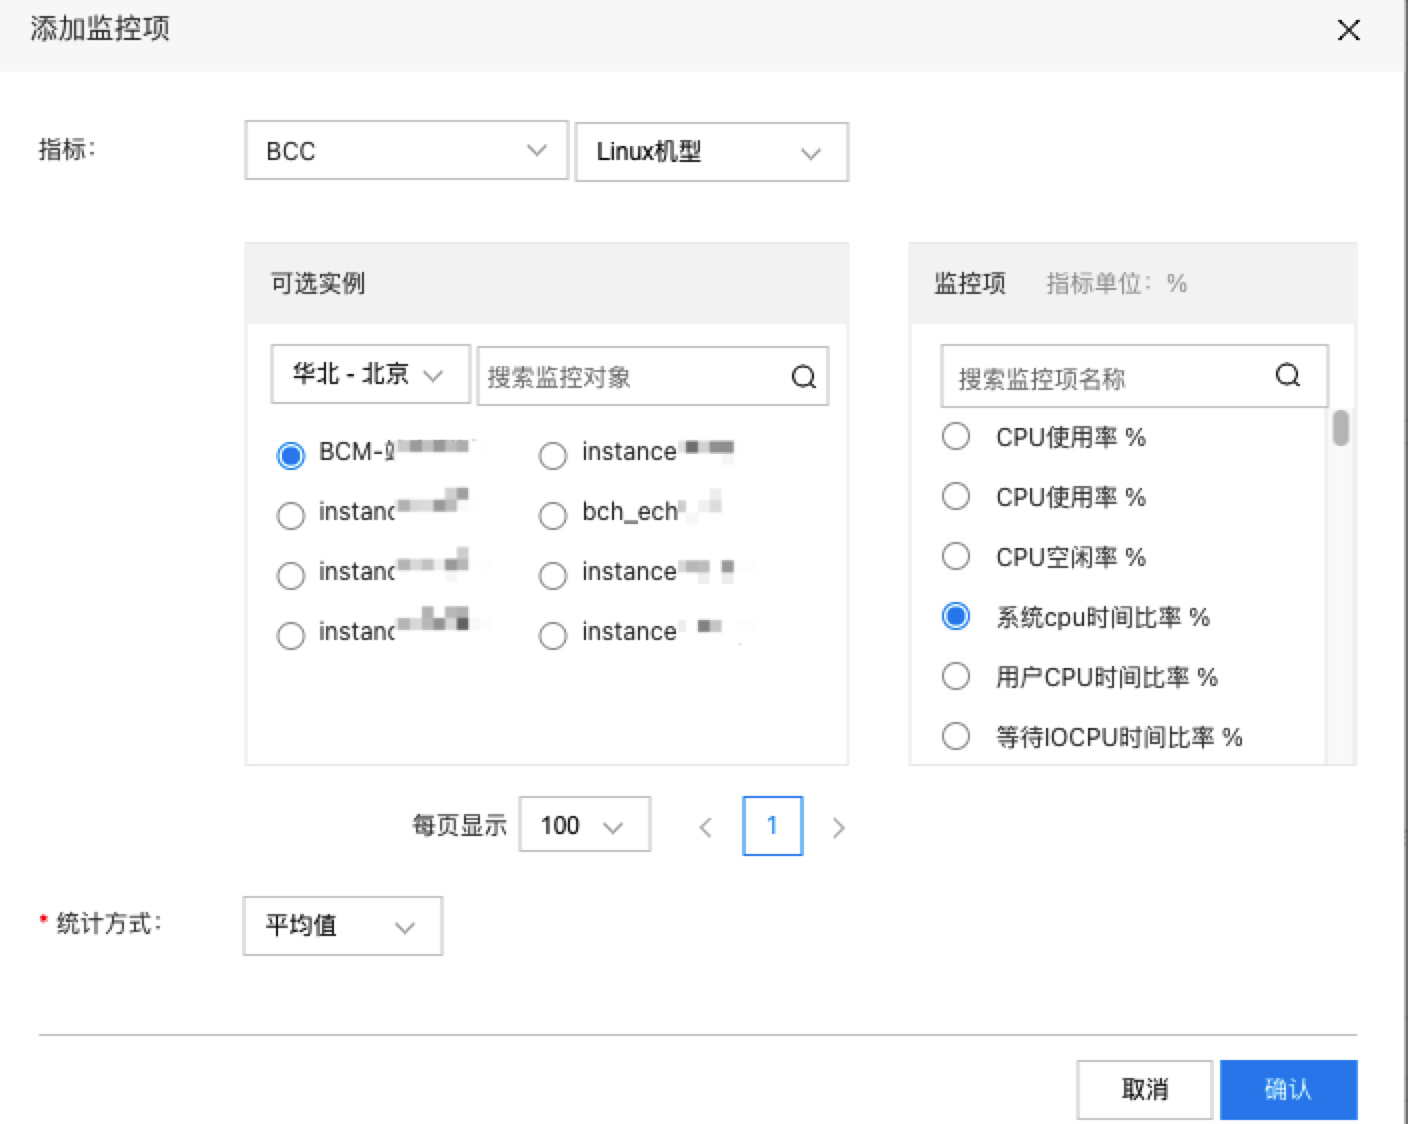
    image.png

    Note: A dashboard chart can only configure a single monitoring data source.

    • Data panel

    (1) Click the Add Metric button to open the Add Metric pop-up window.

    (2) Select the instances you want to display and click "Confirm" to successfully add them.
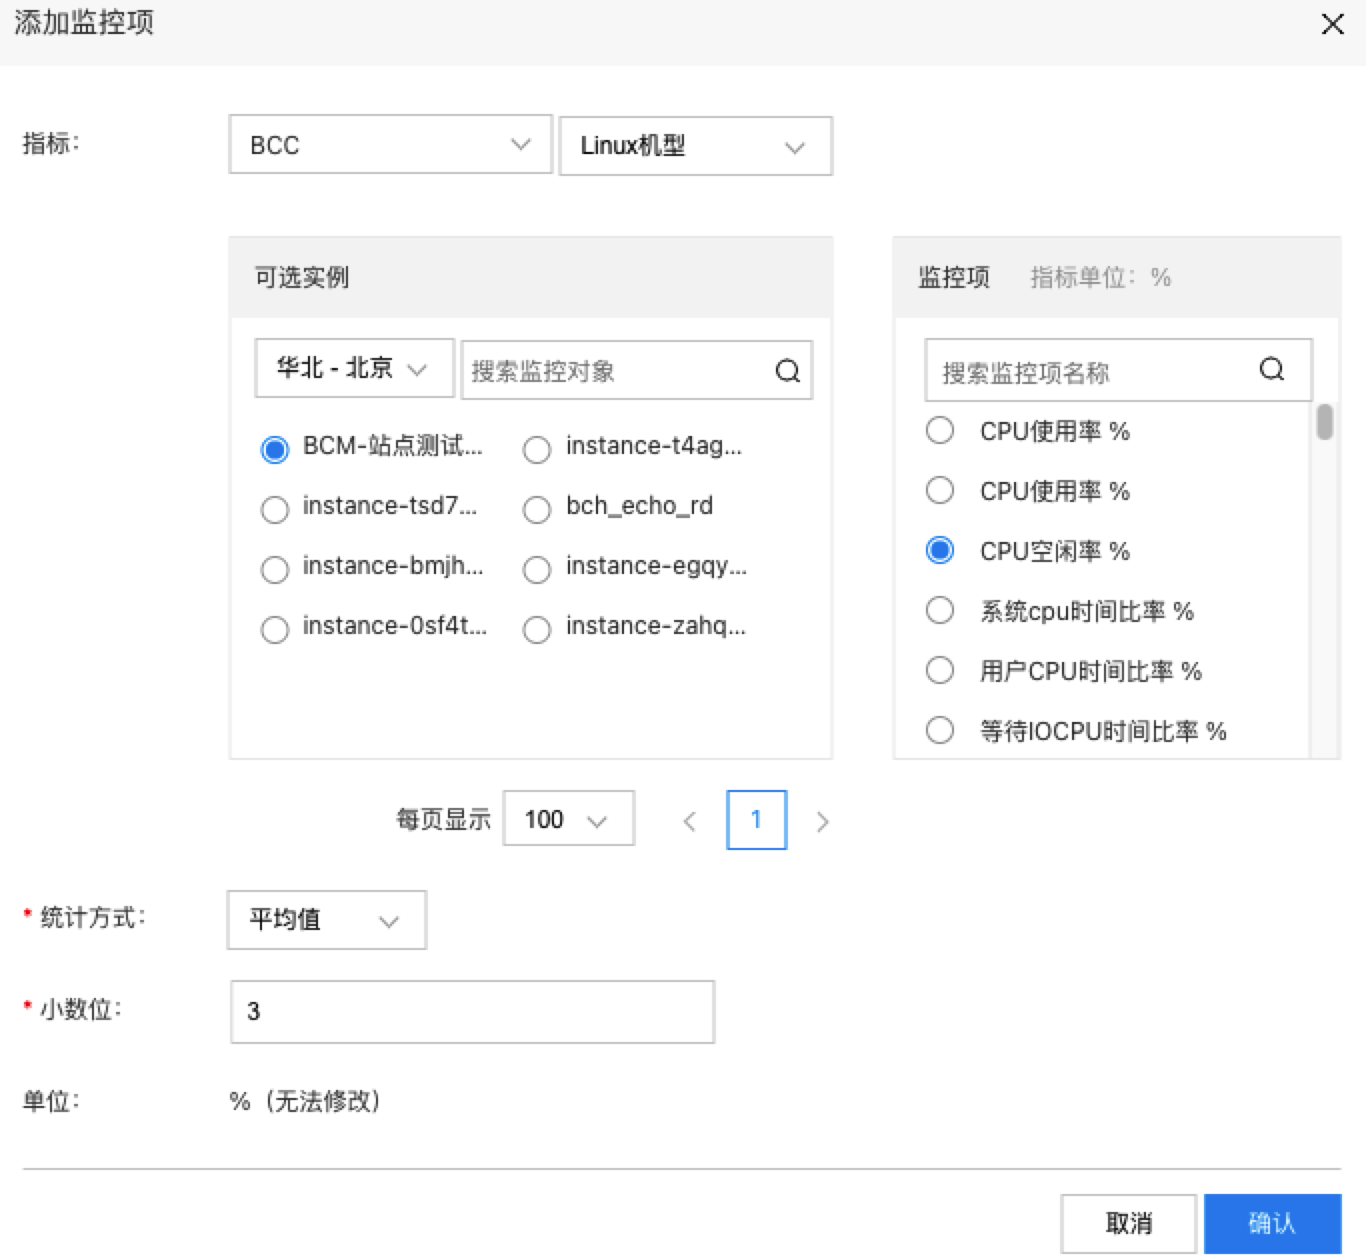
    image.png

    1. Click "Preview Chart," and then click "Finish" to complete the creation process.

    View chart

    1. Select "Dashboard" from the left navigation bar to enter the Dashboard List page.
    2. Click the dashboard name to access its details page and view all configured charts

    Set the dashboard time range

    Click the time selection module at the top of the page to adjust the time range for dashboard data display.
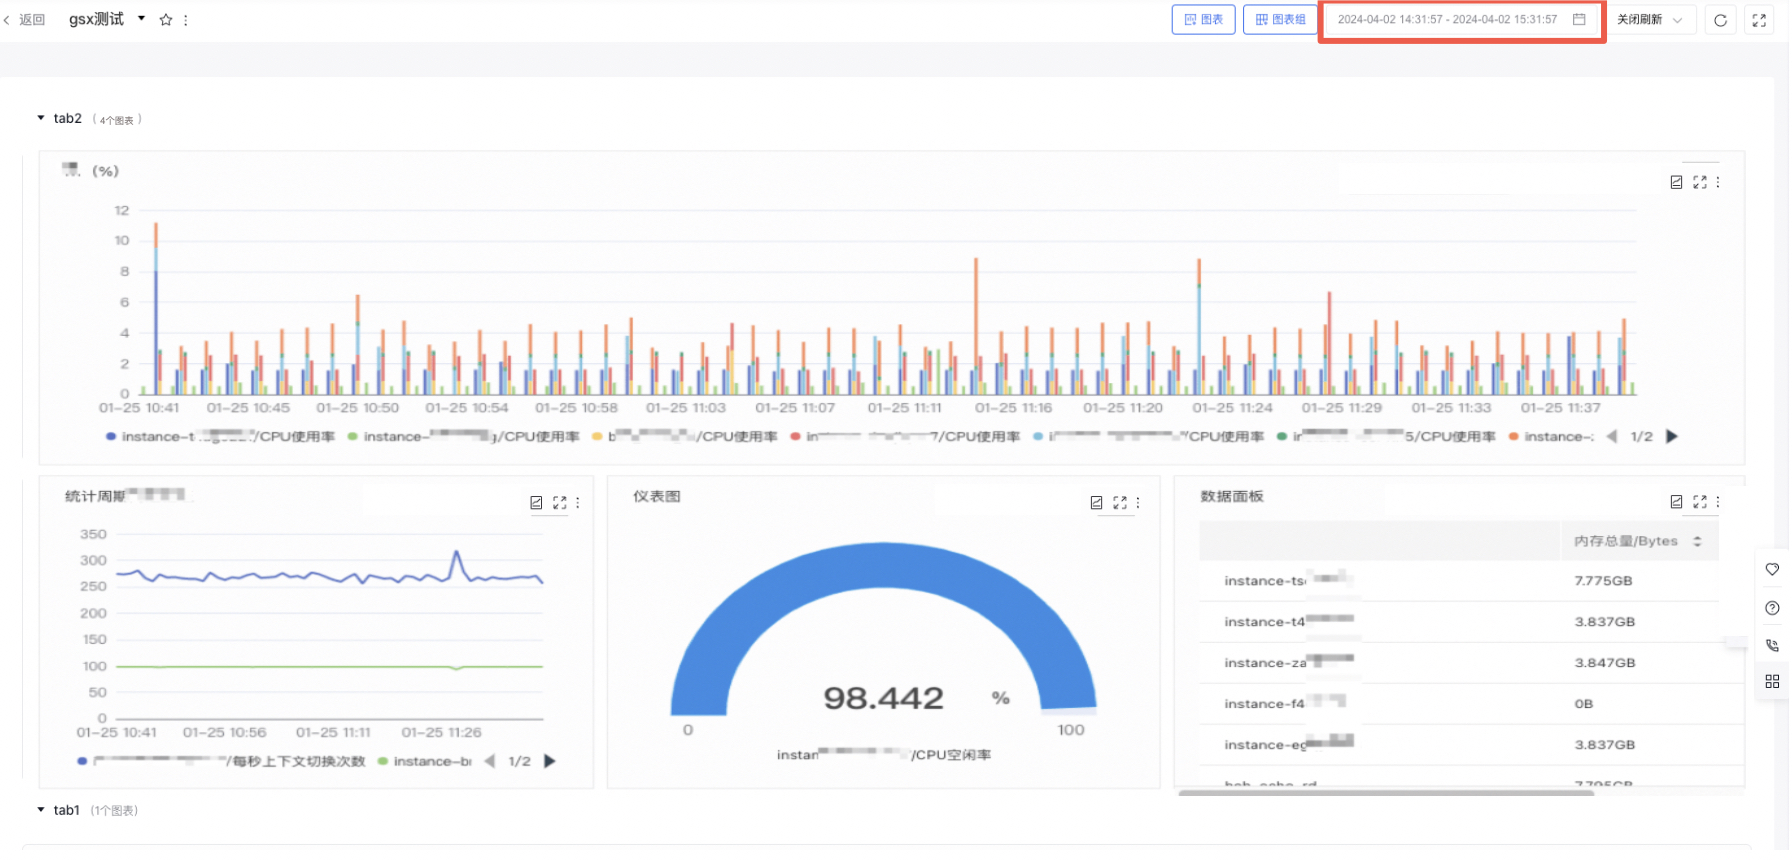
    image.png

    Note: This applies exclusively to charts configured with "Use Dashboard Time Range" or "Set Relative Time Range."

    Enable real-time data refresh

    Use the "Real-time Refresh" dropdown at the top of the page to select a time interval for refreshing chart data in real-time.
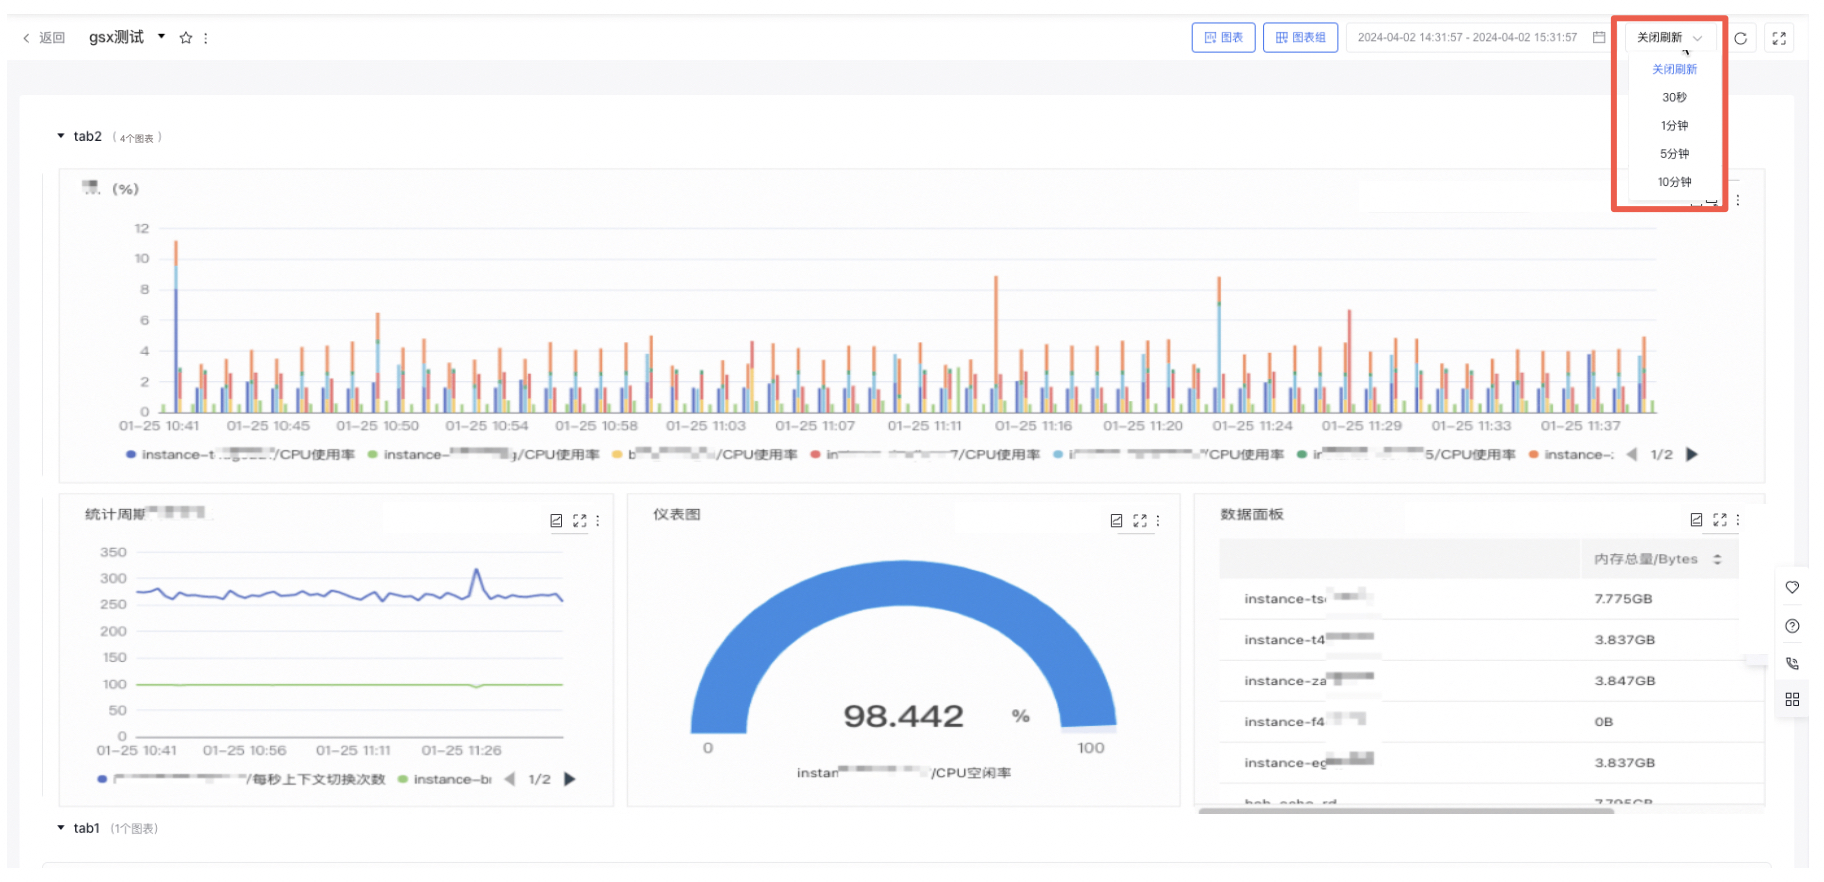
    image.png

    Note: This applies exclusively to charts configured with "Use Dashboard Time Range" or "Set Relative Time Range."

    Open advanced details

    Click the "Advanced Details" button to open a list showing advanced statistics like average, maximum, minimum, sum, and count for all chart data.
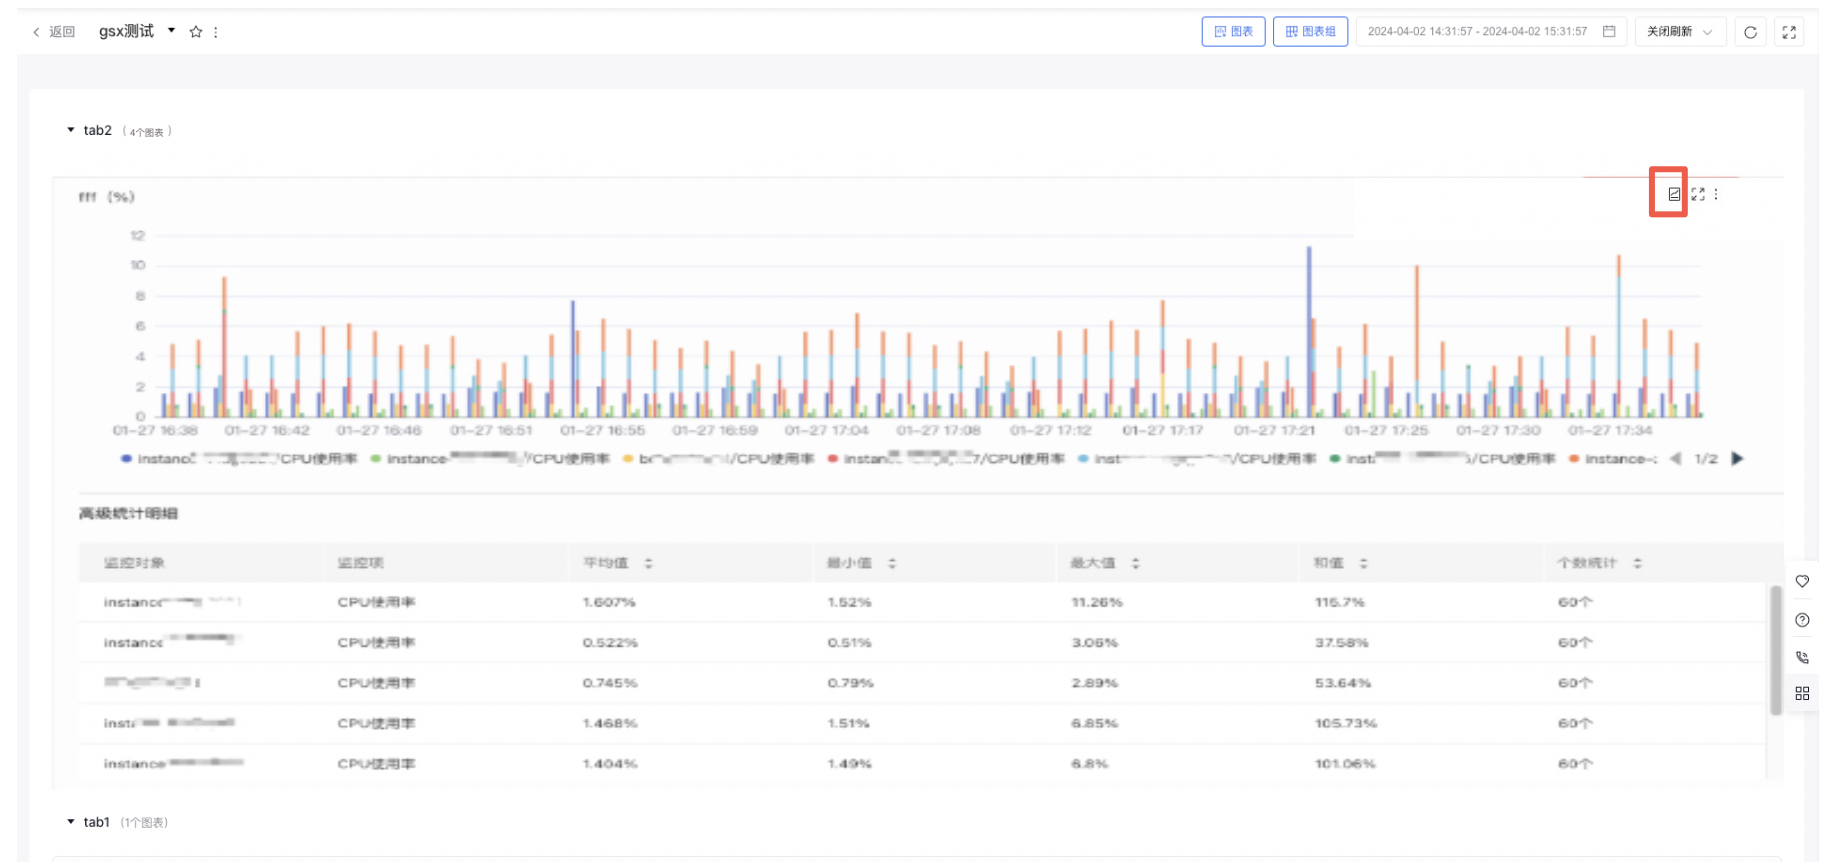
    image.png

    Edit/copy/delete chart

    1. Select "Dashboard" from the left navigation bar to enter the Dashboard List page.
    2. Click on the dashboard name to navigate to its details page.
    3. Click the "More" button in the chart's upper-right corner, then select "Edit" to enter the chart configuration page.
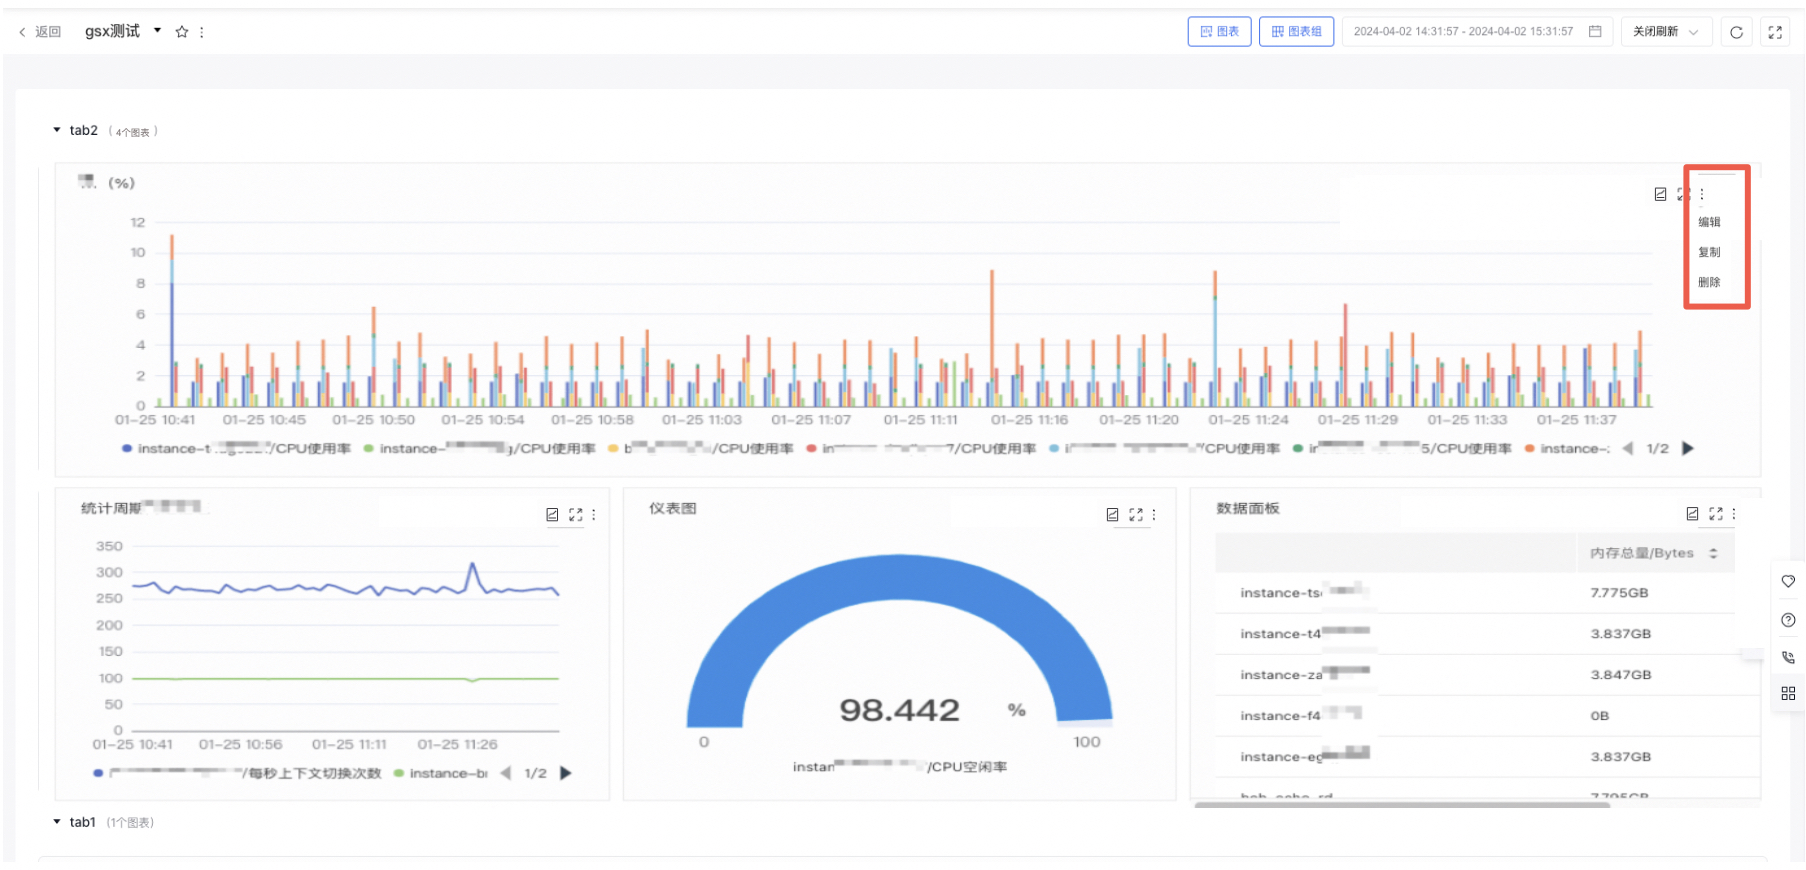
    image.png

    1. Edit the information, click "Preview Chart," and then click "Finish" to save the changes.
    2. Click the "Copy/Delete" button to duplicate or remove the chart.

    Move chart

    1. Select "Dashboard" from the left navigation bar to enter the Dashboard List page.
    2. Click on the dashboard name to navigate to its details page.
    3. Hold and drag charts to sort them either within groups or to other groups

    Previous
    Overview
    Next
    Management Dashboard