View timed probe tasks
Updated at:2025-11-03
View timed probe tasks
Prerequisites
Ensure that you have already created a site monitor task.
Overview
- In the left navigation bar, select Site Monitor and then the Timed Probe tab to open the Timed Probe Task List.
- Click the name of a task to view its Task Overview page.
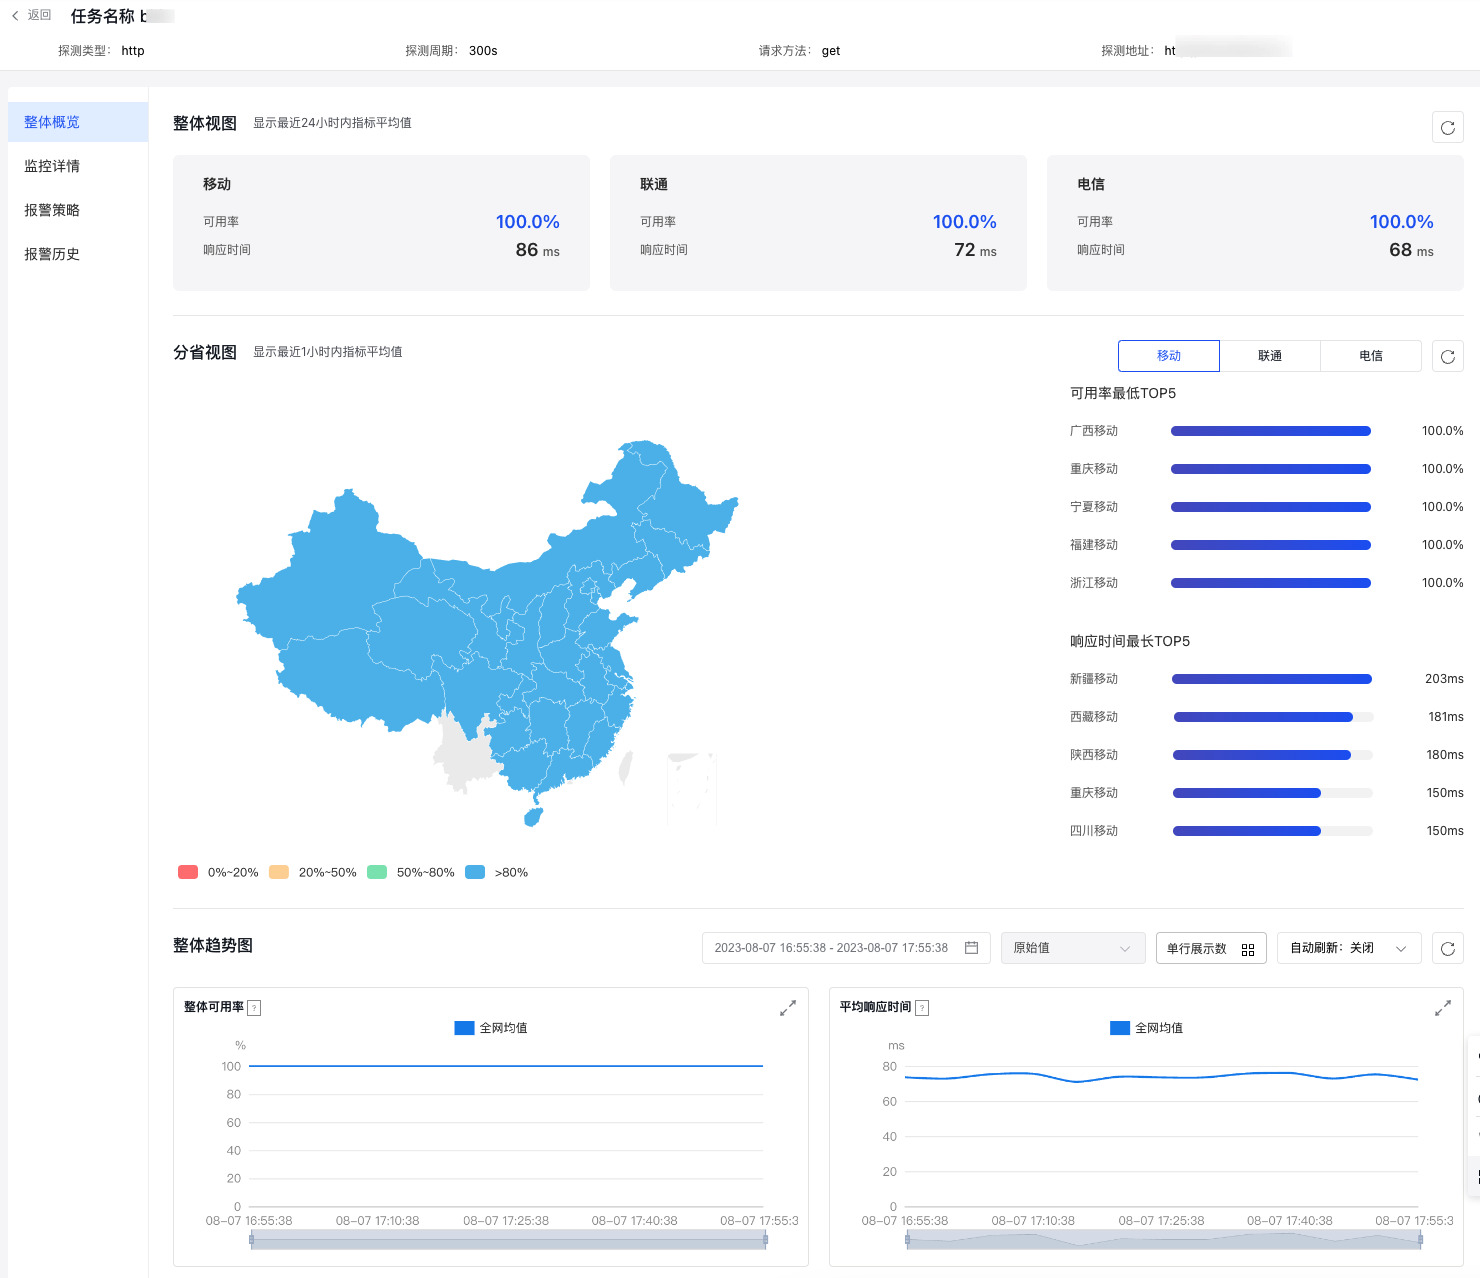
Function description:
- Overview: Categorized by operator modules, this section sequentially presents the average availability and response time for China Mobile, China Unicom, and China Telecom over the past 24 hours.
- Provincial/municipal map:
-Support viewing the average availability rate and response time for China Mobile, China Unicom, and China Telecom within the last hour in a specific province.
- The national map distinguishes the values of availability through color variations, facilitating quick identification of probe nodes with low availability.
- The right side of the map displays a ranking of the top 5 probe nodes with the lowest availability and longest response time, allowing you to quickly assess the usage status of potentially abnormal probe nodes.- Overall trend chart:
- Display trend charts for overall availability and average response time based on the selected time range and statistic method.
- You can view monitor data of the last 40 days.
- Support setting automatic refresh.
Monitor details
- Click the "Site Monitor" and "Timed Probe" tabs in the left navigation bar to open the Task List page.
- Click the name of a task to view its Task Overview page.
- Click the "Monitor Details" tab on the left to navigate to the Monitor Trend Chart page.
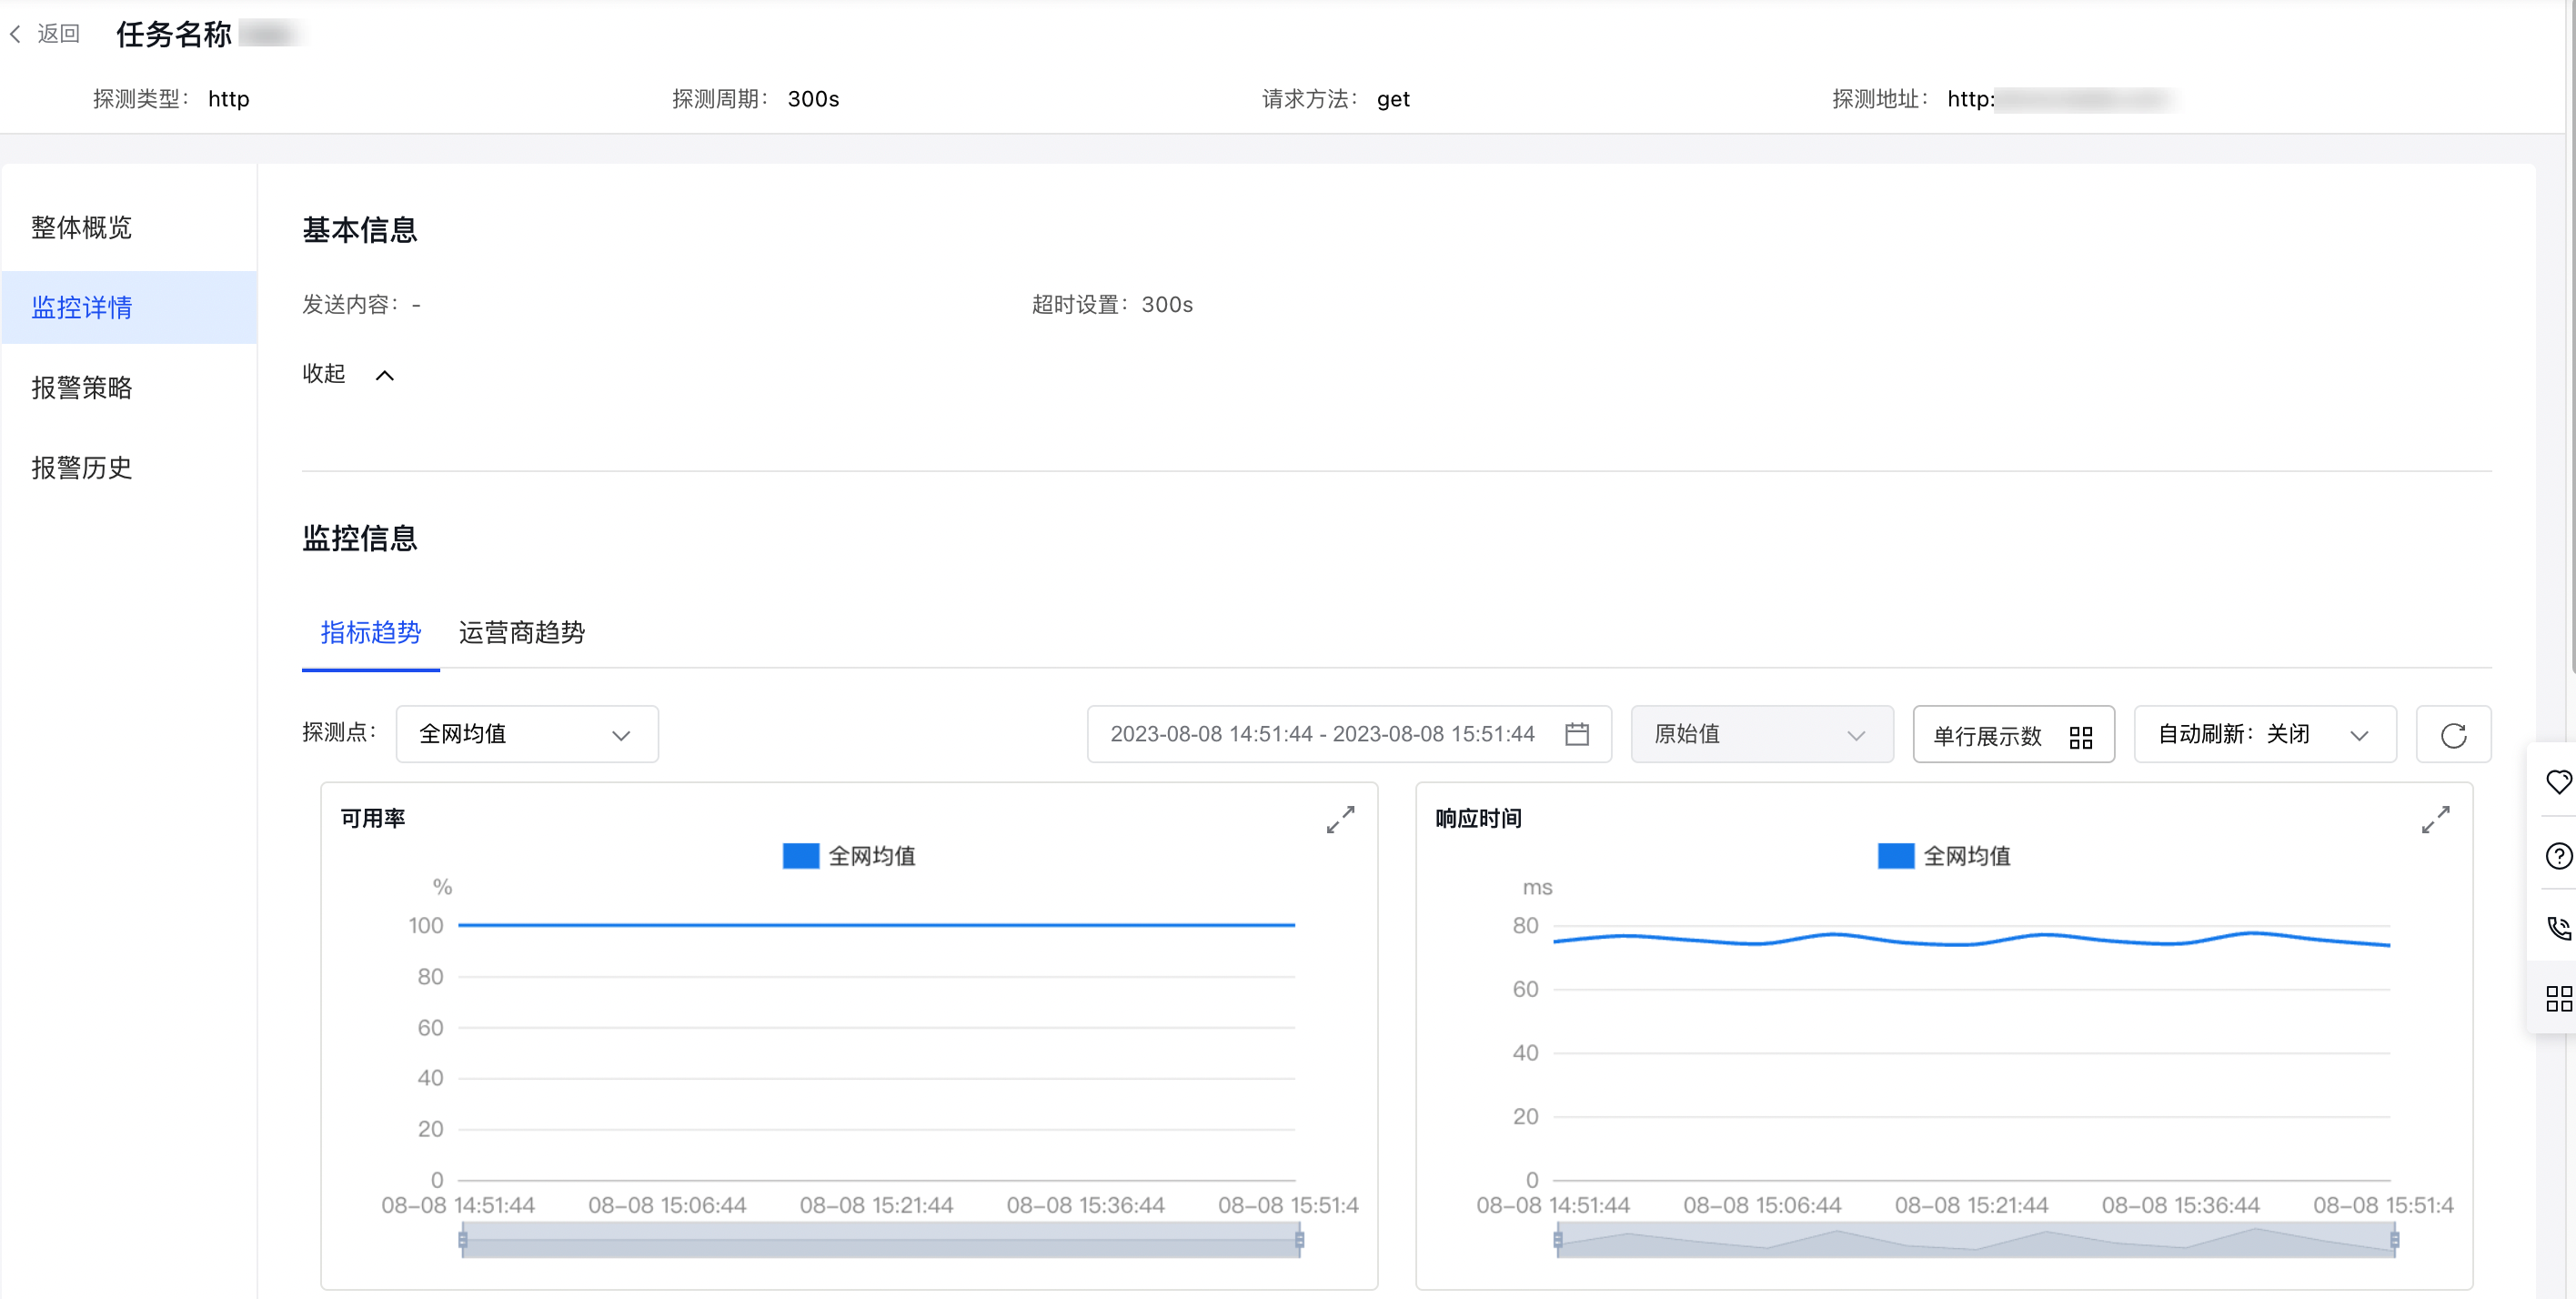
Function description:
- Monitor information: Support viewing monitor data from two dimensions: metric trend and operator trend.
a) Metric trend: Support selecting the global average (default) and the probe nodes you added for this monitor task.
b) Operator trend: Support the three major operators, China Mobile, China Telecom, and China Unicom. You can select the operator of your added probe nodes to view corresponding monitor data.
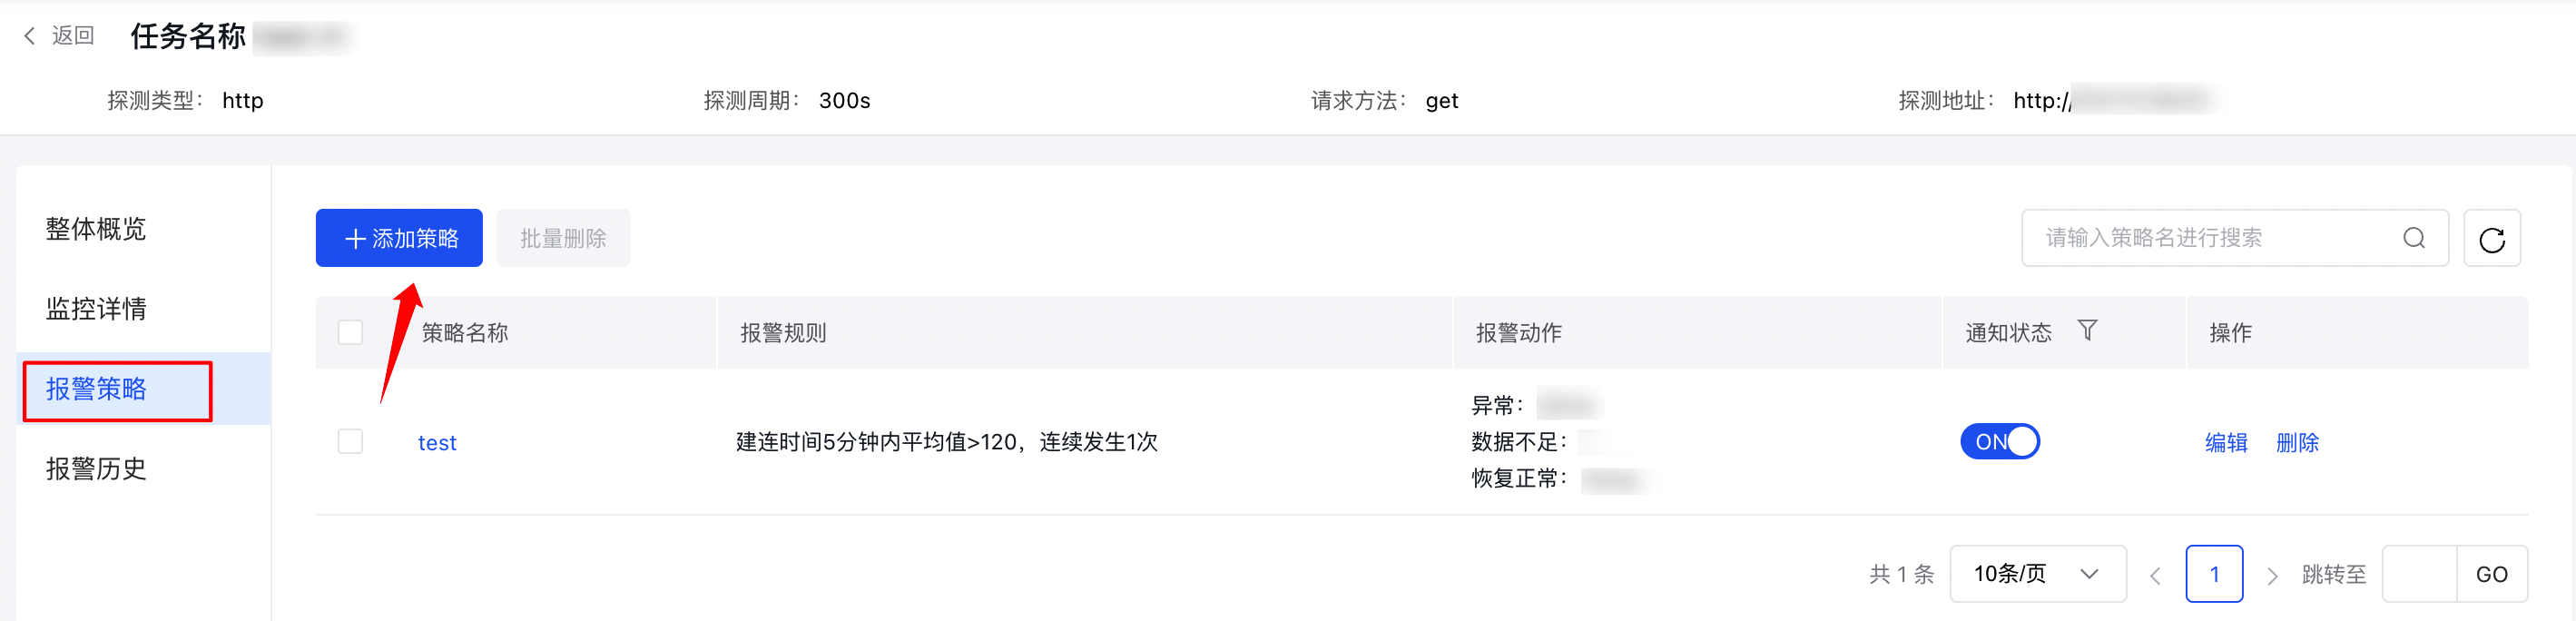
Alarm strategy
Add alarm strategy for a site monitor task
- Click the "Site Monitor" and "Timed Probe" tabs in the left navigation bar to open the Task List page.
- Click the "Alarm Strategy" button in the operation column to view the Alarm Strategy Details page for this monitoring task.
- Click the "Add Strategy" button to open the page for creating a new alarm strategy for this site, fill out the form, and finalize the alarm strategy setup.
Form configuration:
| ConfigMap | Description |
|---|---|
| Policy name | Enter a custom name for the strategy. |
| Monitor Object | Specify the probe address for the current task. |
| Alarm level | Support levels include: notification, warning, important (default), and critical. |
| Alarm Rule | |
| Insufficient data alarm | You can enable or disable no-data alarms as needed. By default, this feature is disabled. |
| Select alarm action | Alarm action is a collection composed of alarm notification methods and alarm contact groups. As needed, check existing alarm actions for exceptions, alarm disabling, or insufficient data. If no alarm action exists, click Add Alarm Action button to add. For details, refer to: Alarm Actions |
| Alarm callback | For details, refer to Alarm Callback. |
View Alarm Strategy
- Click the "Site Monitor" and "Timed Probe" tabs in the left navigation bar to open the Task List page.
- Click the "Alarm Strategy" button in the operation column to access the Alarm Strategy page for this monitoring task.
- Click the name of an alarm strategy to open the Alarm Strategy Details pop-up window.
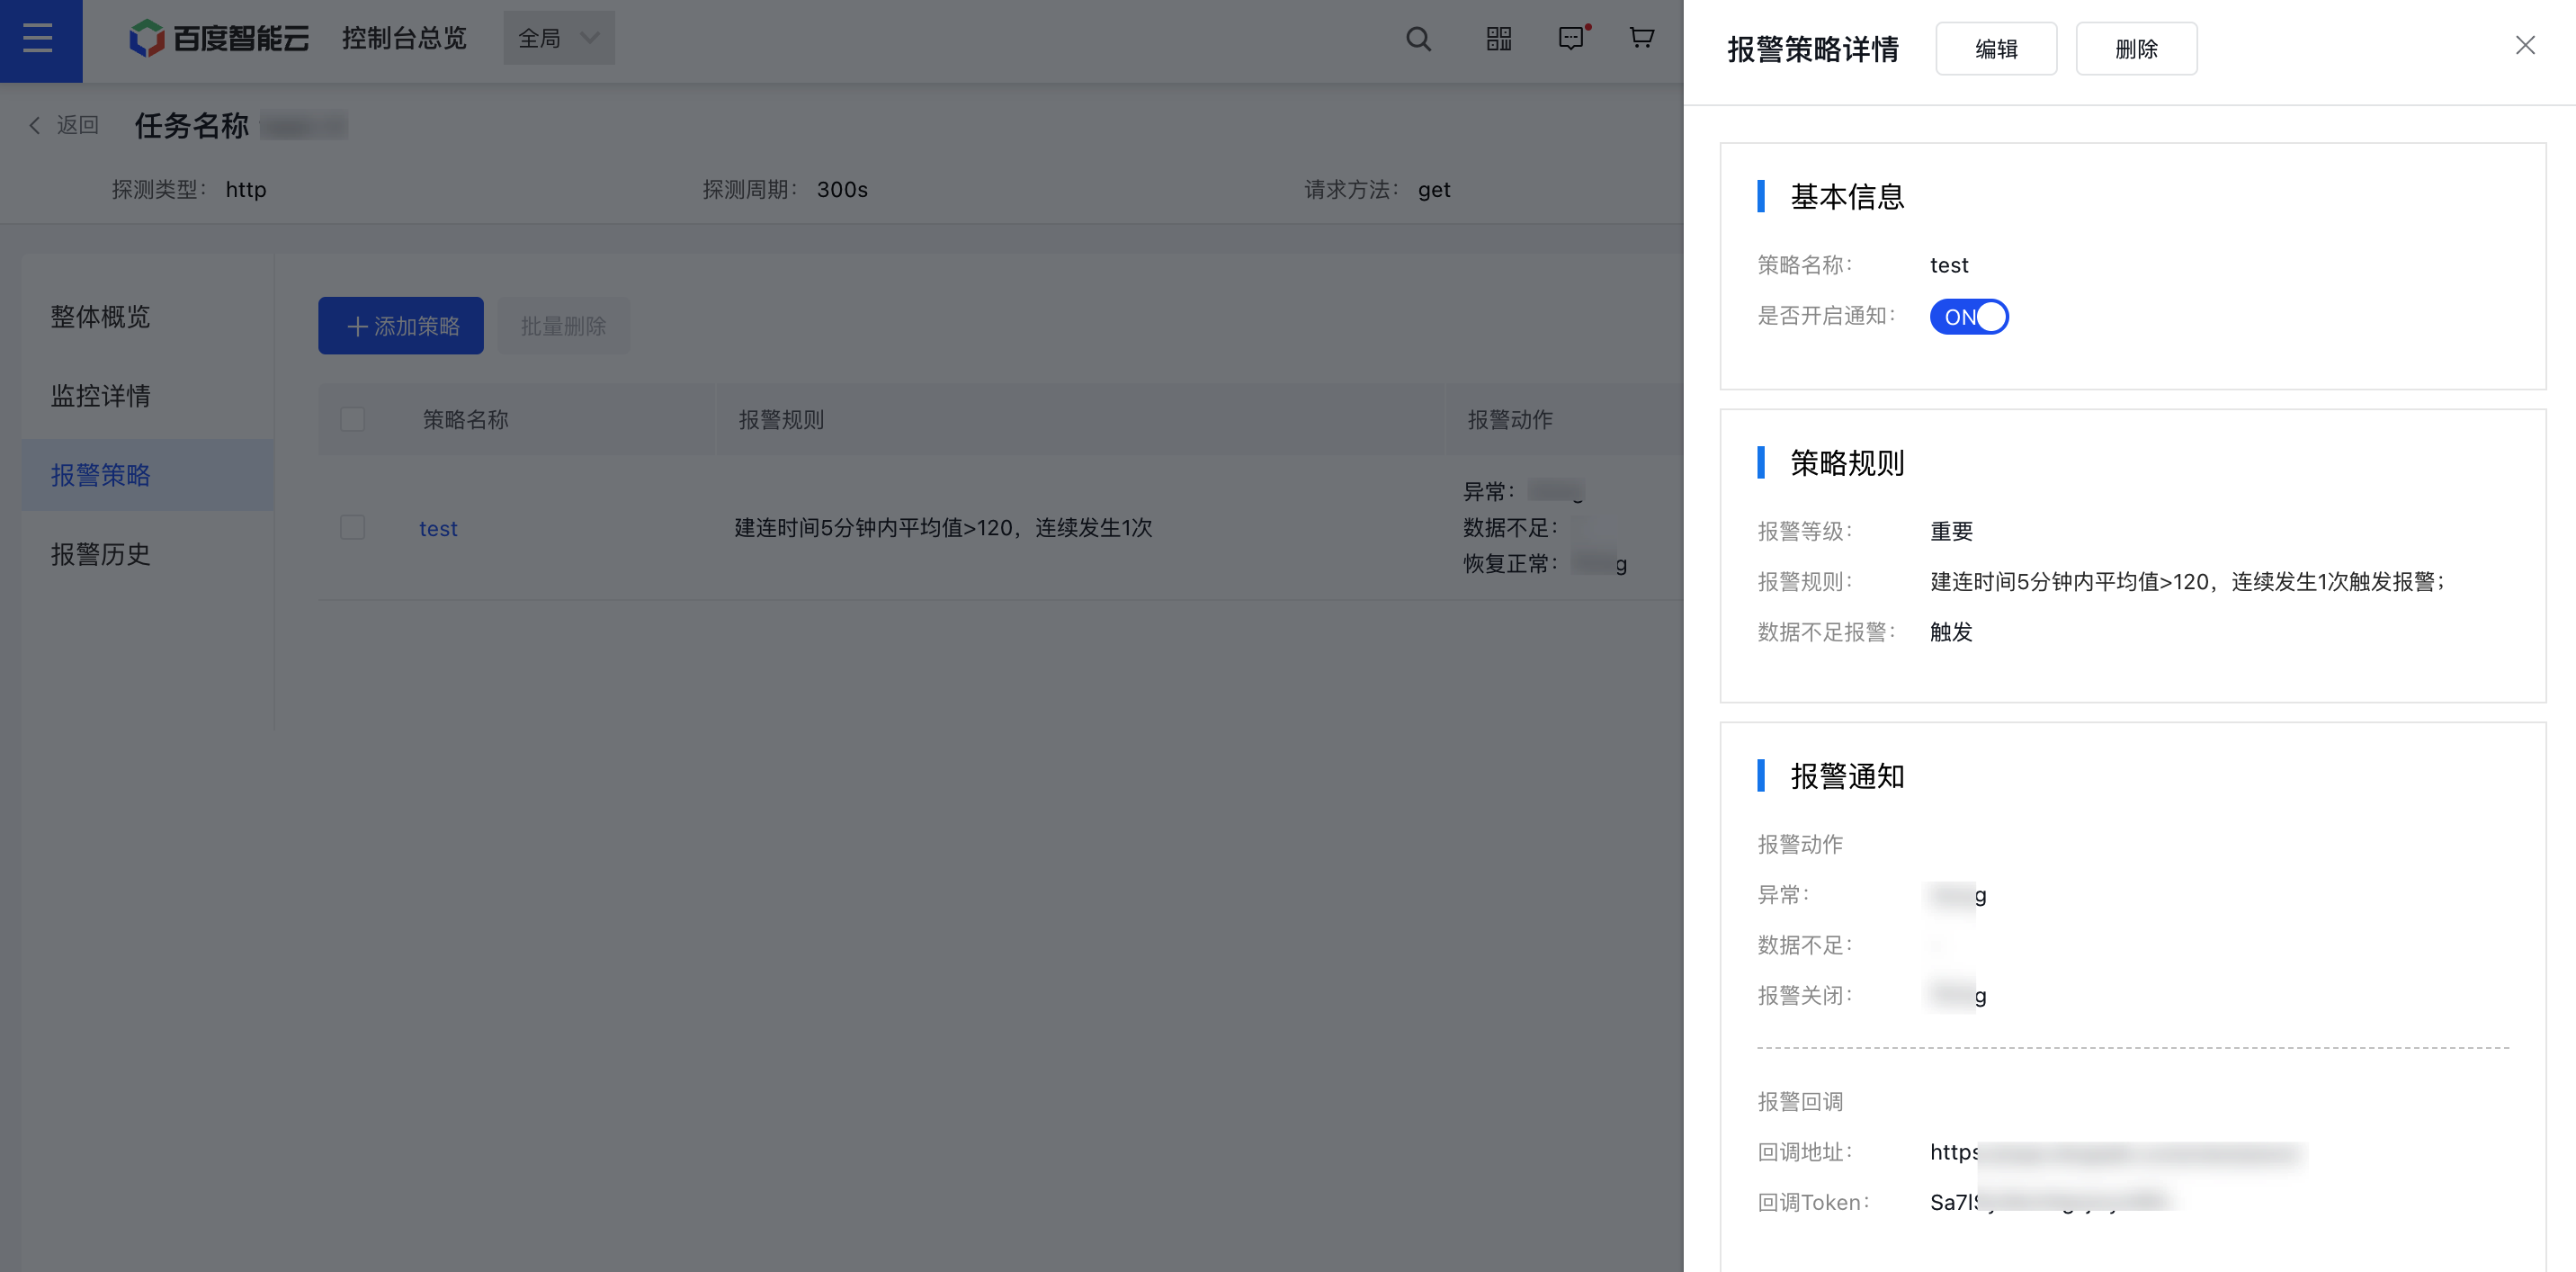
Management alarm strategy
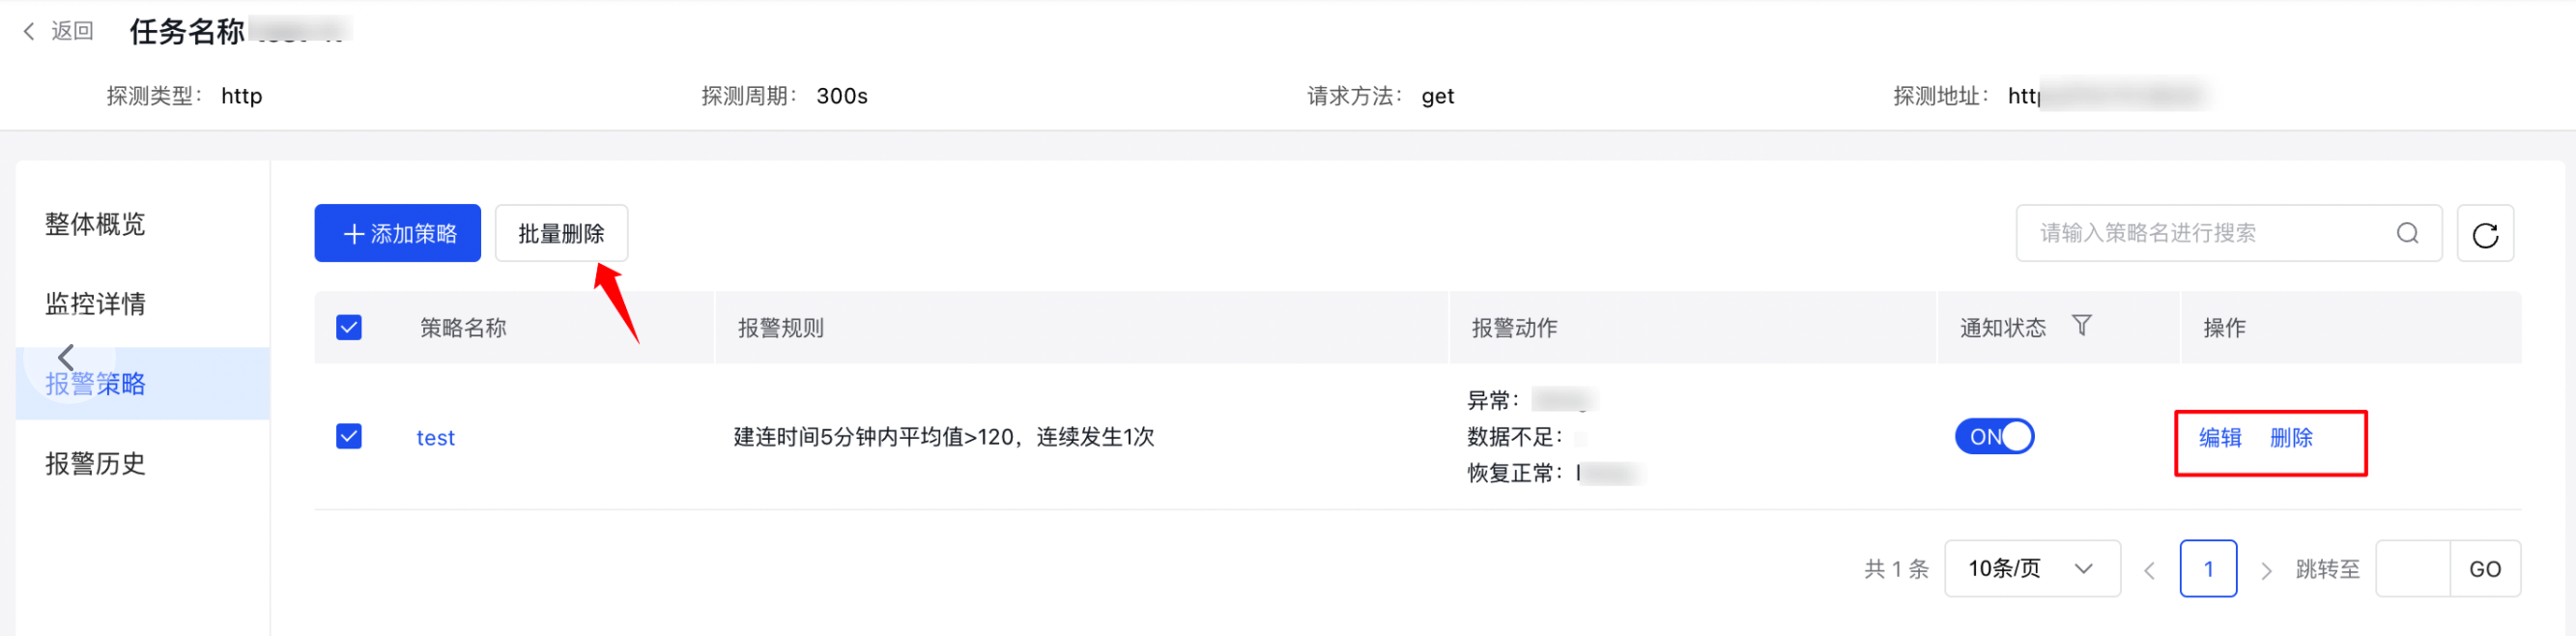
- Click the "Site Monitor" and "Timed Probe" tabs in the left navigation bar to open the Task List page.
- Click the "Alarm Strategy" button in the operation column to access the Alarm Strategy page for this monitoring task.
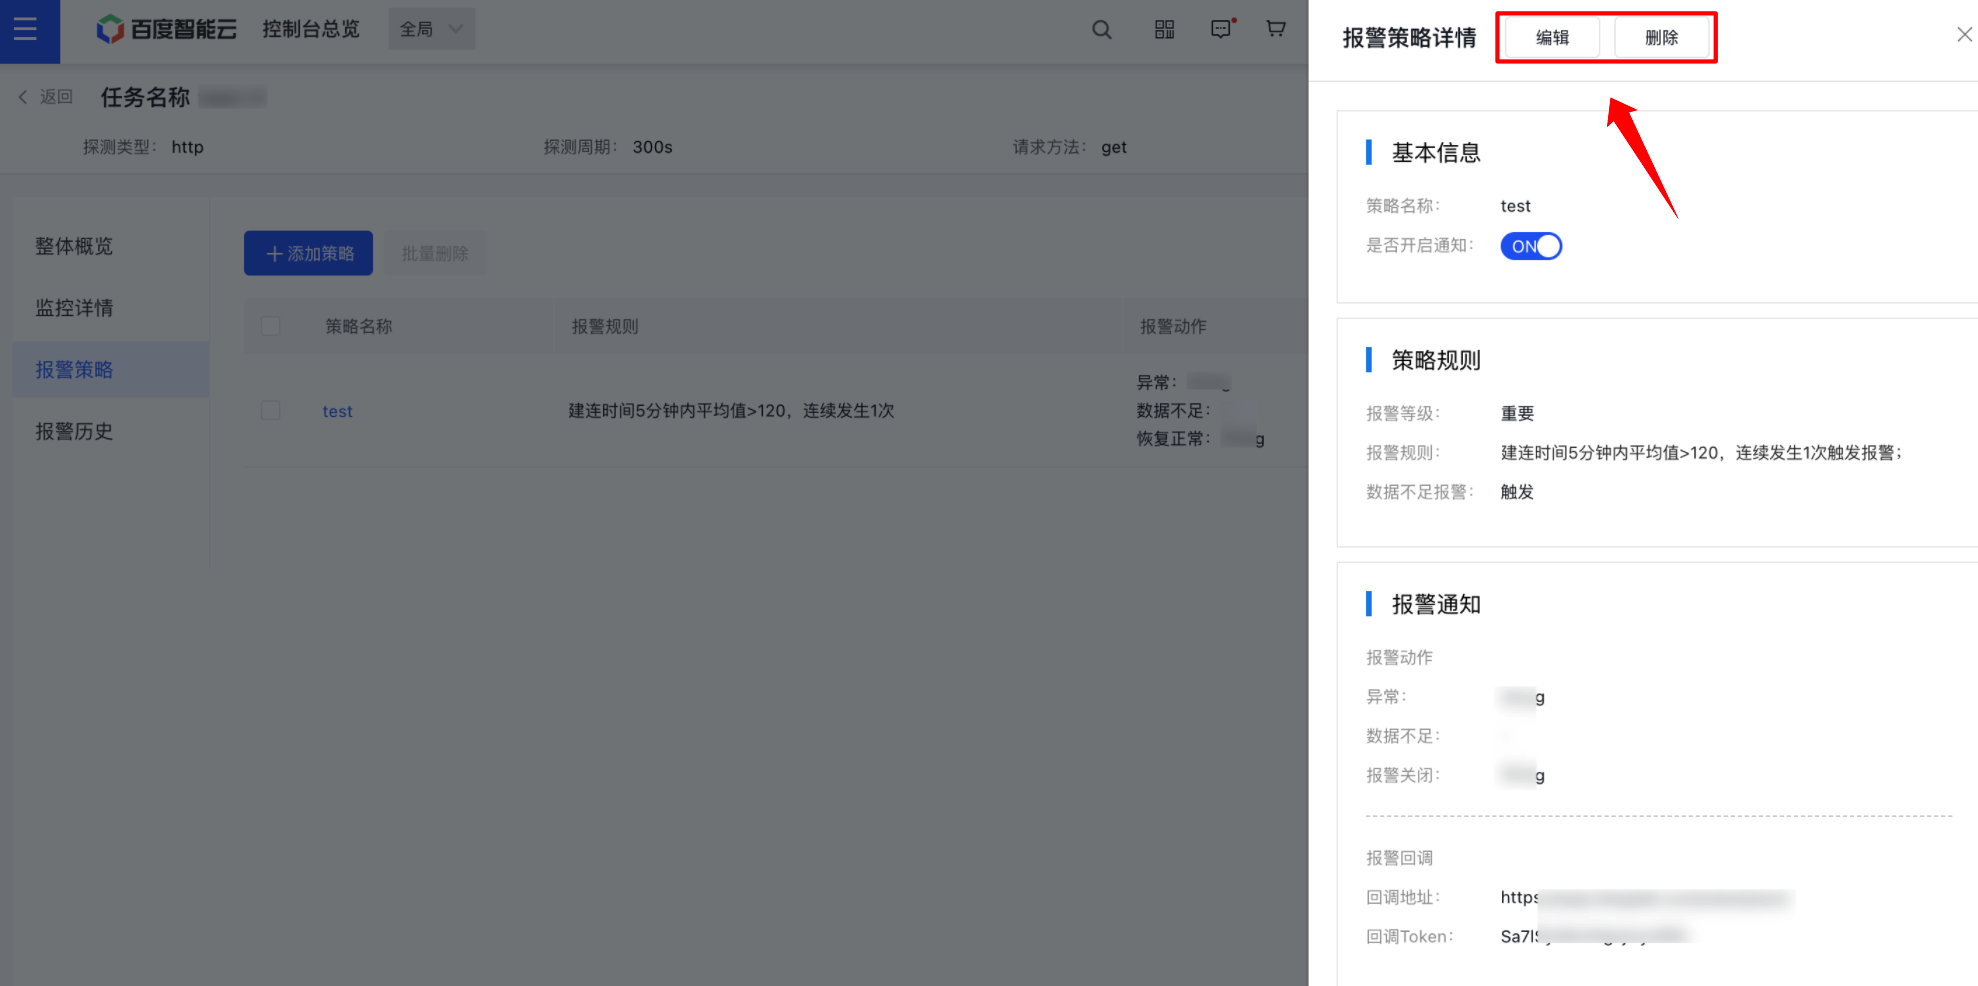
- Click the "Edit" or "Delete" button in the operation column to modify or remove an alarm strategy. You can also select multiple alarm strategies for batch deletion.
Alternatively, click on the strategy name, then click the "Edit" or "Delete" button in the Alarm Strategy Details window to modify or delete a specific alarm strategy.
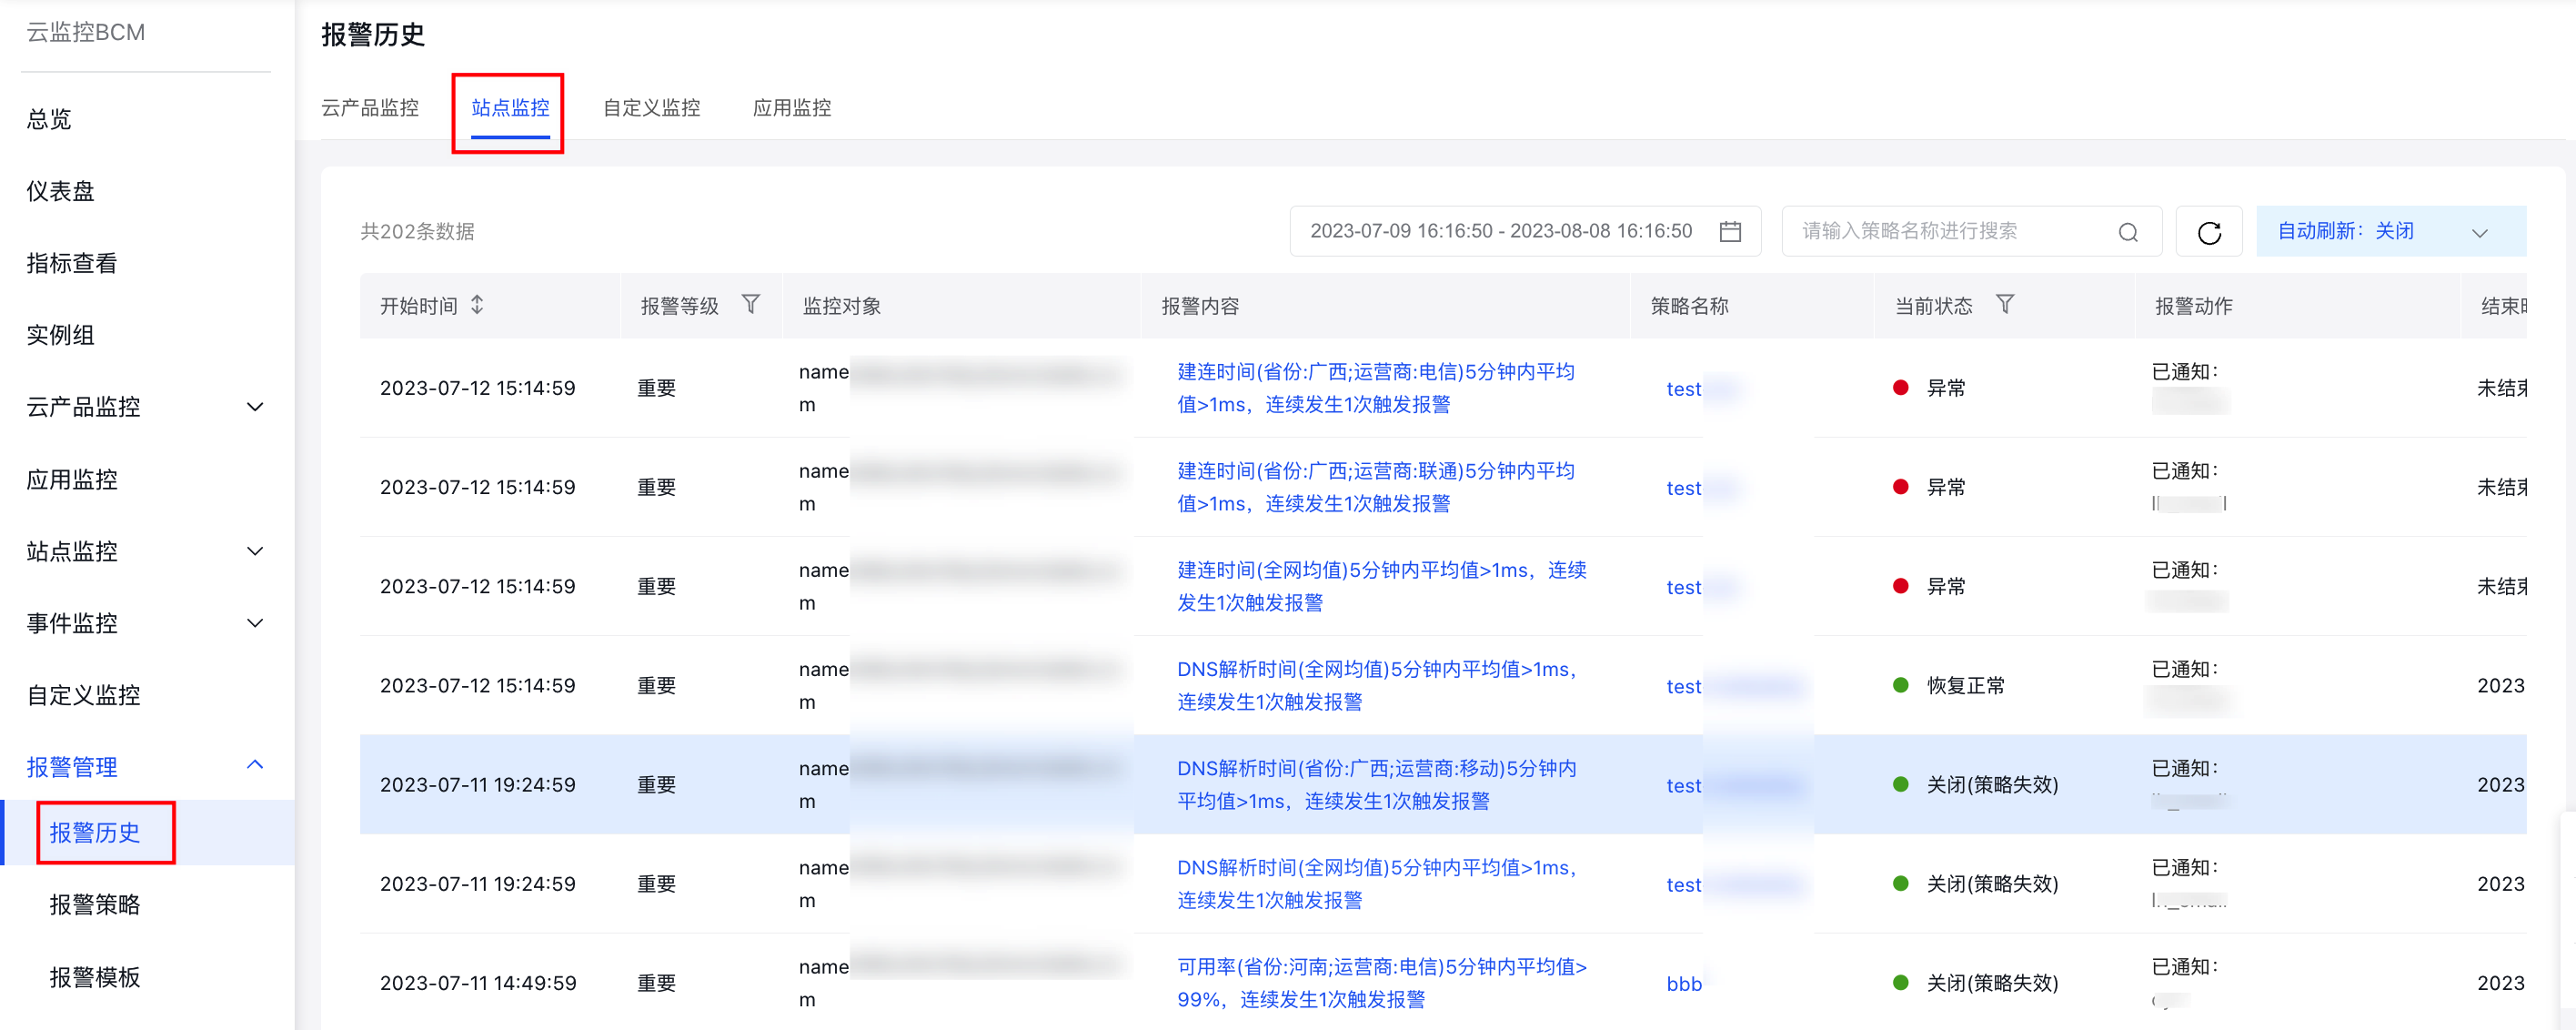
Alarm history
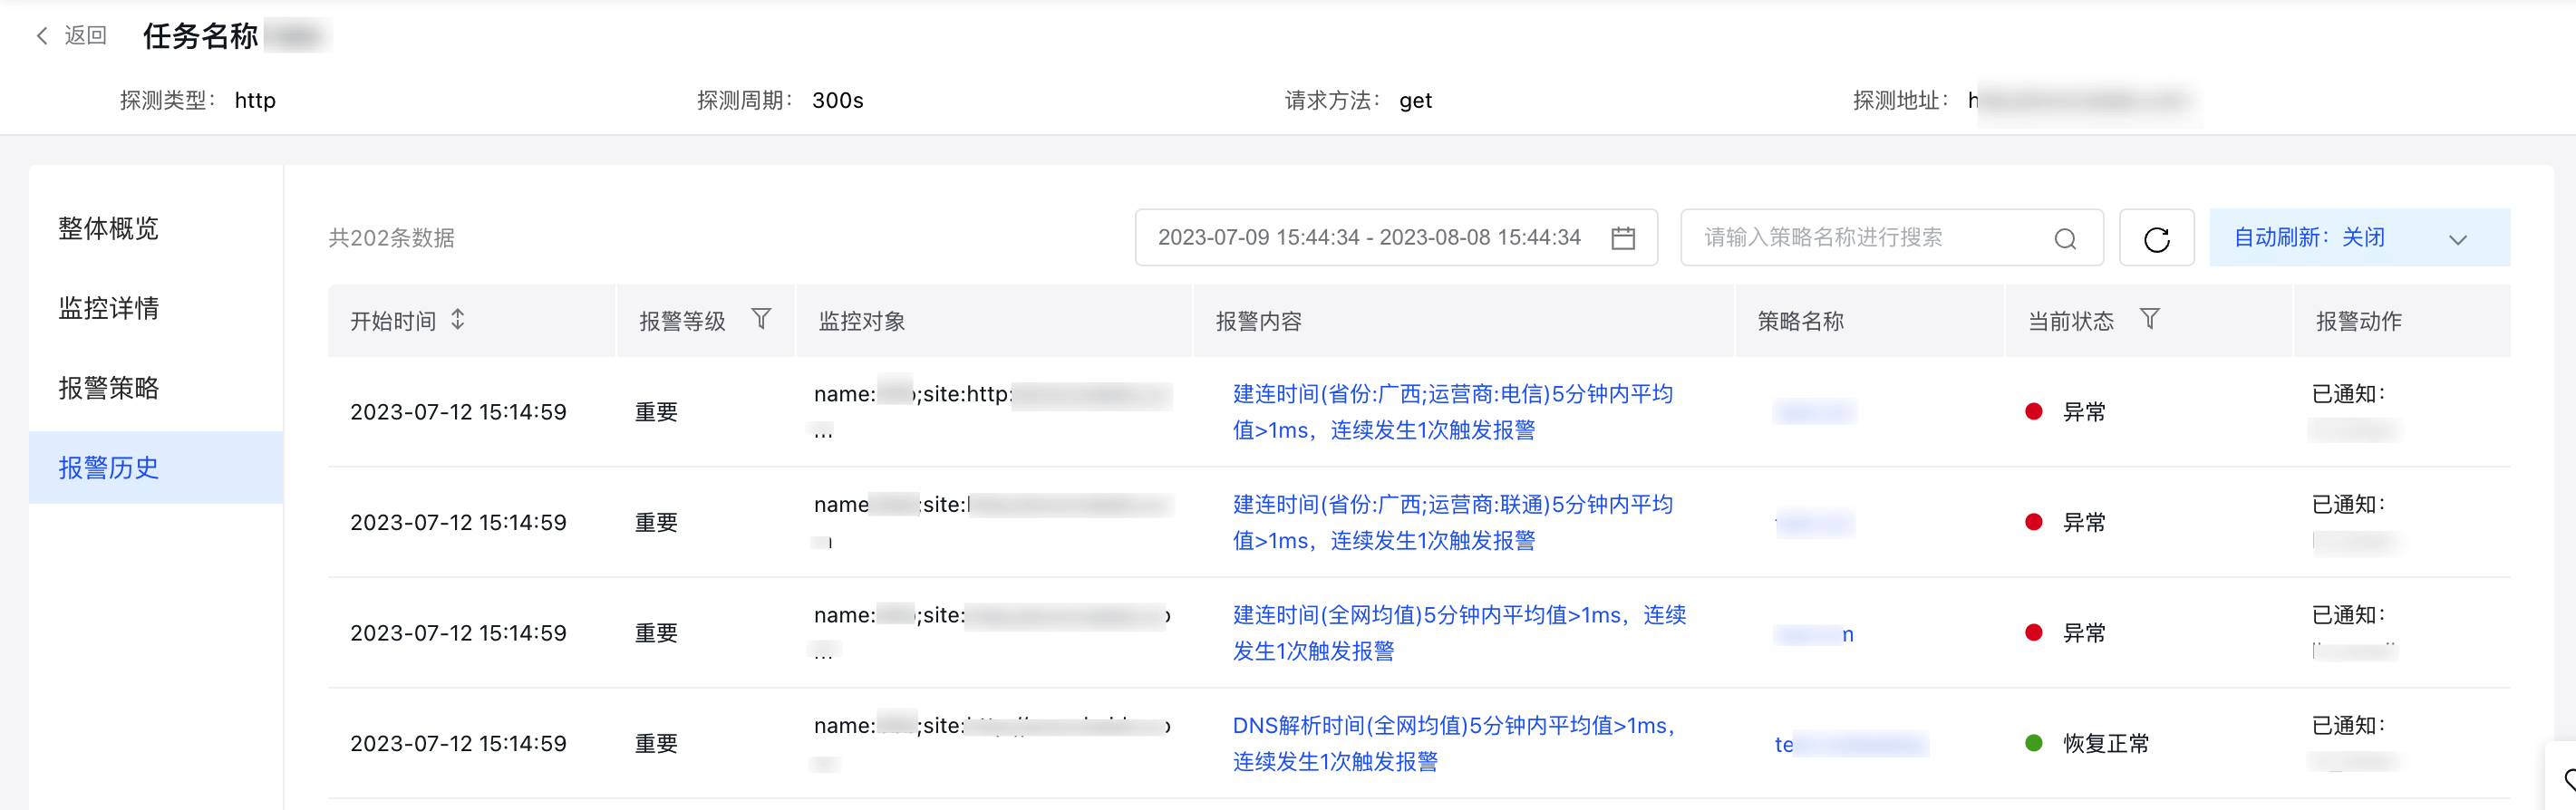
- Click the "Site Monitor" and "Timed Probe" tabs in the left navigation bar to open the Task List page.
- Click on a task name to open the Site Monitor Overview page.
- Click the left-side Alarm History tab to open the Alarm History Information page.
View site monitor under alarm management
- Manage Alarm Strategies of Site Monitor under Alarm Management
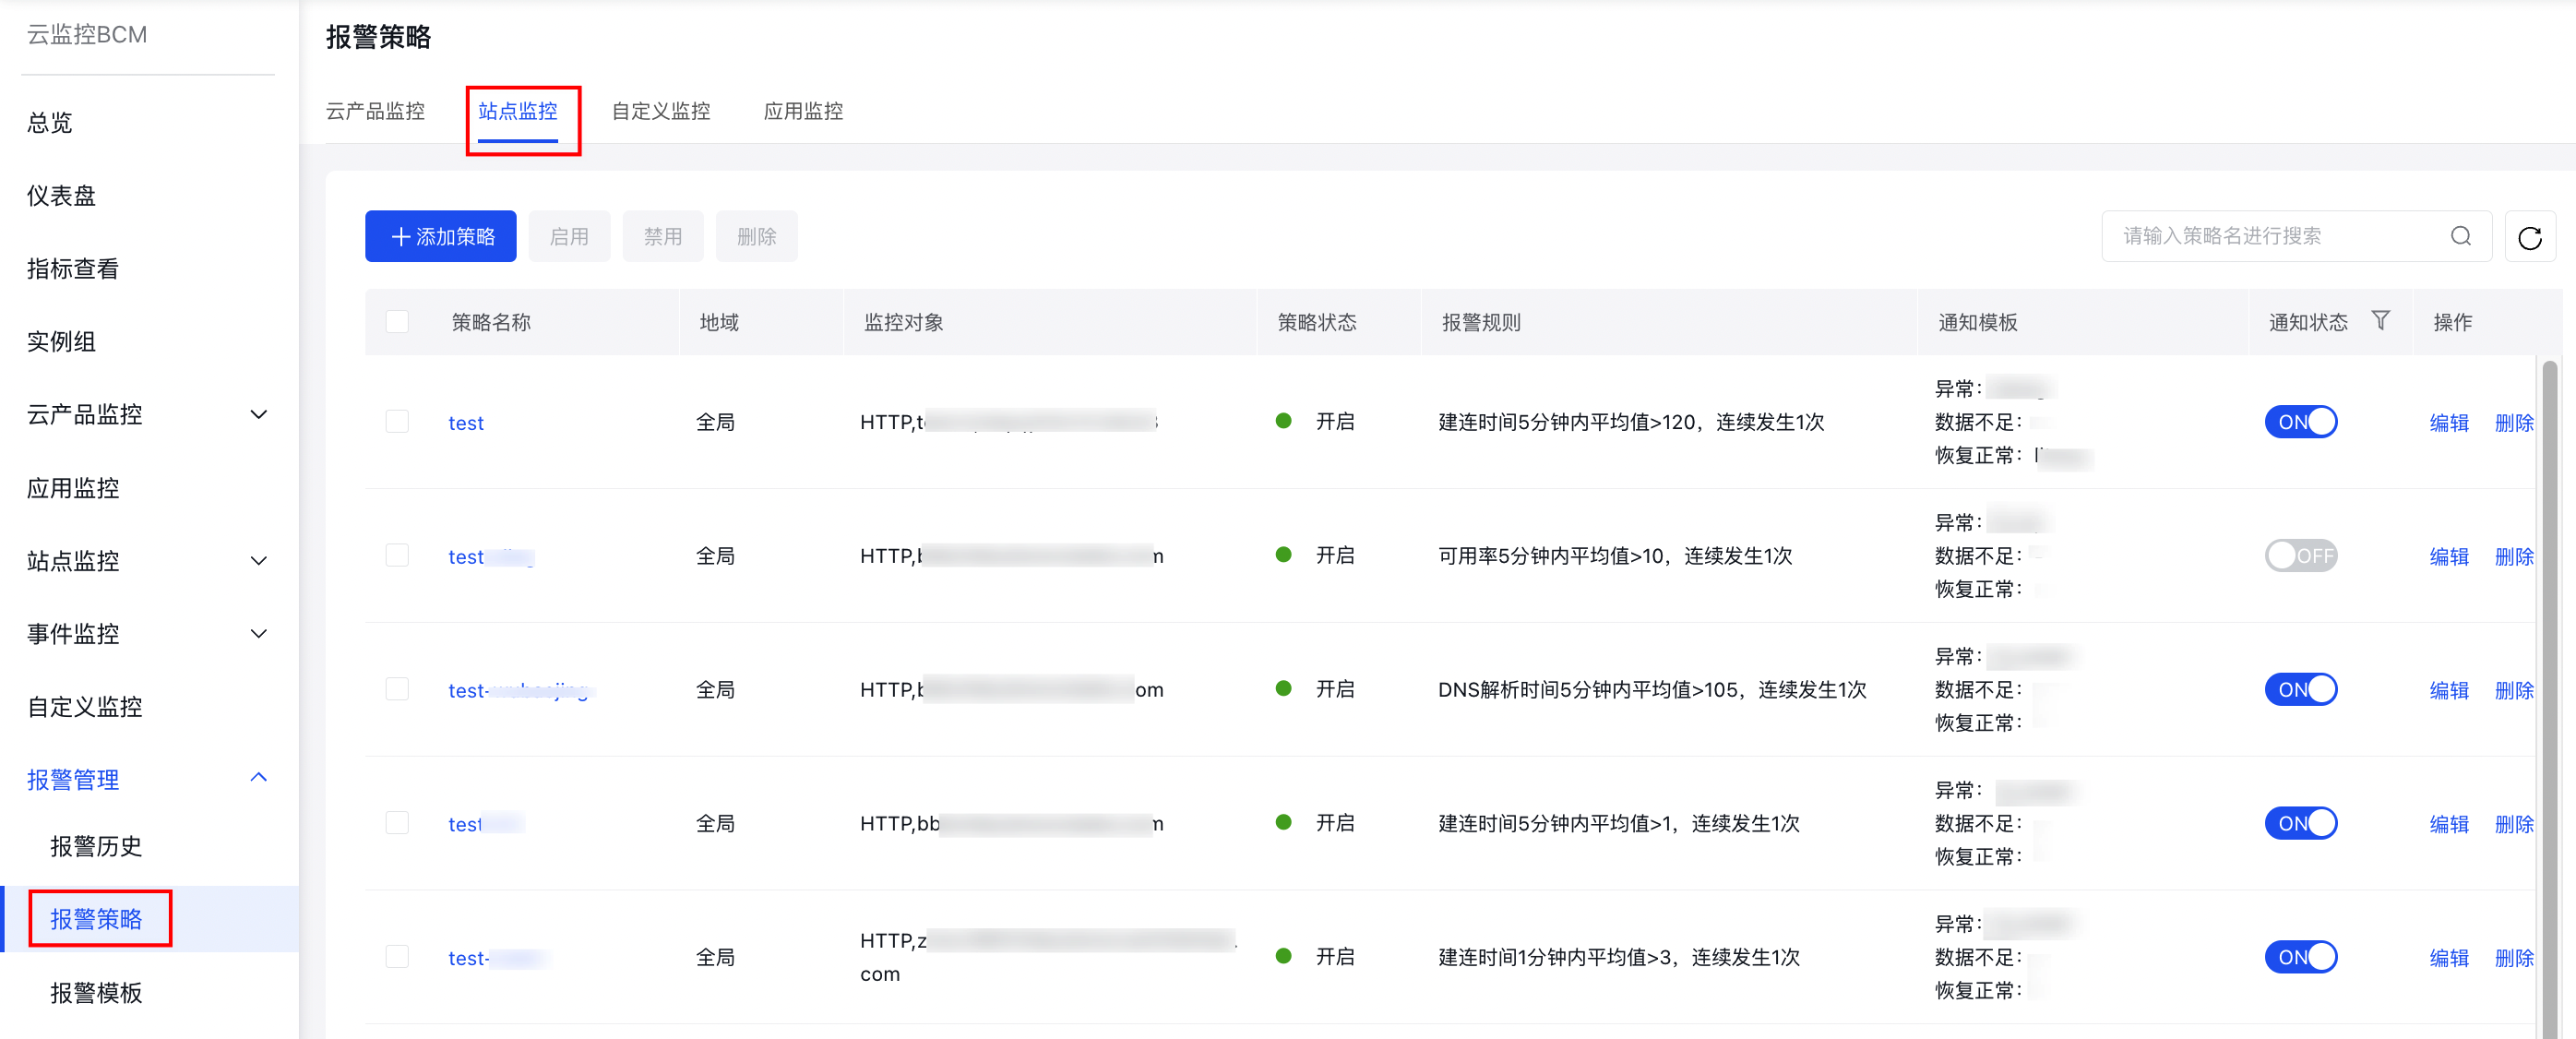
- View Alarm History of Site Monitor under Alarm Management