
View monitoring
View via console
Click the "Monitor" button next to an EIP instance on the details page to view monitoring charts such as public network bandwidth and traffic monitoring information.
By default, the system gives the monitor information within the last hour. To view more information, click the dropdown list to switch the time range, as shown in the following figure:
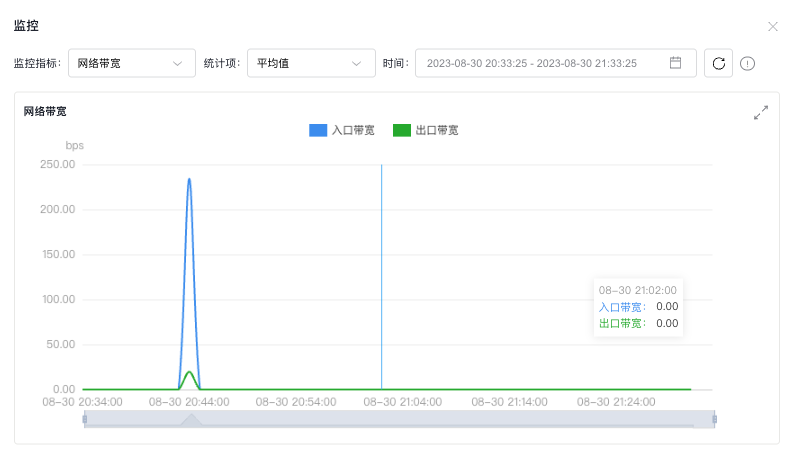
EIP instance monitor information, including:
- Ingress/egress bandwidth refers to the instantaneous bandwidth of an EIP instance in the ingress and egress directions, measured in bits per second.
- Ingress traffic denotes the incoming traffic from users visiting the site, measured in bytes per minute.
- Egress traffic represents the outgoing traffic from the site to users, measured in bytes per minute.
- Ingress/egress packet rate indicates the number of data packets transmitted per second in the ingress or egress direction of an EIP instance, measured in pps.
- Ingress/egress bandwidth utilization shows the ratio of actual service bandwidth to the maximum bandwidth limit, expressed as a percentage.
- Ingress/egress gateway packet loss rate indicates the percentage of packets lost compared to total packets for EIP instance ingress/egress traffic, expressed as a percentage.
The system generates monitoring data every minute. Users can analyze statistics across various dimensions by adjusting "statistic items" and "statistic period." For instance, if the "statistic period" is set to 1 hour, 60 data points will be aggregated. If "statistic" is set to average, the system will display the hourly average based on those 60 data points.
Available statistic periods include 1 minute, 5 minutes, 10 minutes, 15 minutes, 30 minutes, and 1 hour.
Statistic items include:
- Average: The average value of all data points within the sampling period.
- Sum: The total value of all data points within the sampling period.
- Maximum: The highest value among all sampling points within the sampling period.
- Minimum: The lowest value among all sampling points within the sampling period.
- Sample count: The total number of samples recorded within the sampling period.
View via API
For API details, refer to Baidu Cloud Monitor (BCM)[ Query Data Interface](BCM/API Reference/Query Data API.md).
For obtaining EIP monitor request parameters "scope", "metricName" and "dimensions", please refer to the following table:
| scope | metricName | dimensions |
|---|---|---|
| BCE_EIP | WebInBytes traffic from Internet WebOutBytes traffic to Internet WebInBitsPerSecond ingress bandwidth WebOutBitsPerSecond egress bandwidth WebInPkgCount egress packet rate WebOutPkgCount egress packet rate |
InstanceId EIP instance ID |