Generate Chart Through Query Panel
The query panel allows users to filter the current data and generate charts. Specific operating steps are as follows:
- Select Product Service > Time Series Database TSDB, and enter the Database List page.
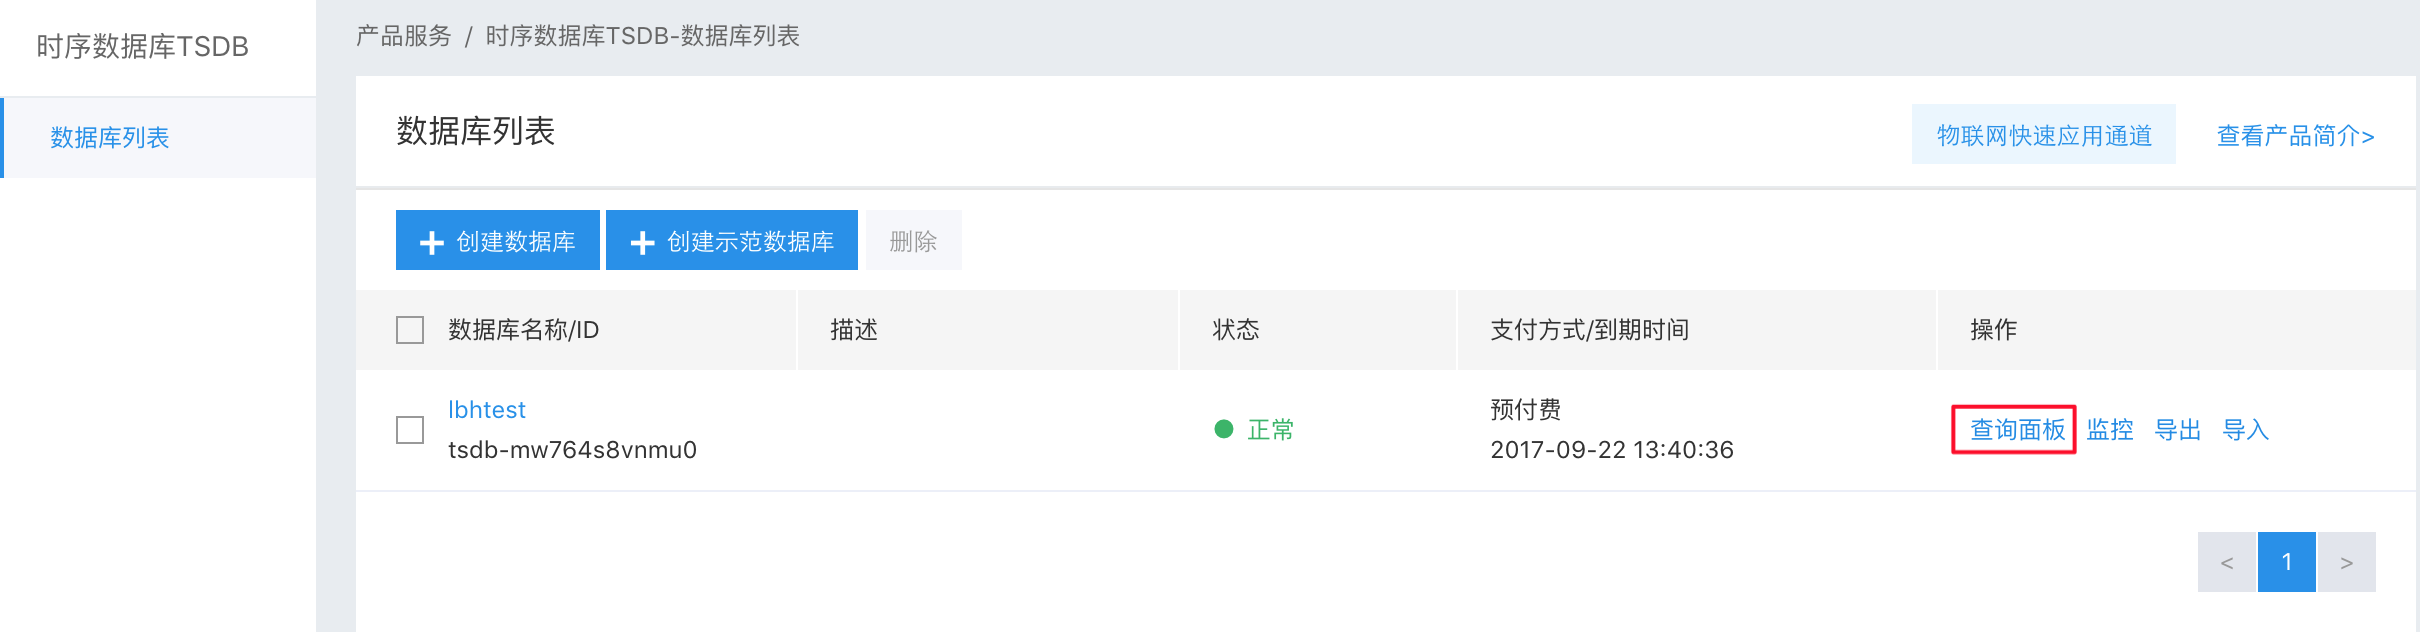
- Find the corresponding database in the Database List, and click Query Panel to enter the operating interface.

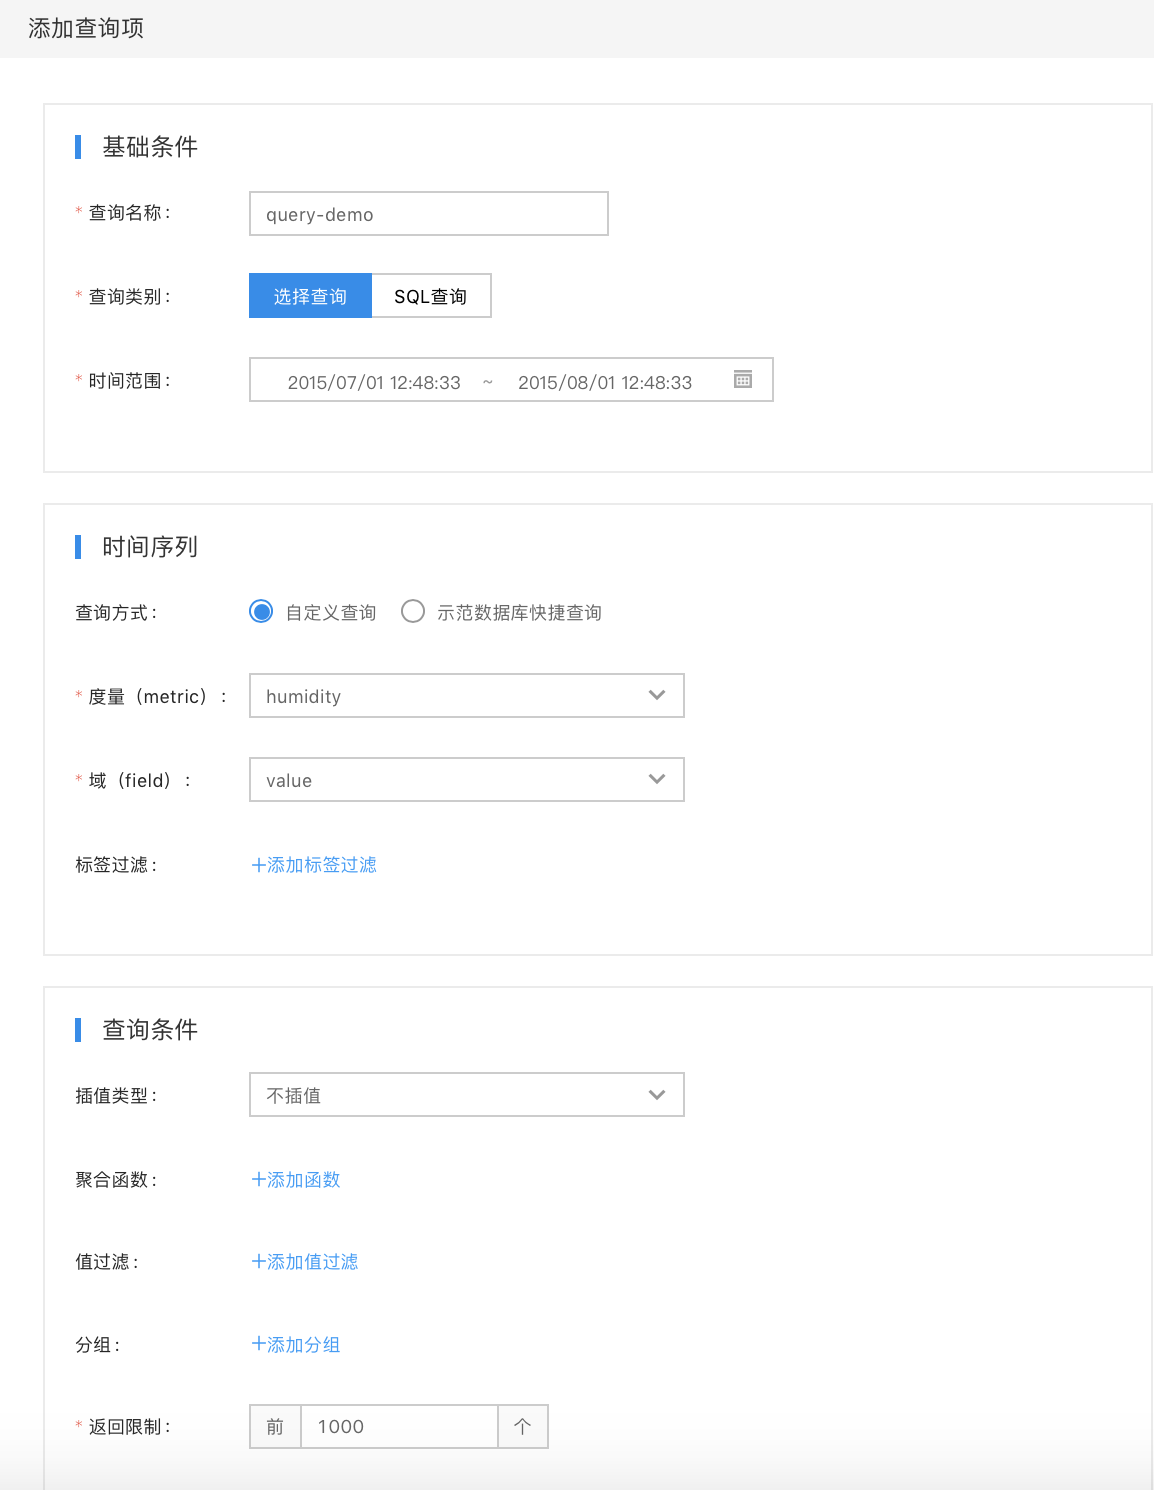
- Click Add Query Items in the query panel to configure the parameters to query.
When the chart is generated, the logic that the system processes the data is as follows:
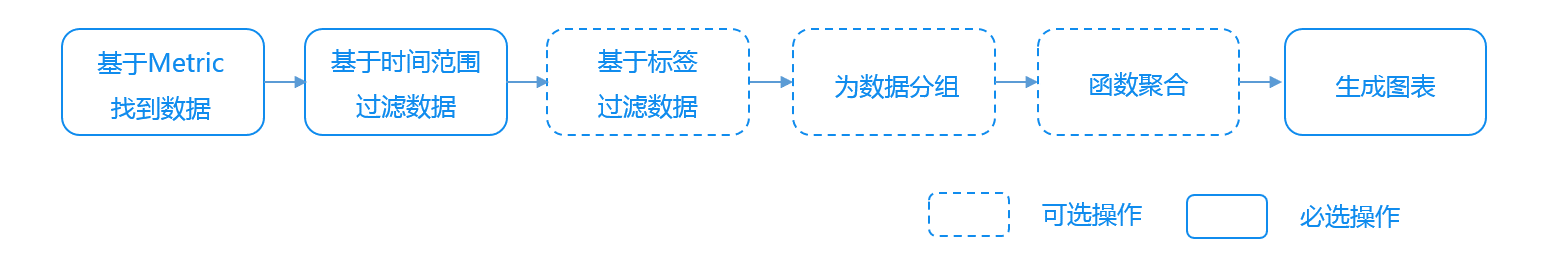
- Time range setup: Support "Absolute Time" and "Relative Time"
- Name: Select the Metrics name already in the current database from the drop-down list, and click Add to add multiple Metrics for data comparison.
- Tag filtering: Designate a tag to filter the data.
- Value filtering: Filter data points based on a specified range of values, and show only the specified data points.
- Group: Group the data that carries the specified tag into a single group based on "Tag". Multiple tags can be input. Data can be grouped into groups, and the system generates charts for each group of data.
-
Aggregator: Process the data with built-in functions. Multiple functions can be added, and the system applies functions to each group in order. The currently supported aggregators include:
- Avg: Select an average value of values within each sampling time range as a result
- Count: Select the number of points within each sampling time range as a result
- Dev: Select a standard deviation of values within each sampling time range as a result
- Diff: Select a difference between each two adjacent values as a result
- Div: Select a value of one divisor divided by each value as a result
- First: Select the first value within each sampling time range as a result
- Last: Select the last value within each sampling time range as a result
- LeastSquares: Fit the values within each sampling time range by using the least squares method
- Max: Select the maximum within each sampling time range as a result
- Min: Select the minimum within each sampling time range as a result
- Percentile: Select the p percentile of value within each sampling time range as a result.
- Sum: Select the sum value of values within each sampling time range as a result
- Scale: Select a value of multiplying each value by one multiple as a result
- Rate: Select the change rate of each two adjacent values in unit time (see parameter timeUnit) as a result
- Return limits: The system returns a specified number of data points to generate a chart with a maximum of 10000.
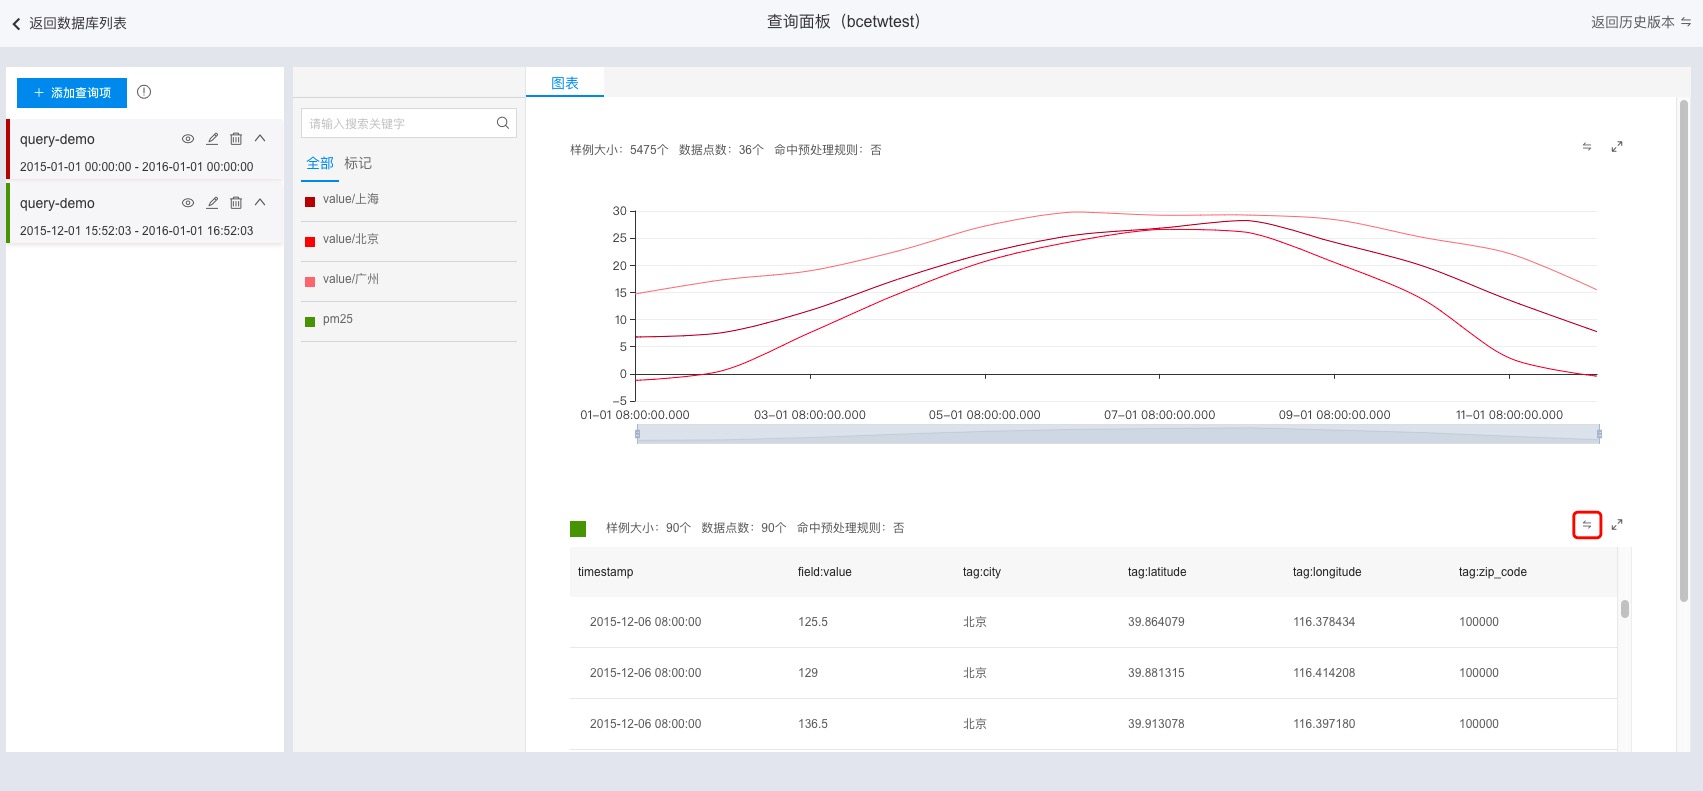
- Click OK and the system filters the data and generates a chart based on the configuration. You can switch between "Figure" and "Table" in the upper right corner of the chart. See Generate a Demonstration Database Chart for examples.
Note:
If a single query time exceeds 50s, the system automatically terminates the query. If a query timeout occurs, you can do the following to optimize the query:
- Reduce the number of queries in a single request
- Reduce the interval between start and end times in a single query
- Reduce the number of time series involved in a single query
- Preprocess the data
When the amount of data stored in TSDB is large, it takes a long time to filter the data out according to rules specified by users, which may result in a time-out of the request and a query failure.
In this case, you can preprocess the data, filter and aggregate the relevant data in advance, to quickly return query results. For preprocessing configuration methods, see Data Preprocessing
View Preprocessing Results
After the preprocessing rule is established and has taken effect, the user needs to establish a query viewing result in the query panel according to the Condition in view of the preprocessing results. The following is a query example based on a preprocessing rule established by a demonstration database.
- Select Product Service > Time Series Database TSDB > Database Name, and enter the database details page.
- Click database name, and enter the database details page. Click Preprocessing tab to enter the configuration page.
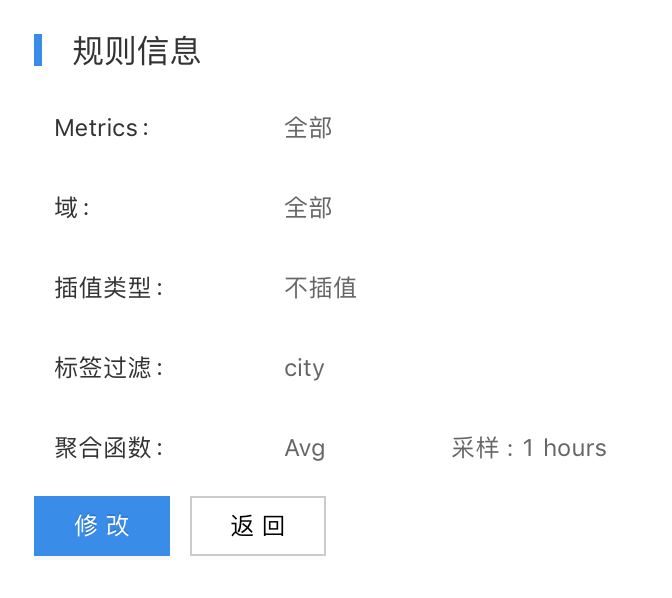
- Click Query Details to view preprocessing rules.

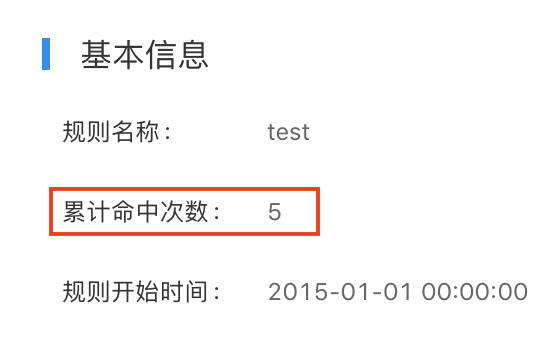
Pay attention to the conditions in the rule information column when the preprocessing rules are viewed, to avoid an invalid hit of preprocessing rules after an query is performed.
- Return to database list, and click Query Panel.
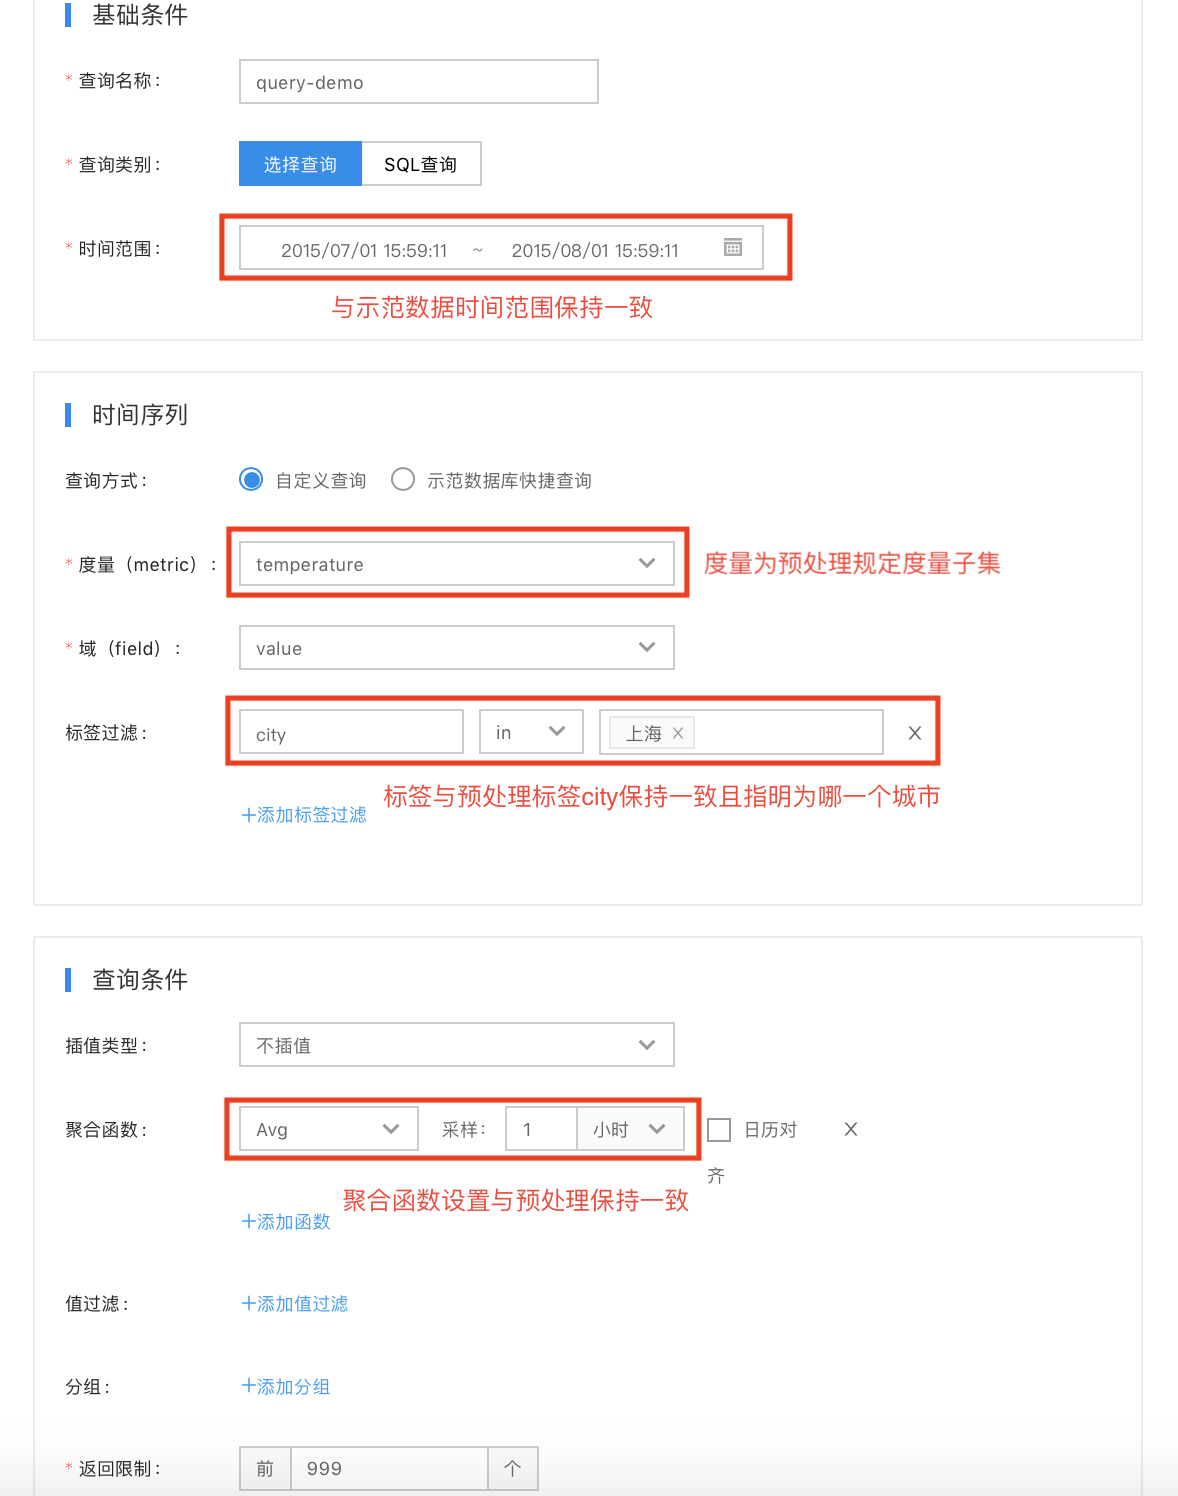
- Click Add Query Items in the query panel page to configure the query items based on the preprocessing rules.
- View the generated result, at which point the preprocessing rule has been hit (highlighted).
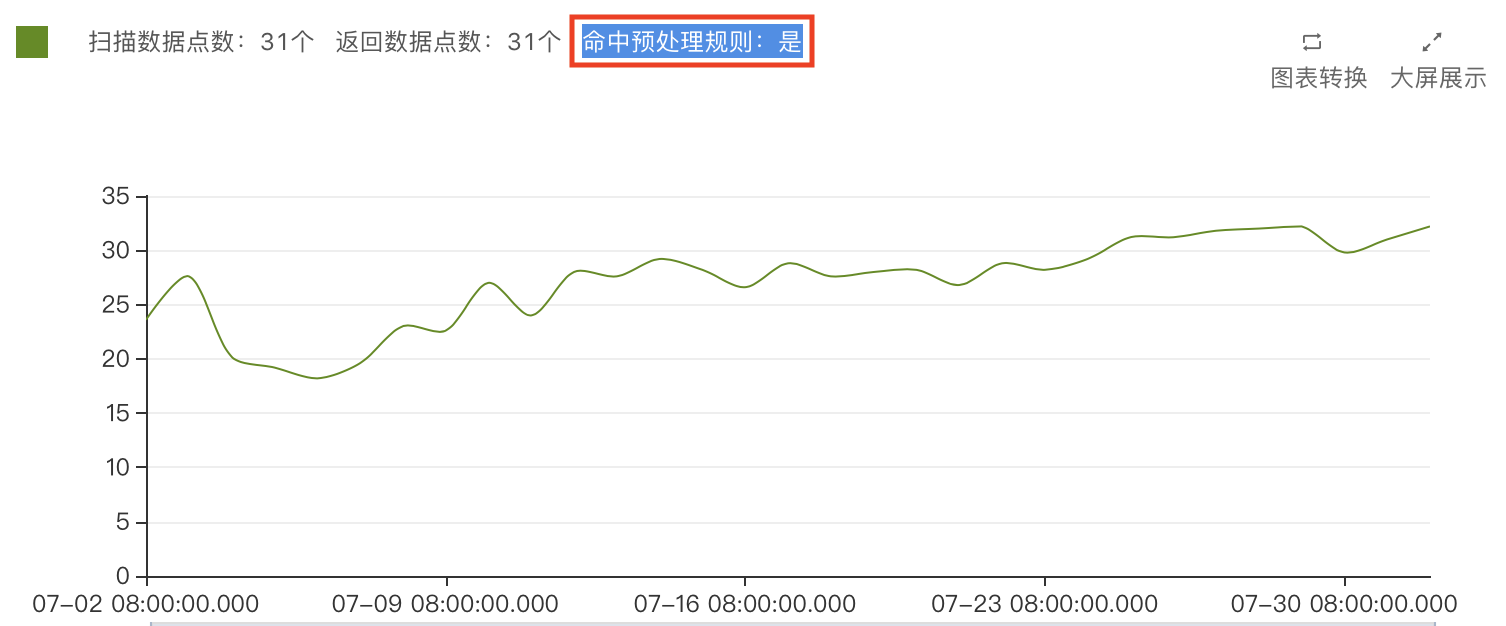
- You can return to the preprocessing query details page again to see cumulative hits.
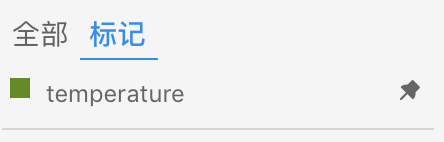
Tag
If too many query items are established in the query panel, you can select query items that are marked important, to view the query items in the tag column.
- Select Product Service > Time Series Database TSDB > Database Name, and enter the database details page.
- Click Query Panel to enter the query page.
- Select any query item in the query list, and notice the nail pattern on the right.
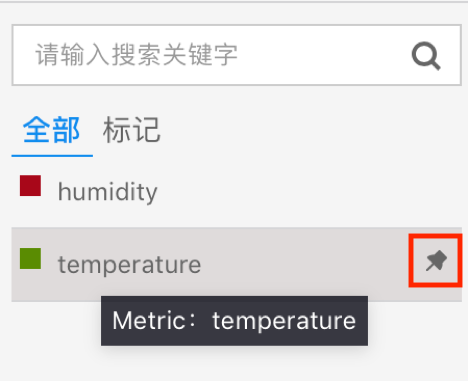
- Click the pattern to tag the selected query item.
- View tagged query items in the "Tag" column.