Monitoring and Alarm
Last Updated:2021-05-12
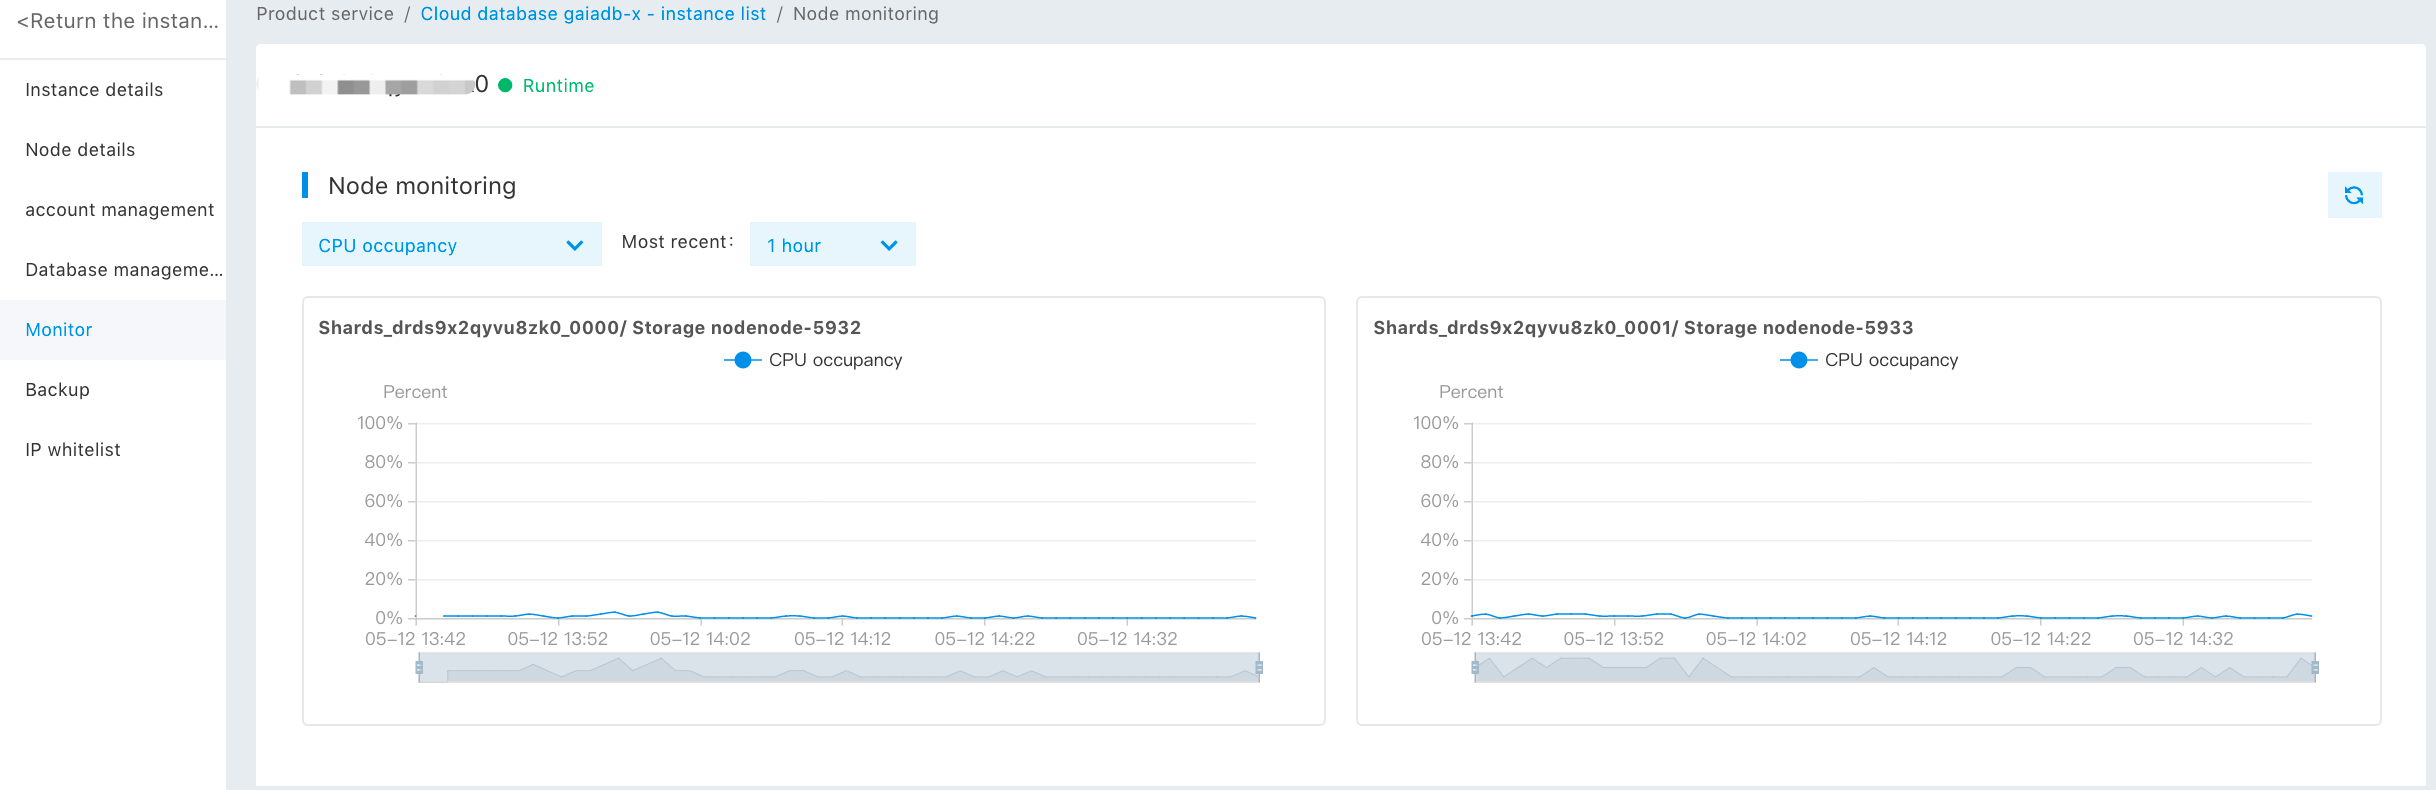
On the "Monitoring" page of the instance, you can see the detailed monitoring trend chart for each multipart of the DRDS instance.
The DRDS monitoring trend chart includes CPU occupation rate, disk usage rate, memory usage rate, and linking number of each multipart. You can query them according to different time dimensions.