
Operation Configuration
This tutorial will guide you to obtain the log function of container applications on the Cloud Native Application Platform (CNAP) and set the log metric monitoring feature.
Set Application Log
Overview
The Cloud Native Application Platform (CNAP) supports the configuration of log policies for container applications. By configuring the log policy, users can collect the standard output logs of the container and the internal application logs of the container, and output them to the Elasticsearch component of CNAP or the external Elasticsearch service, so as to analyze the logs or store them for a long time.
Operation steps
1.Create a deployment group on the application page (it can also be modified according to an existing deployment group)
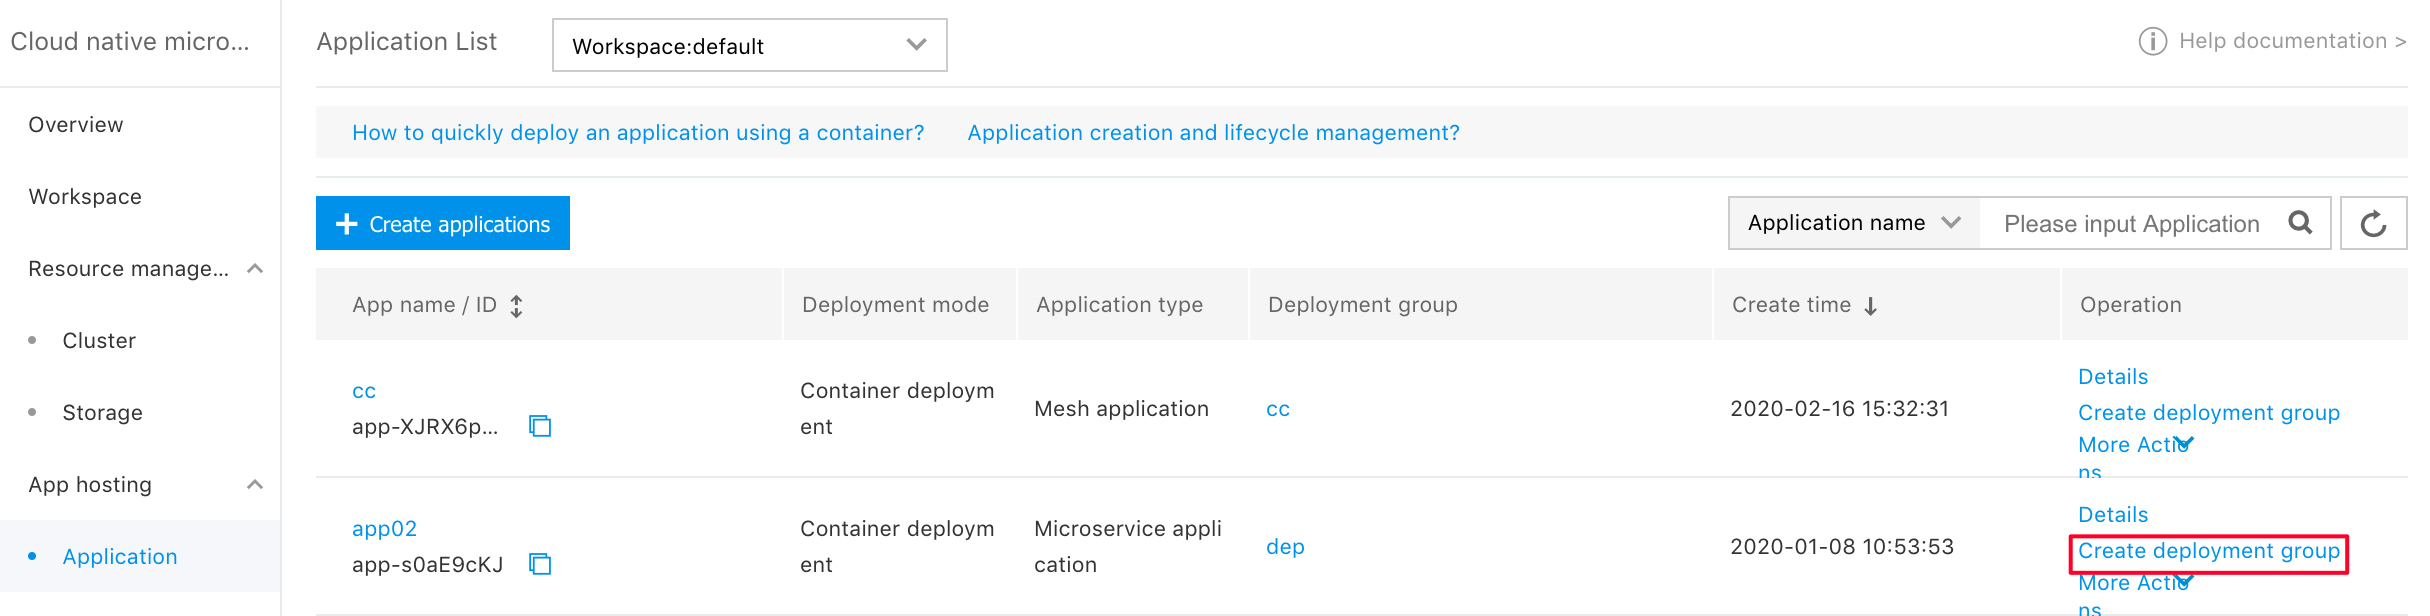
2.Create Deployment Group -> Deployment Configuration: For details, refer to Create Application
3.Click [Next] to go to the operation configuration
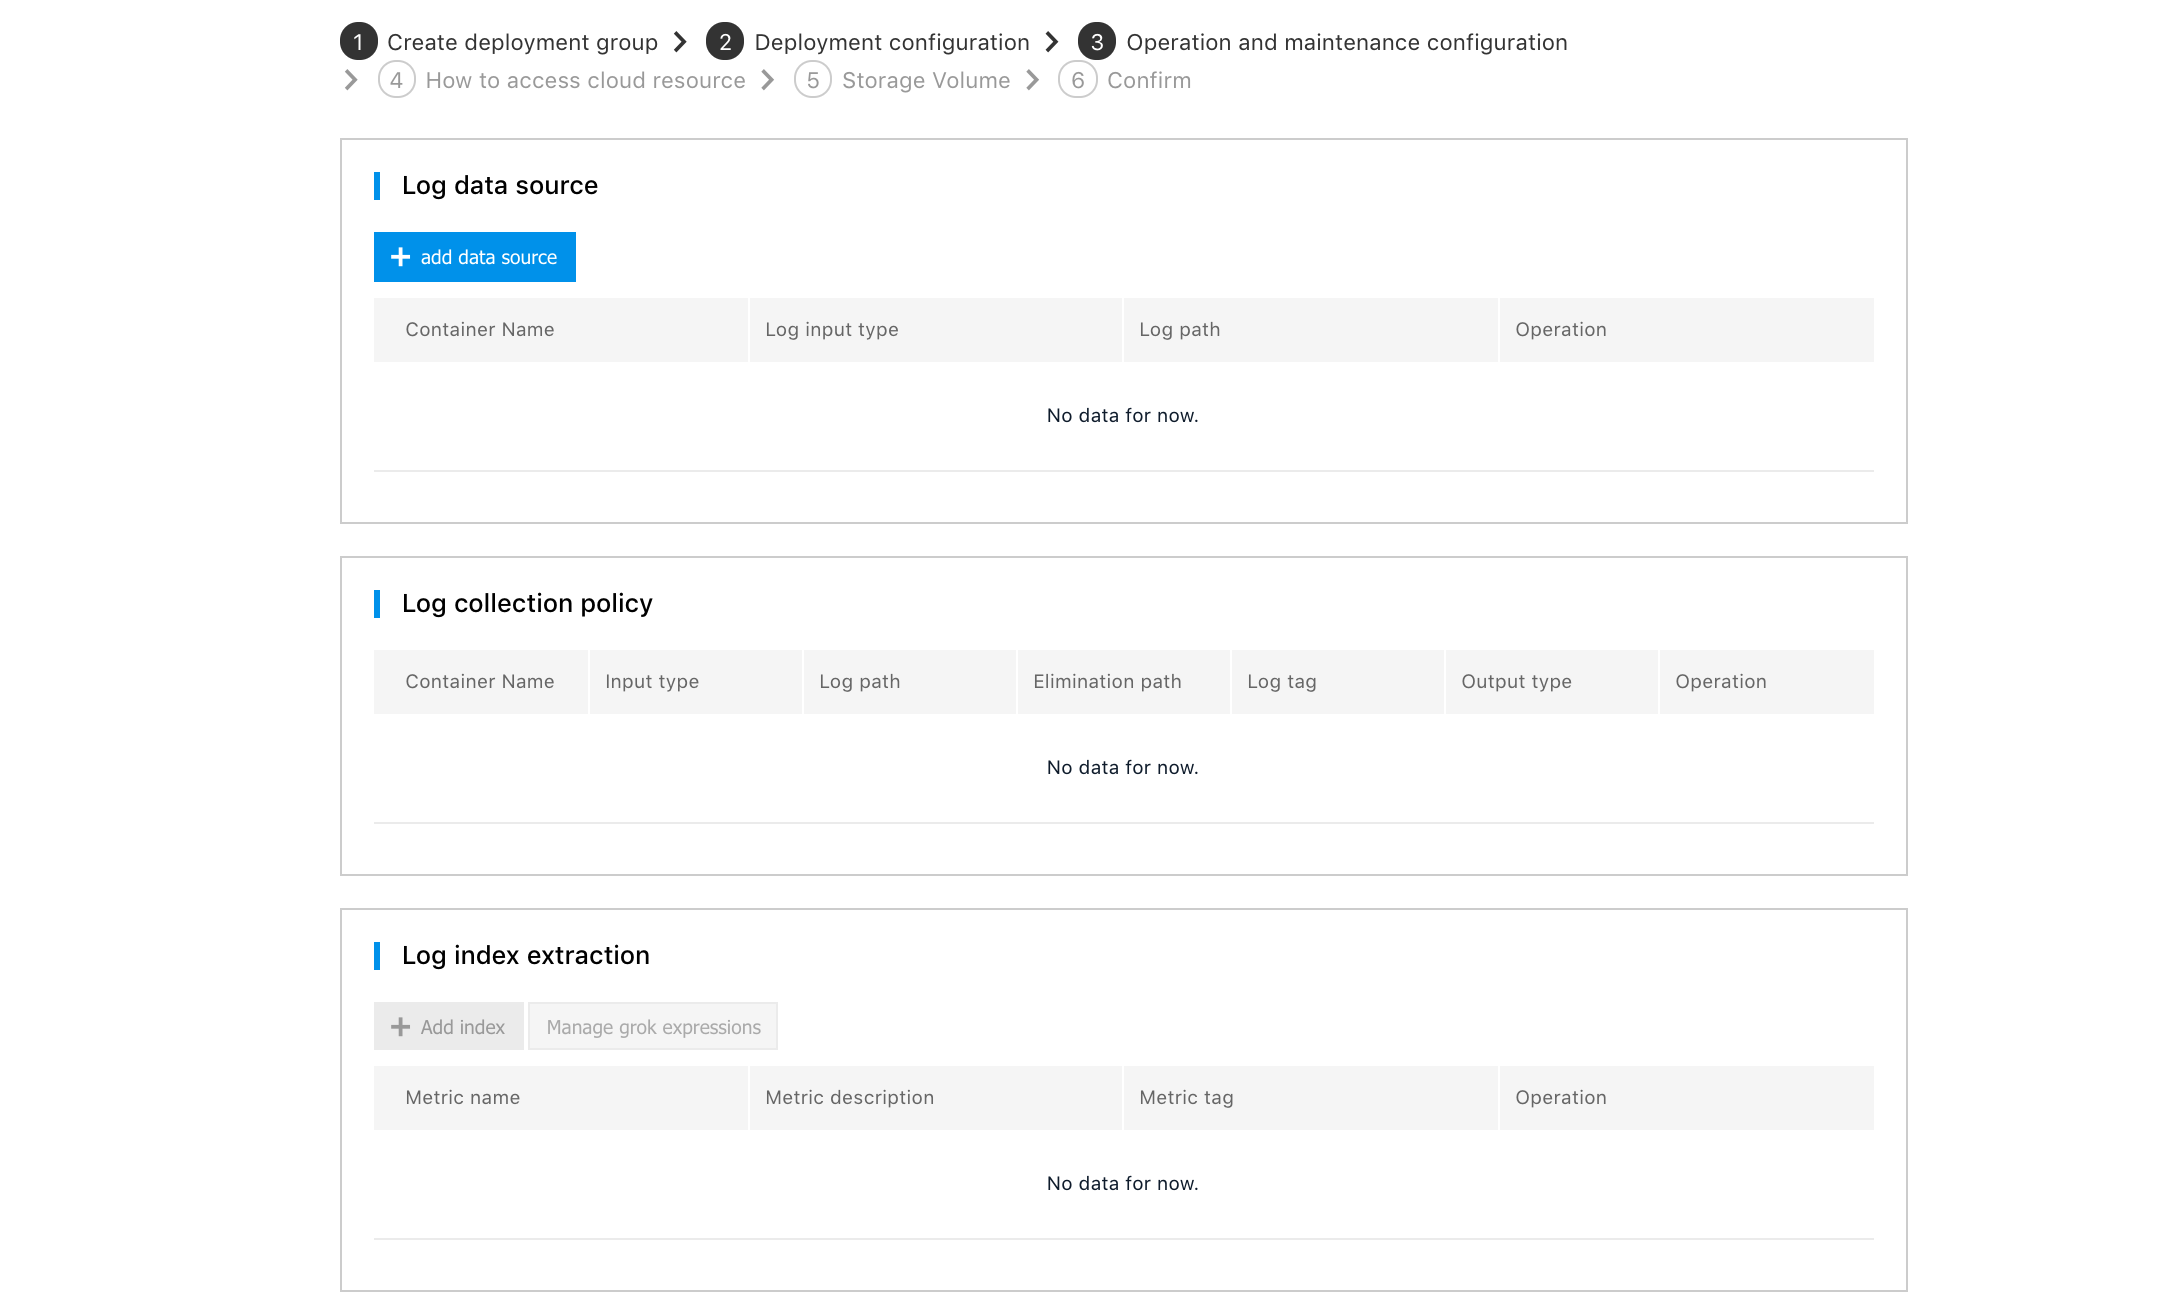
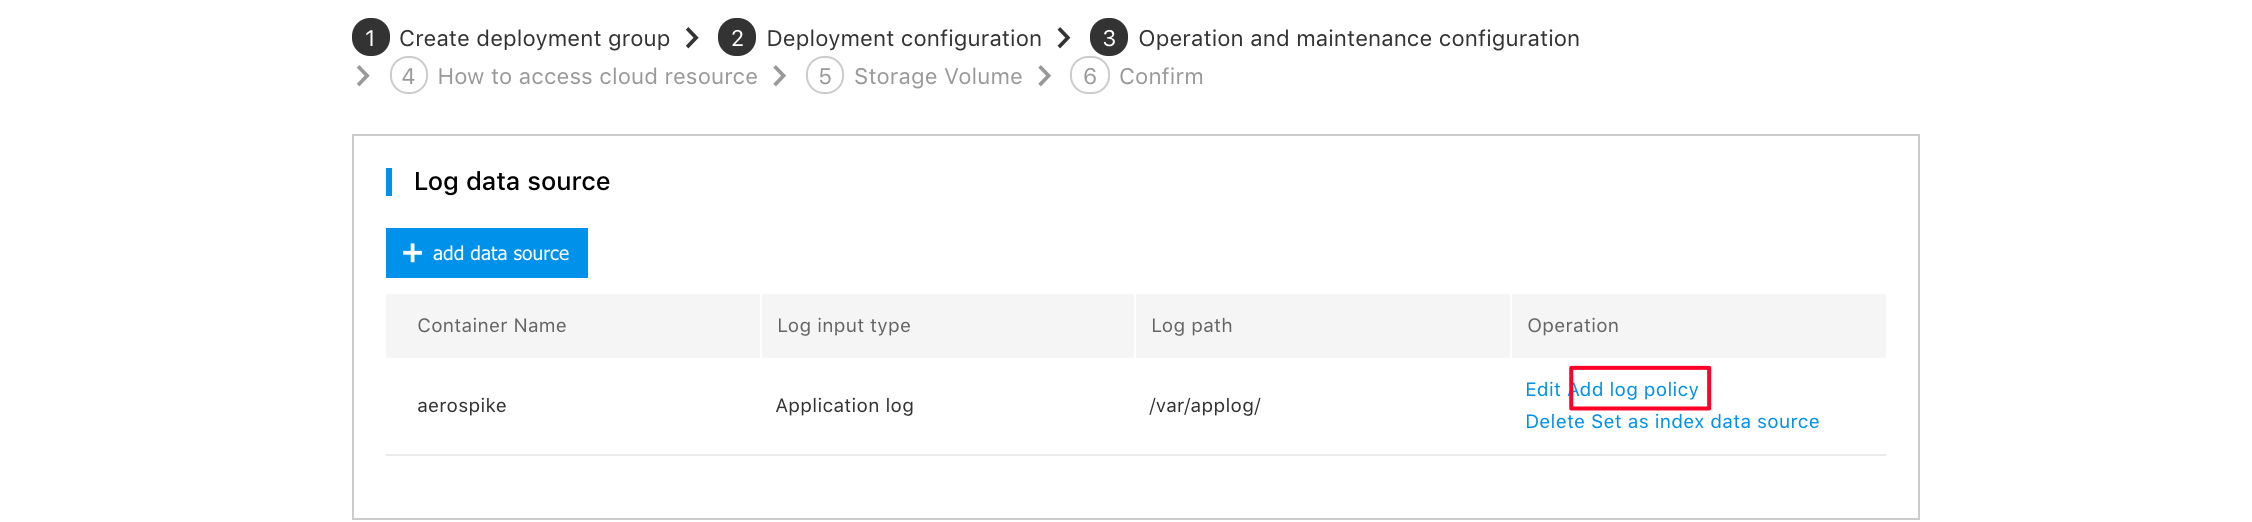
4.Click [Add Data Source],
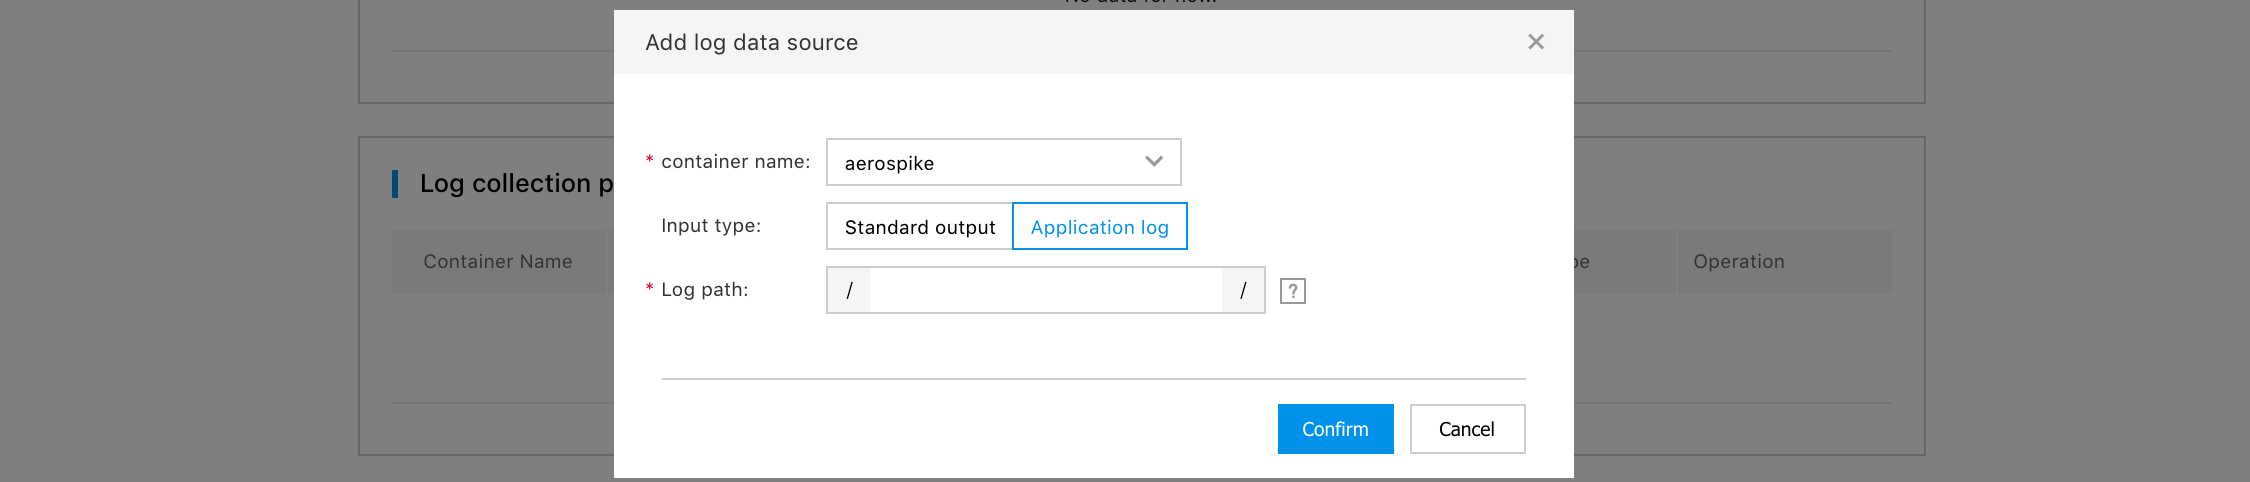
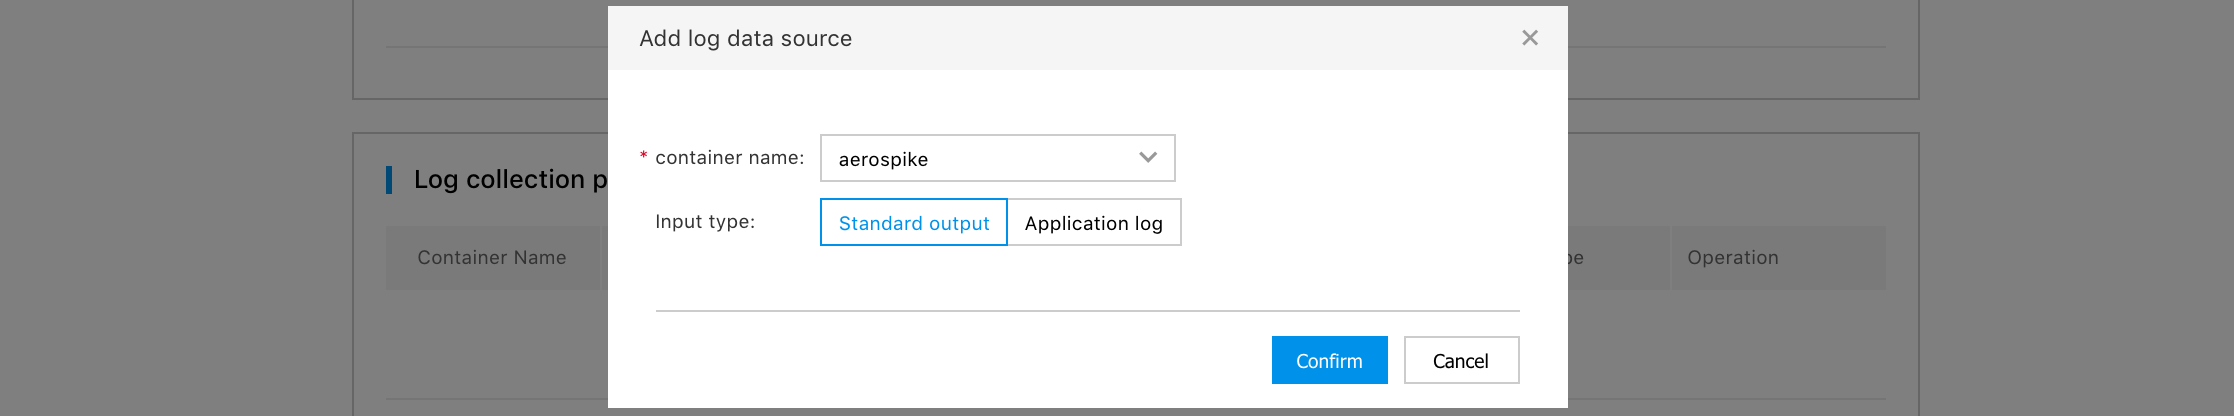
- Container name: Specify the container that needs to collect logs. The name is set in the [Deployment Group Configuration].
- Input type: Specify the output format of the logs to collect in the container. Standard output It means to collect the standard output log of the container. Application log It means to collect logs output from the user container to the specified file. When selecting Application Log, you also need to enter the directory (absolute directory) where the log file to collect is located. Click [OK] to complete the Log Data Source setting. Click [Edit] to edit each set data source again.
- To collect logs from multiple containers or to collect logs from multiple directories of one container, you only need to add multiple data sources.
Note:
- The directory filled in when collecting application logs inside the container is the path where the log data volume is mounted to the application, and the application should write the logs into this directory.
- The filled-in directory cannot be a system directory, such as "/", "/var/run", etc., which will cause application exceptions. It is recommended to enter the empty directory on the application. If the directory is not empty, please make sure that there are no files in the directory that affect the startup of the application, otherwise the files will be replaced, resulting in exceptional application startup and application creation failure.
5.Then click [Add Log Strategy] behind the data source that needs to collect logs
- Configure log collection policy
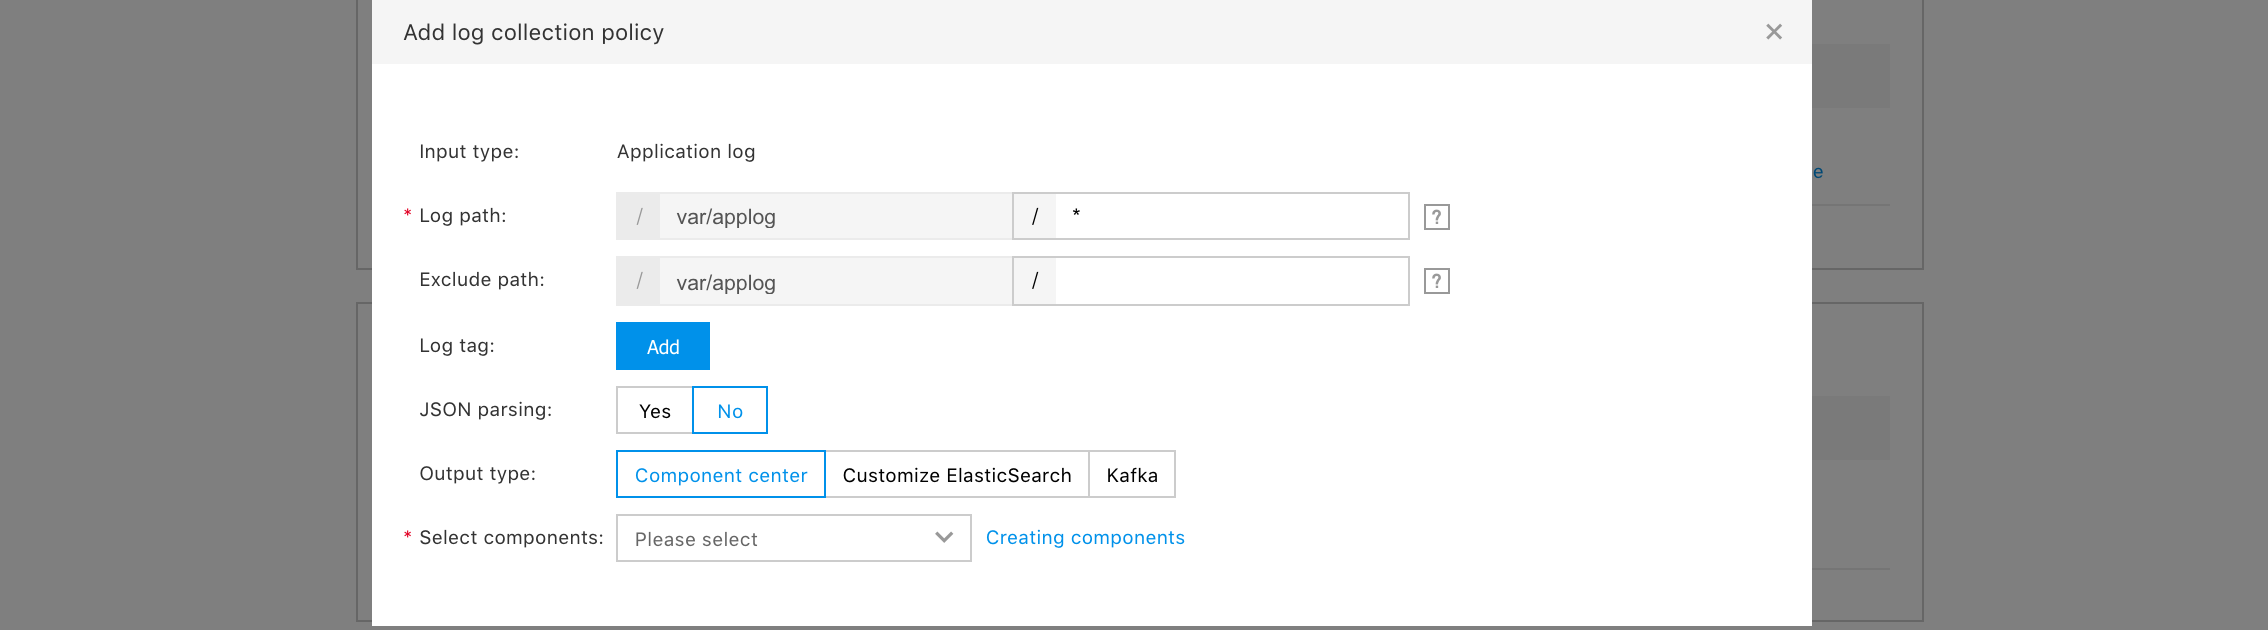
- Input type: Input type of the selected data source
- Default path: The path of the log file to collect, you can use the wildcard "*" to select all files in the directory
- Exclude path: Set the path of log files not to collect.
- Log tag: Set the tags that need to be added to the logs collected by this data source (currently it supports 5)
- json Parse: If the log content is in json format, selecting [Yes] will parse the log into json
key-value pairs. - Time field: When json parsing selects [Yes], the key of the parsing time.
- Time format: Format of the time to be parsed.
- Output type: You can choose Component Center to push the log to the ElasticSearch component (you need to create the component in advance). You can also choose Custom ElasticSearch to push the logs to your own es service. To custom ElasticSearch, you need to enter the address of ElasticSearch in the form of http(s)://IP or domain name: port number. If ElasticSearch has set a user name and password, enter "User Name" and "Password"; if it is not set, you can ignore it.
- Index: Index in ElasticSearch the log will be stored in.
Note: If you are using a custom ElasticSearch, we recommend not to push data to the indexes that already exist in ElasticSearch version 6.0 or higher. If you really need to do this, the type of the existing index needs to be set to flb_type. The case is because each index of elasticsearch version 6.0 and above only allows one value for type. The default type of CNAP platform is flb_type, and modification is not supported. For details, see issue of the official ES blog
- Log format: You can choose whether the logs to collect are Single-line Logs or Multi-line Logs.
- Log Sample: When you choose Multi-line expression, the log matches the name of the parsed form at the beginning of the line.
- Sample content : The content of the log conforming to the line beginning parsing form, when Multi-line expression is selected.
- Regular expression at the beginning of line: The regular expression of the beginning of the line which parses the multi-line log, when Multi-line Expression is selected.
Click [OK] to complete log collection policy configuration
7.View logs through kibana in [Component Center]
- Click [Component List] in the left navigation bar to select the component that the log pushes
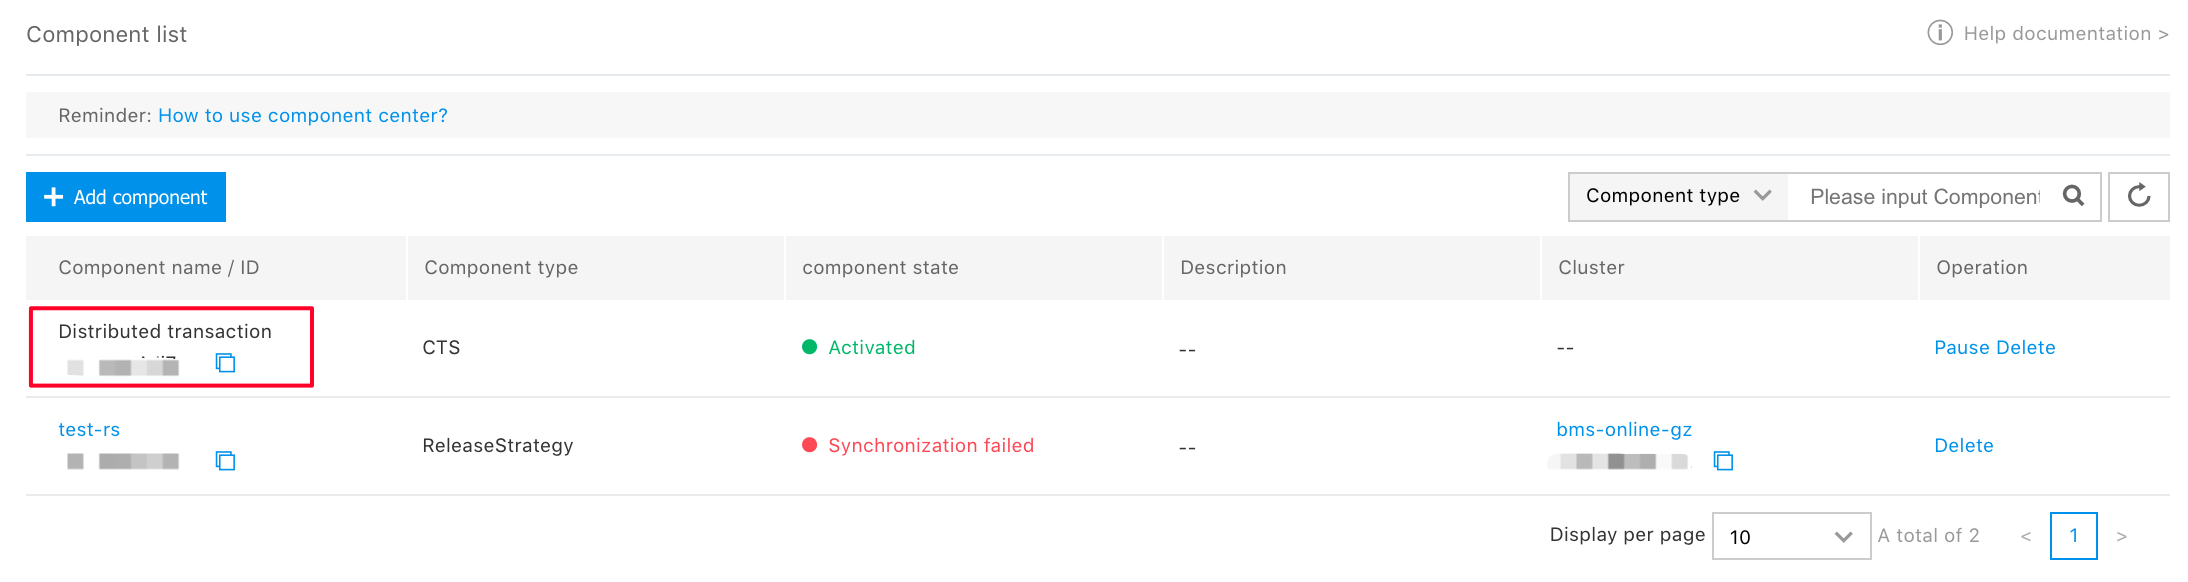
-【 Visit kibana 】
Log analysis and archive download can be done through kibana
Click [Click to access kibana]
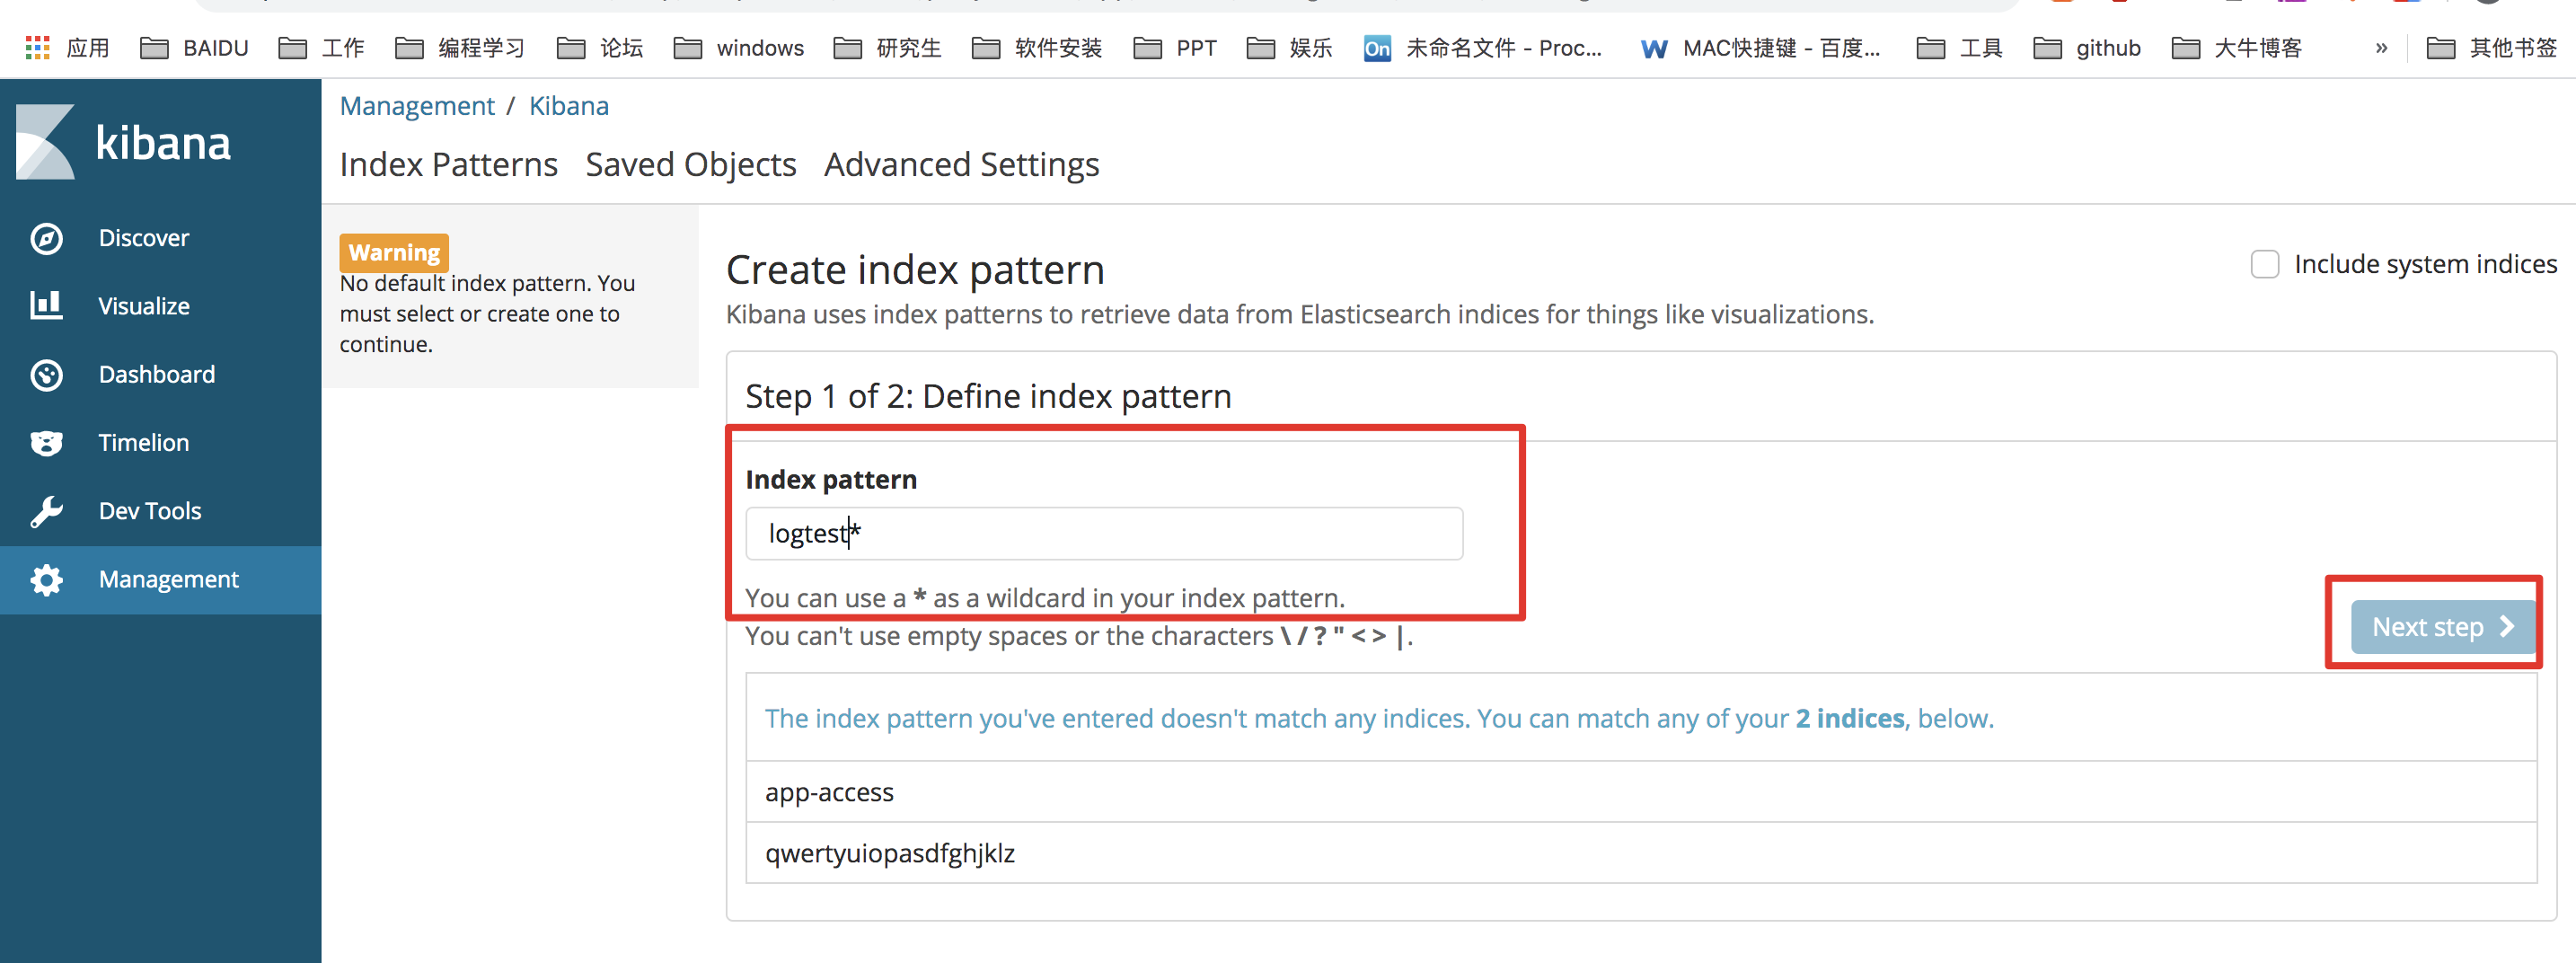
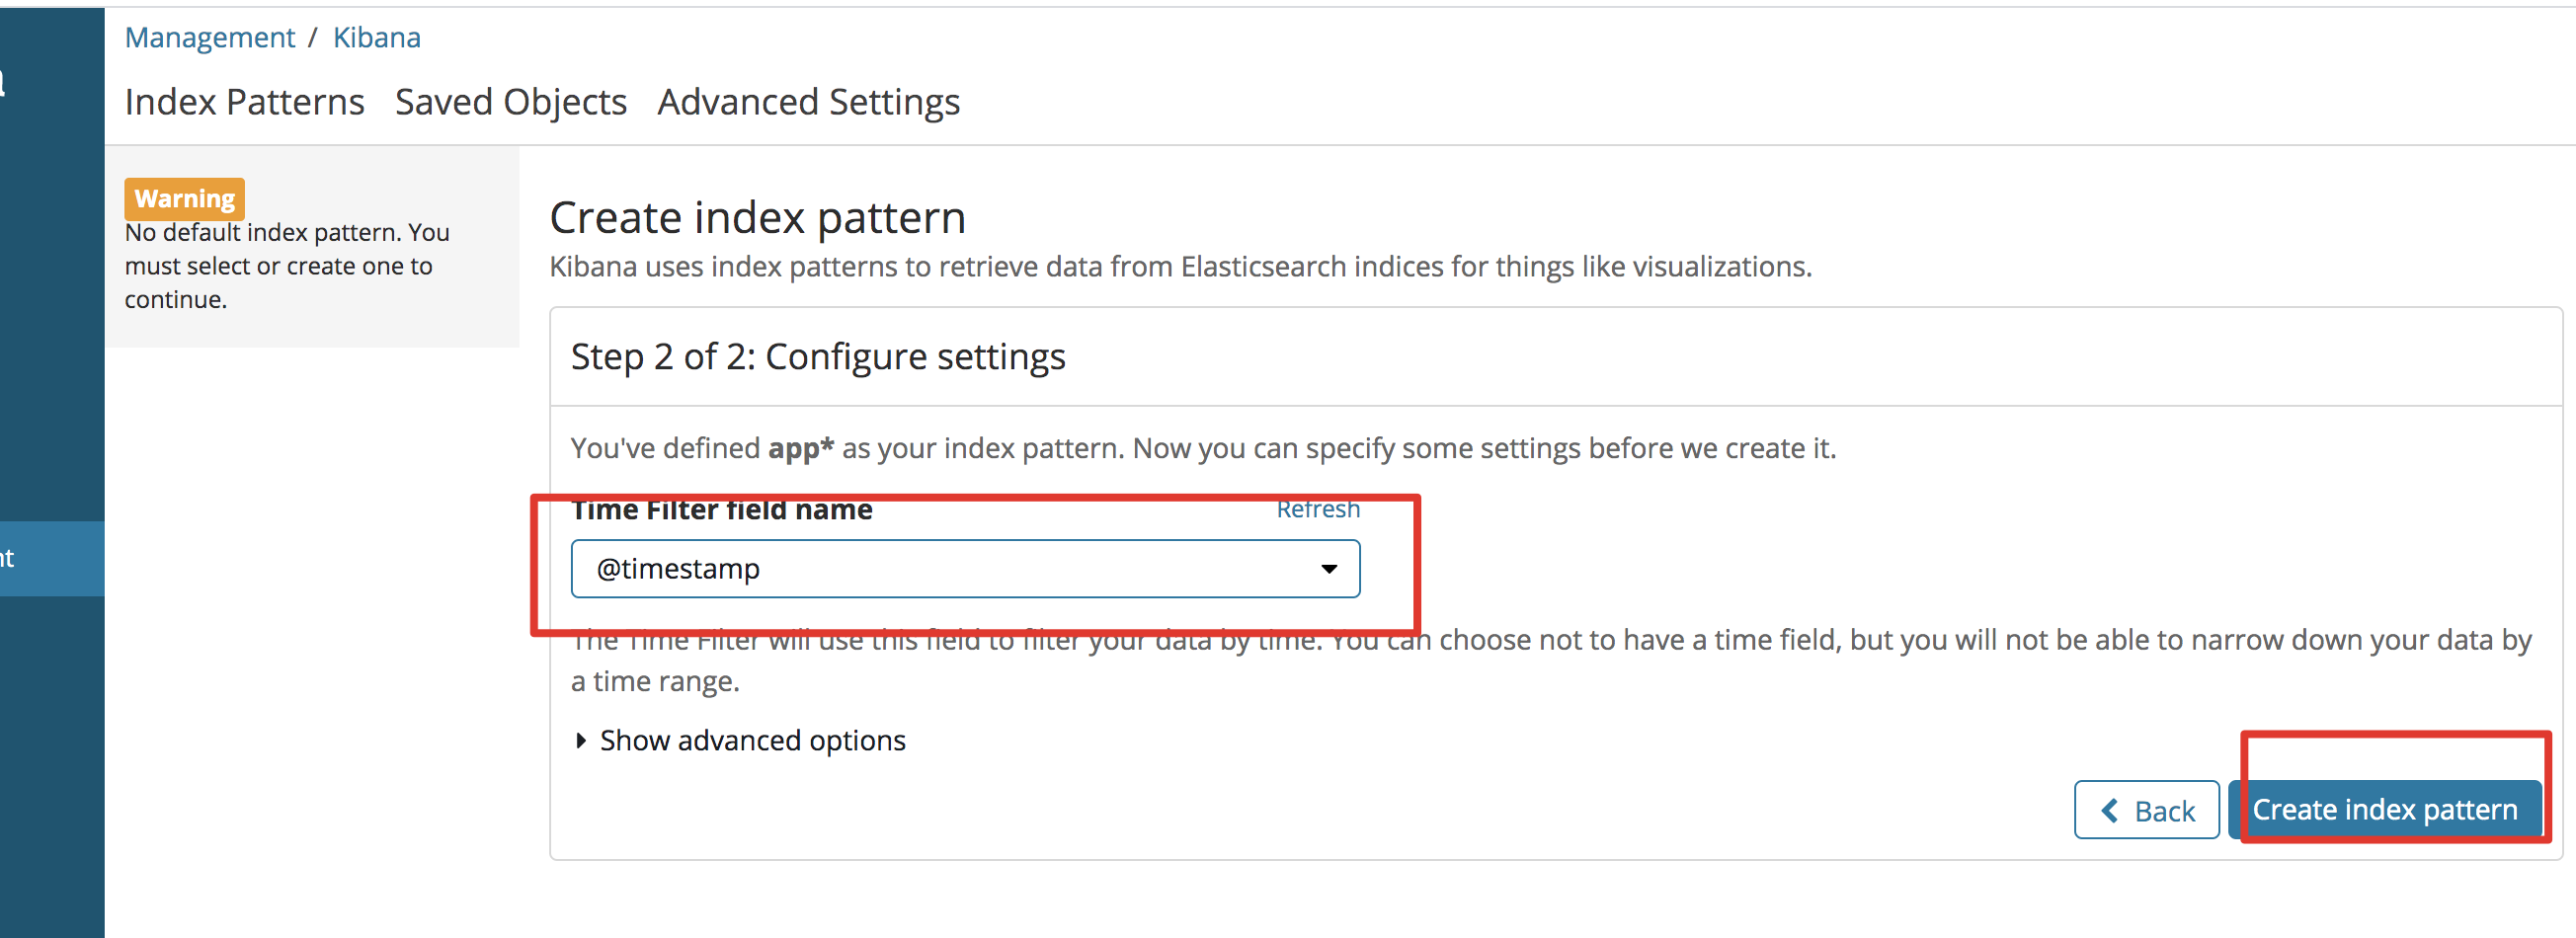
Click on the left column [Management] -> click [Index Patterns]
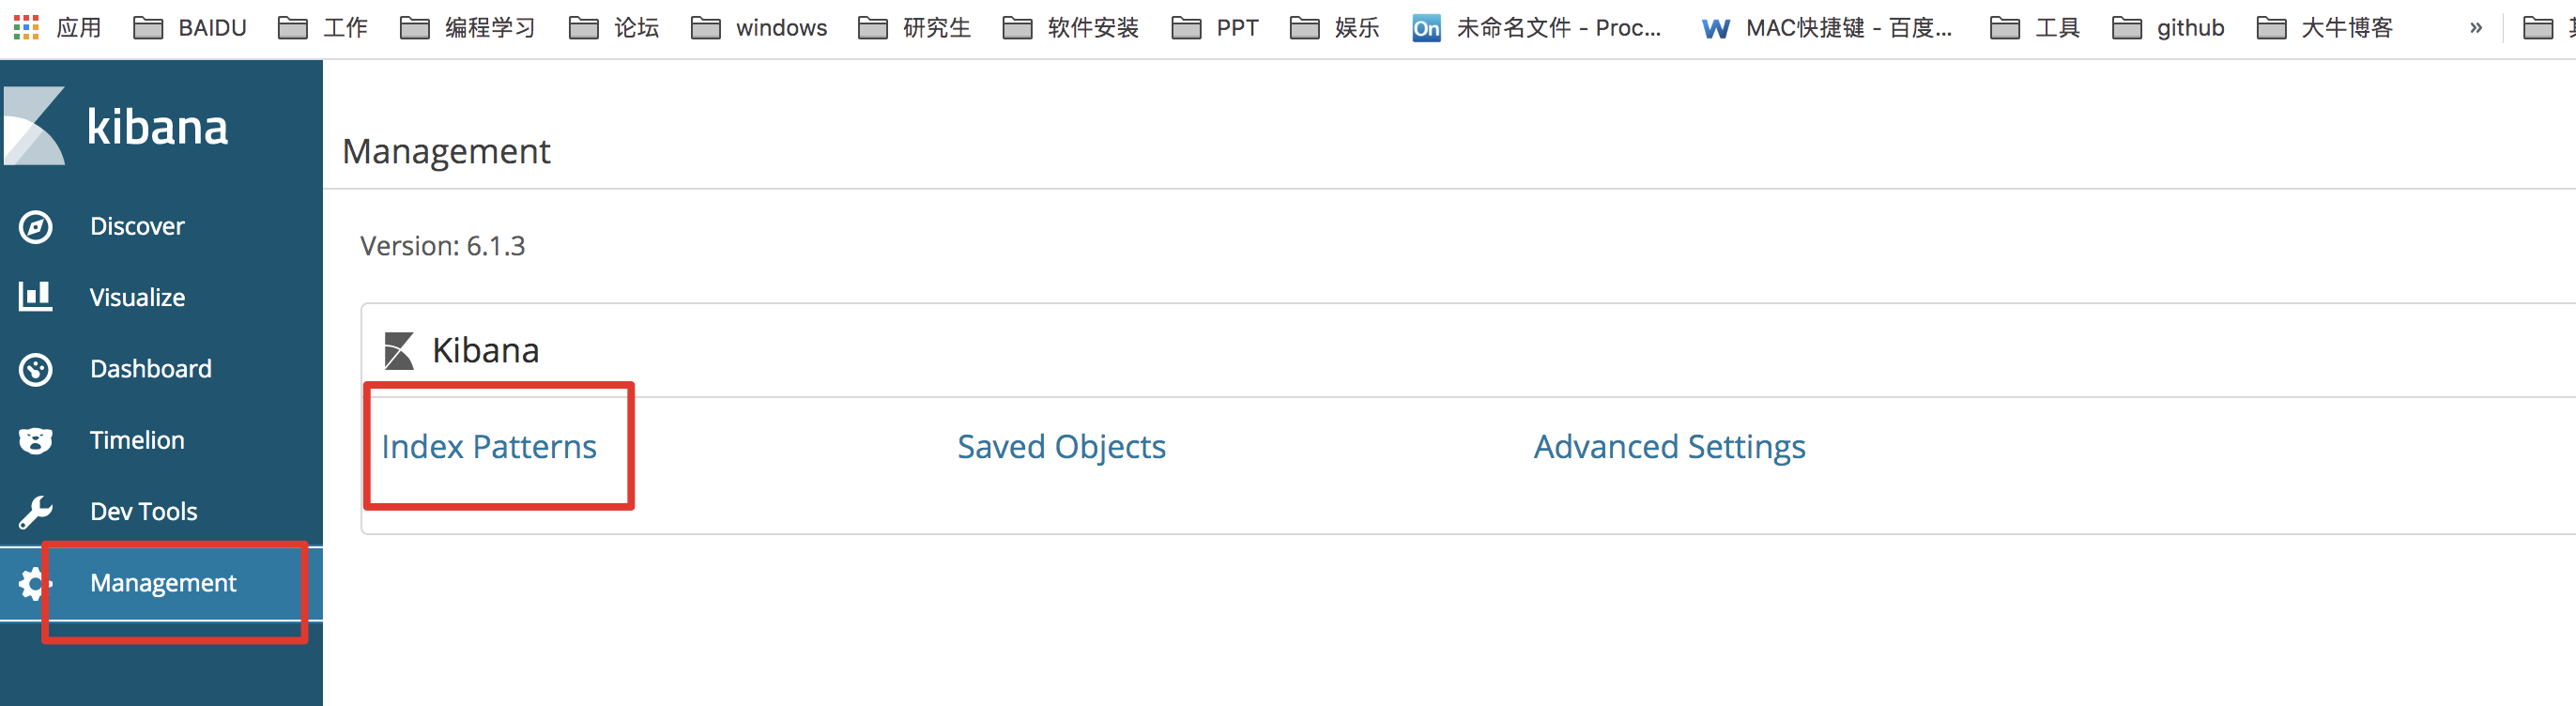
Set index matching mode to match the set index prefix
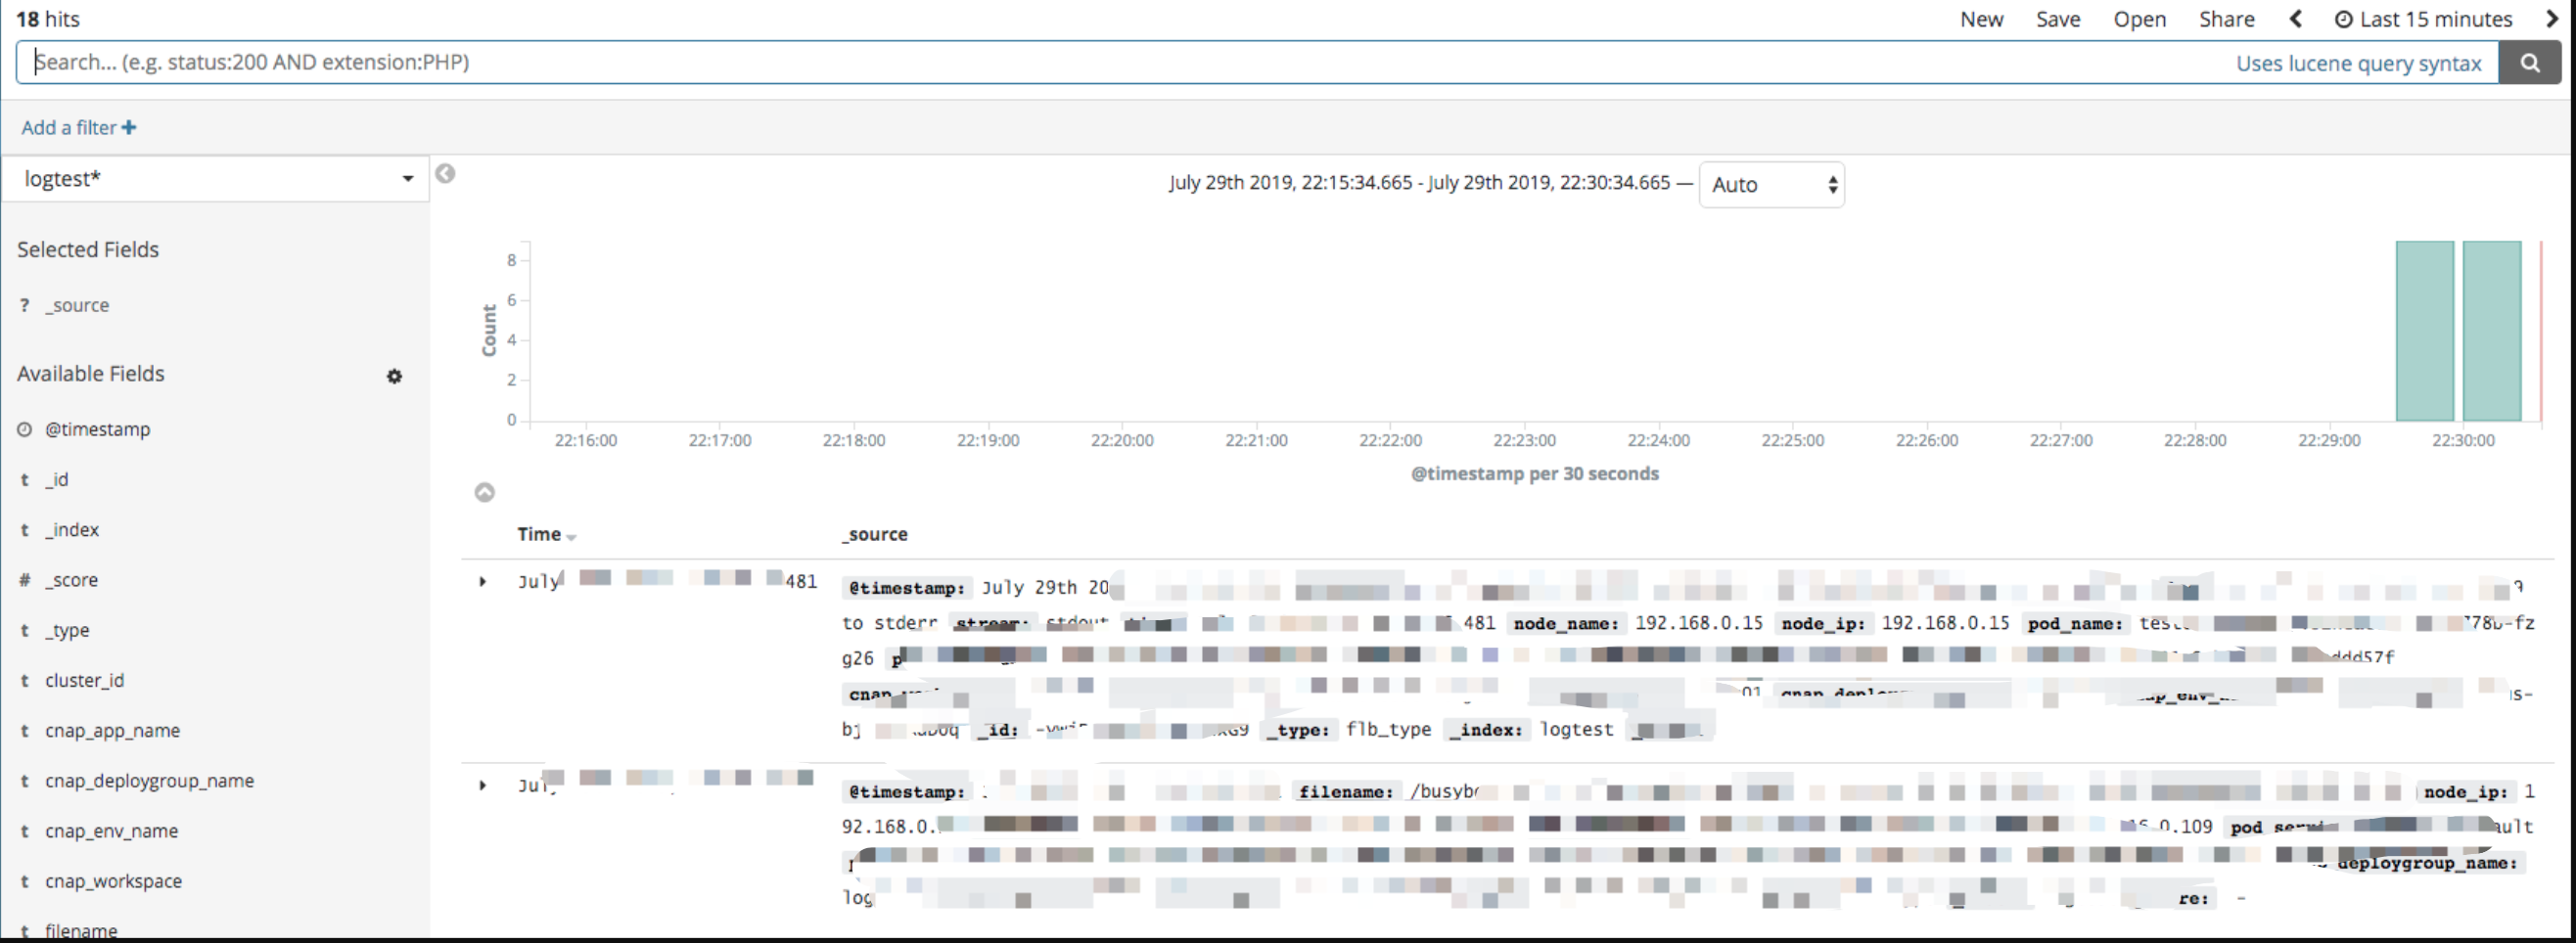
Click [Discover] on the left column to view the log
Set Up Log Metric Monitoring
Overview
The Cloud Native Application Platform (CNAP) supports real-time analysis of log data, extracts user custom metrics based on log entries, and provides visual display of monitoring charts and alarm services.
Operation steps
1.Under Application List, "Create Deployment Group", continue with Next until "Operation Configuration" 2.Click "Add Data Source" under the Log Data Source column. Reference [Set Application Log]
3.Select one of the data sources you just set, and click "Set as metric data source"
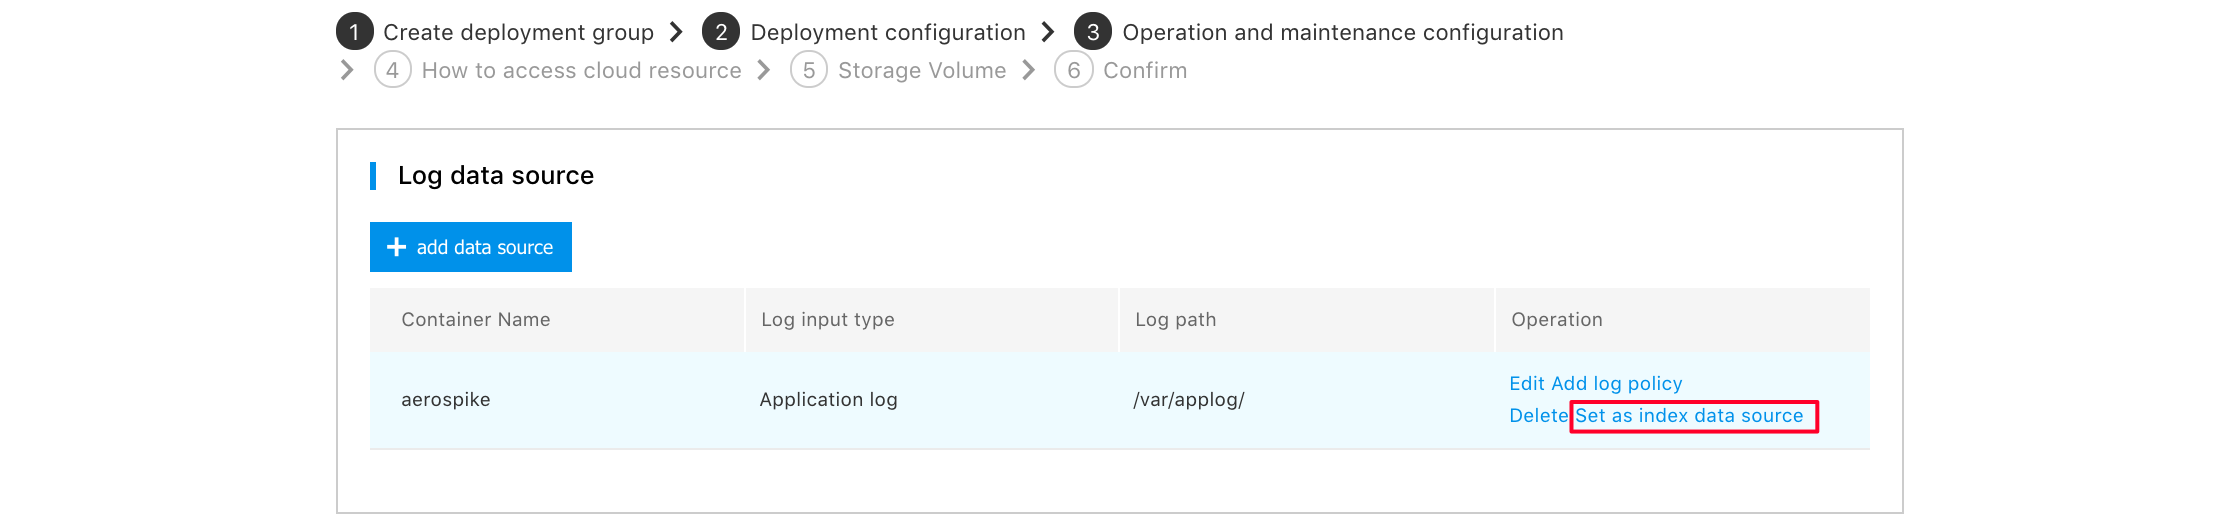
Note! For the time being, a deployment group can only support one metric data source.
4.If you Set the Metric Data Source on "Application Log", you need to enter which file to collect in the collection directory, or you can use a wildcard (*) to indicate collection of multiple files. If the standard output of the data source is selected, the above items are not required. Click "OK"

5.In the Log Metric Extraction column, click "Add Metric".
6.To add metrics, you need to enter the following options:
- Enter the metric name in "Custom Metric Name", and the metric name under the same deployment group cannot be repeated.
- For "Metric Type", you can choose from four types: Counter, Gauge, Summary, and Histogram. For details on the metric types, please refer to Metric Type ( English )
- "Description" Enter the description of the metric, which is optional.
-
"Extraction rules" Enter the matching rules of the log, use grok expressions, and support capture field values. grok expression writing reference
- It is strongly recommended to use the grok expression debugger or Grok Constructor to debug and pass the rules.
- We provide a reference for grok expressions that can be used by default Here, you can also add a custom grok expression first in the Management Expression, and then use it
-
Click "Add" in Metric Tags to add custom tags to the collected logs. You can add multiple tags.
The value of the metric tag can be filled with a constant string, the grok field (a template variable of go) in the extraction rule, and a combination of them. E.g.: The log example is: "2016-04-18 09:33:27 alice 1222", the extraction rule is'%{DATE} %{TIME} %{USER:user}%{NUMBER:val}', the value here can be abc or {{.user}} or abc{{.user}}def, the actual tag is user:alice or user:abcalicedef
- "Enter the fields captured from the extraction rules in the index value", which supports go's template syntax.
- "Cumulative or not" If the metric type is Gauge, the metric obtained will accumulate the value in Metric Value when you select "Yes" in Cumulative or not
- "Quantile" If the metric type is Summary, you also need to enter the Quantile you want to observe. Each quantile is greater than 0 and less than 1, separated by commas.
-
"Number of partitions" If the metric type is Histogram, you also need to enter the Partition Number of the bucket. Use commas to separate the partition numbers.
7.Click "OK". Afterwards, you can view the set log strategy in Log Collection Strategy.
Repeat steps 5-8 directly when adding multiple log collection strategies
8.Click "Manage grok Expression"->"Add Expression" and enter the custom expression used in the above metric extraction. Enter the custom grok expression name on the left side of the expression, and enter the grok expression pattern on the right side. For the definition of grok expression, refer to Grok Patterns and Grok filter plugin
Note: The grok expression filled in will override the grok expression with the same name in the default grok expression!
9.Click "Next" (create deployment group) at the end of the page or "OK" (modify deployment group) in the upper right corner
10.View metrics In the left navigation bar, select [Custom Monitoring] to view the custom metrics collected.