
Micro-service Management
Micro-service management provides service registration query, service governance (routing, throttling, circuit break degradation) and call chain query functions. Help users with real-time monitoring of Micro-service application and high availability service guarantee.
Service List
The service list shows the service information currently registered in the registration center and the service information for which the service governance rule has been configured.
View Service Information
- Log in to the CNAP console
- click [Service List] under [Micro-service Management] in the left function menu bar to enter the service list page.
- Select the workspace you want to view You can select the service or application to view through the right query box.
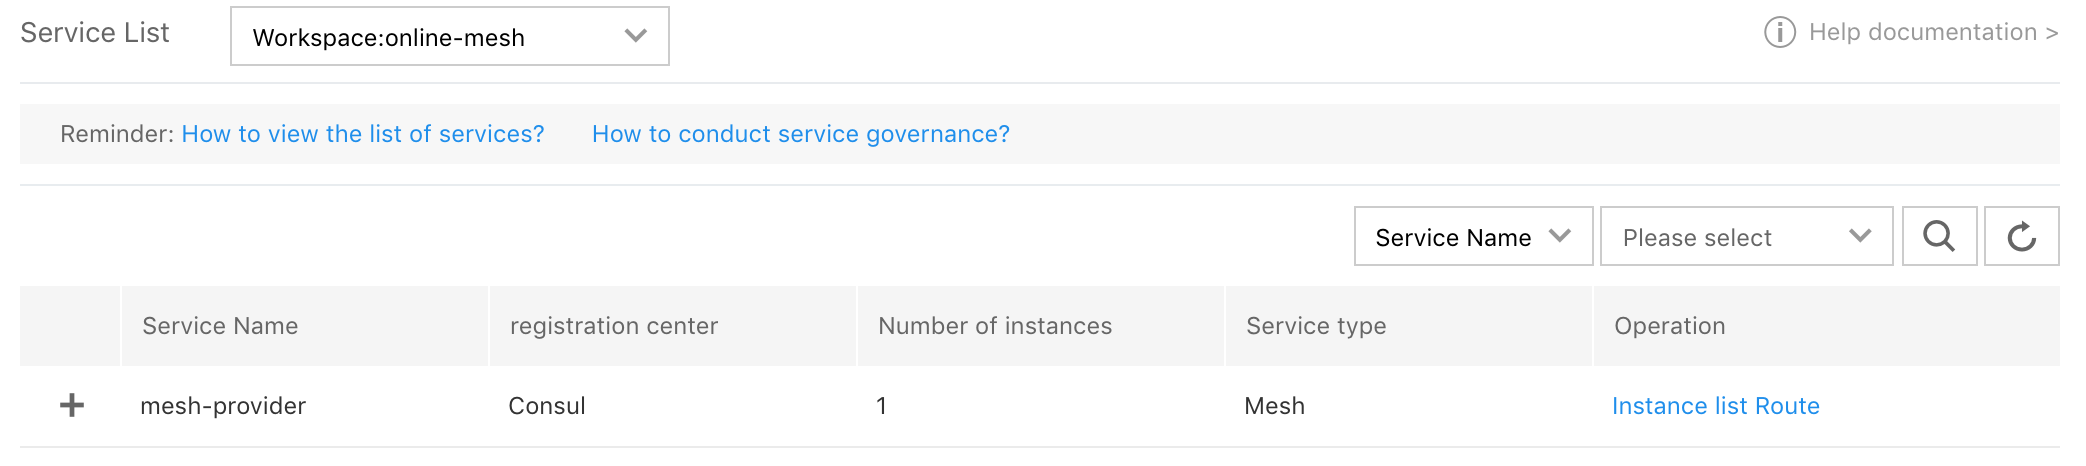
List information:
- Service name: Service name registered in the registration center under the current workspace
- Number of instances: Number of instances registered for the service in the current workspace
- Service type: Type of service, such as: Spring Cloud and Mesh The CNAP currently supports Spring Cloud Micro-service, and Mesh Micro-service will be launched soon
- Operation: View instance information registered with the service, configure governance rule (routing, throttling, circuit break)
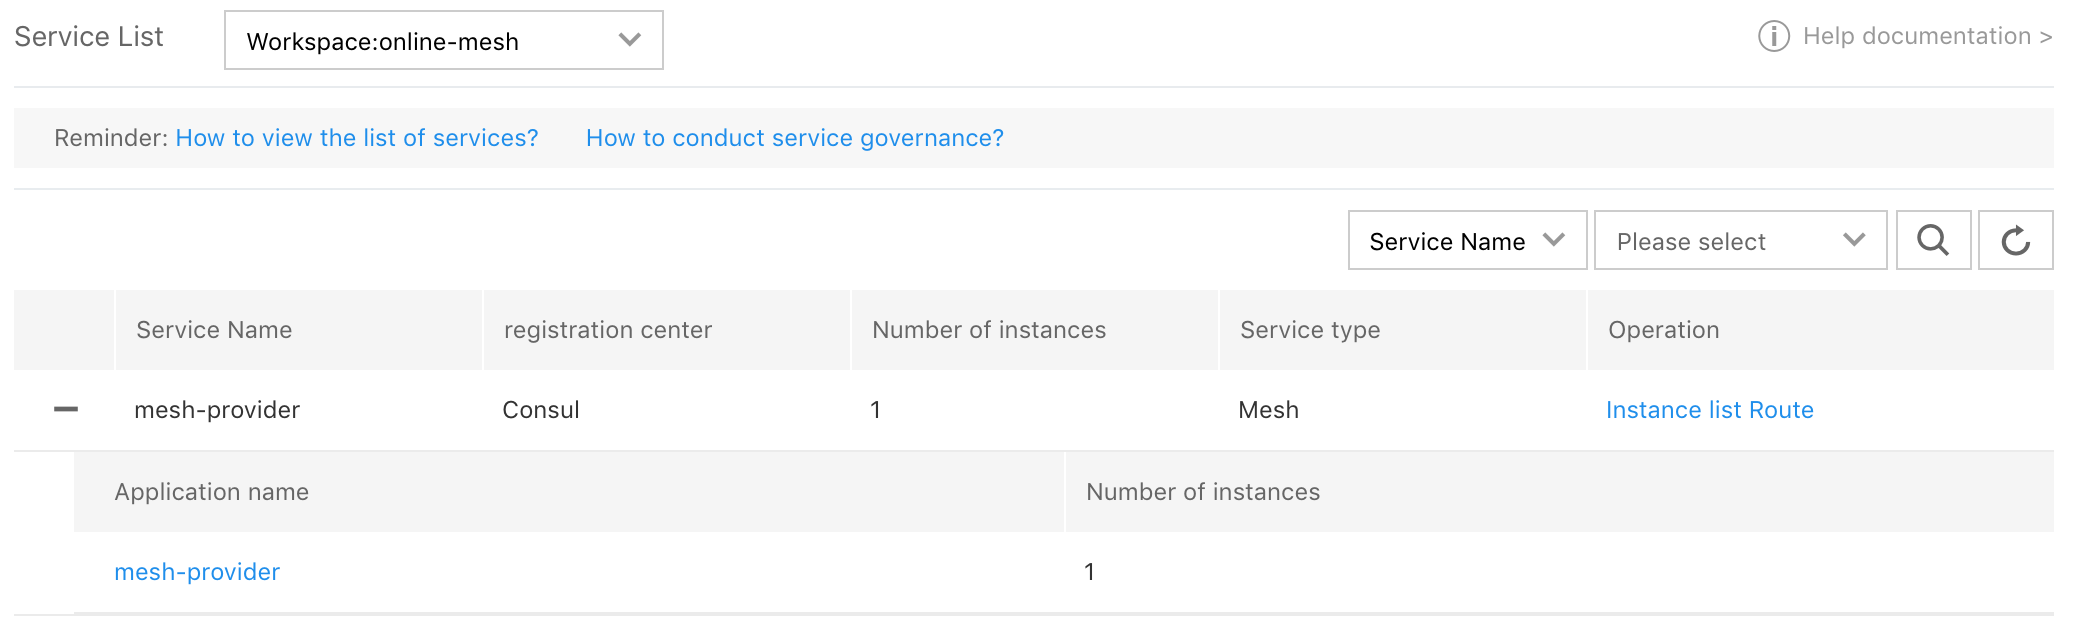
Click " " in front of target service to expand the application information (application name, number of application instances) under the service.
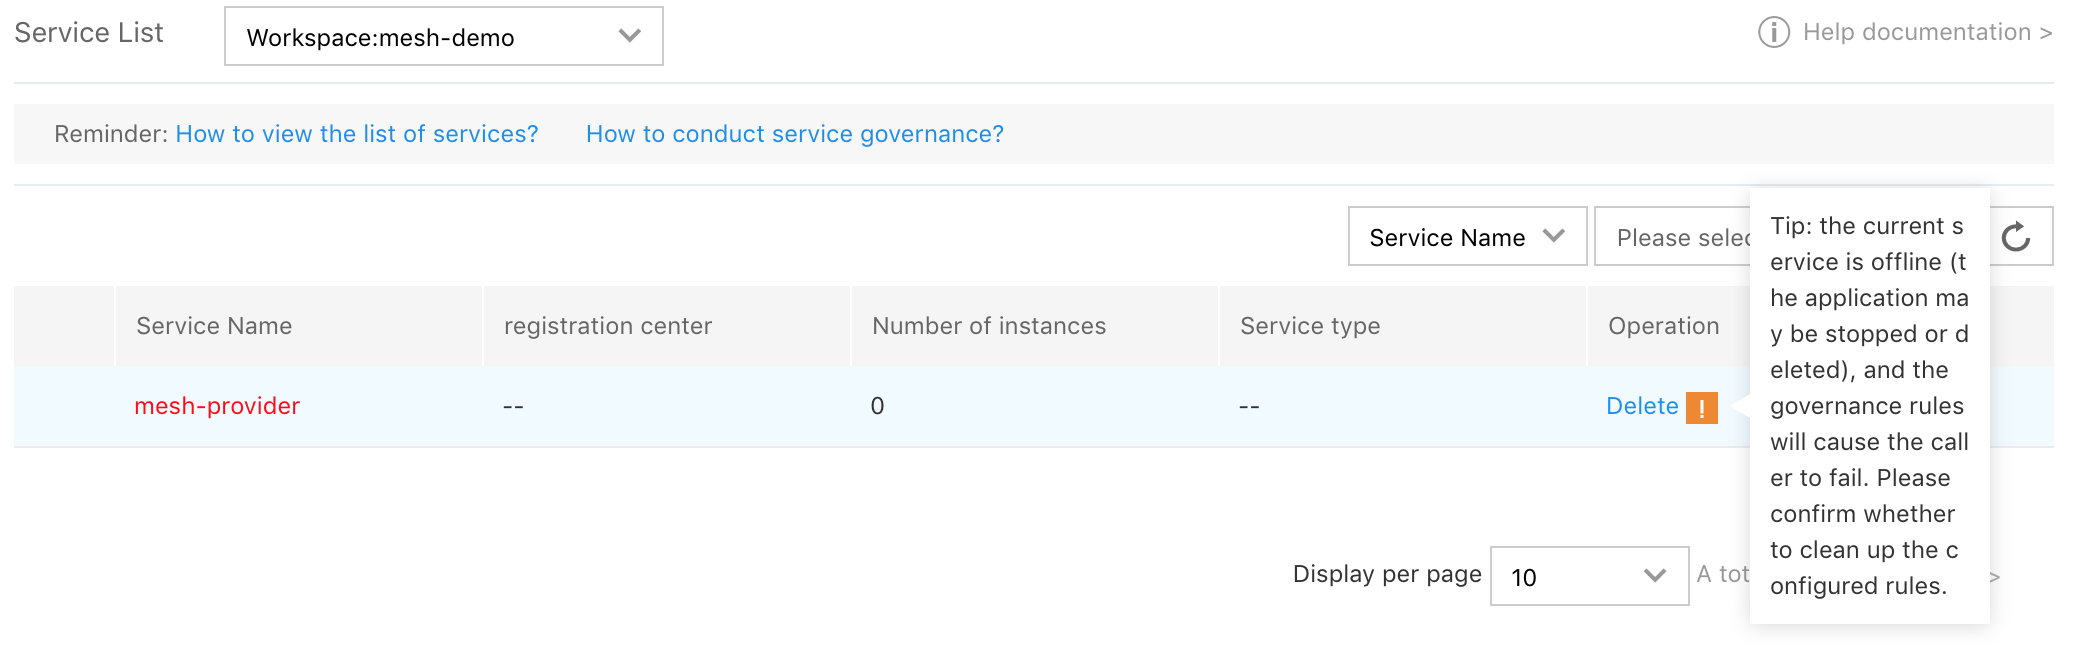
Note: Stopping or deleting the application will cause the Micro-service to go offline. If the previous service is configured with governance rule, the invalid service information will be kept in the service list, and the service will be prompted to be invalid. If users need to delete the offline service information, they need first clear the governance rule (routing, throttling) configured under the current service.
View List of Service Instances
Click [Instance List] in [Operation] column of the target service in the service list to enter the instance list page
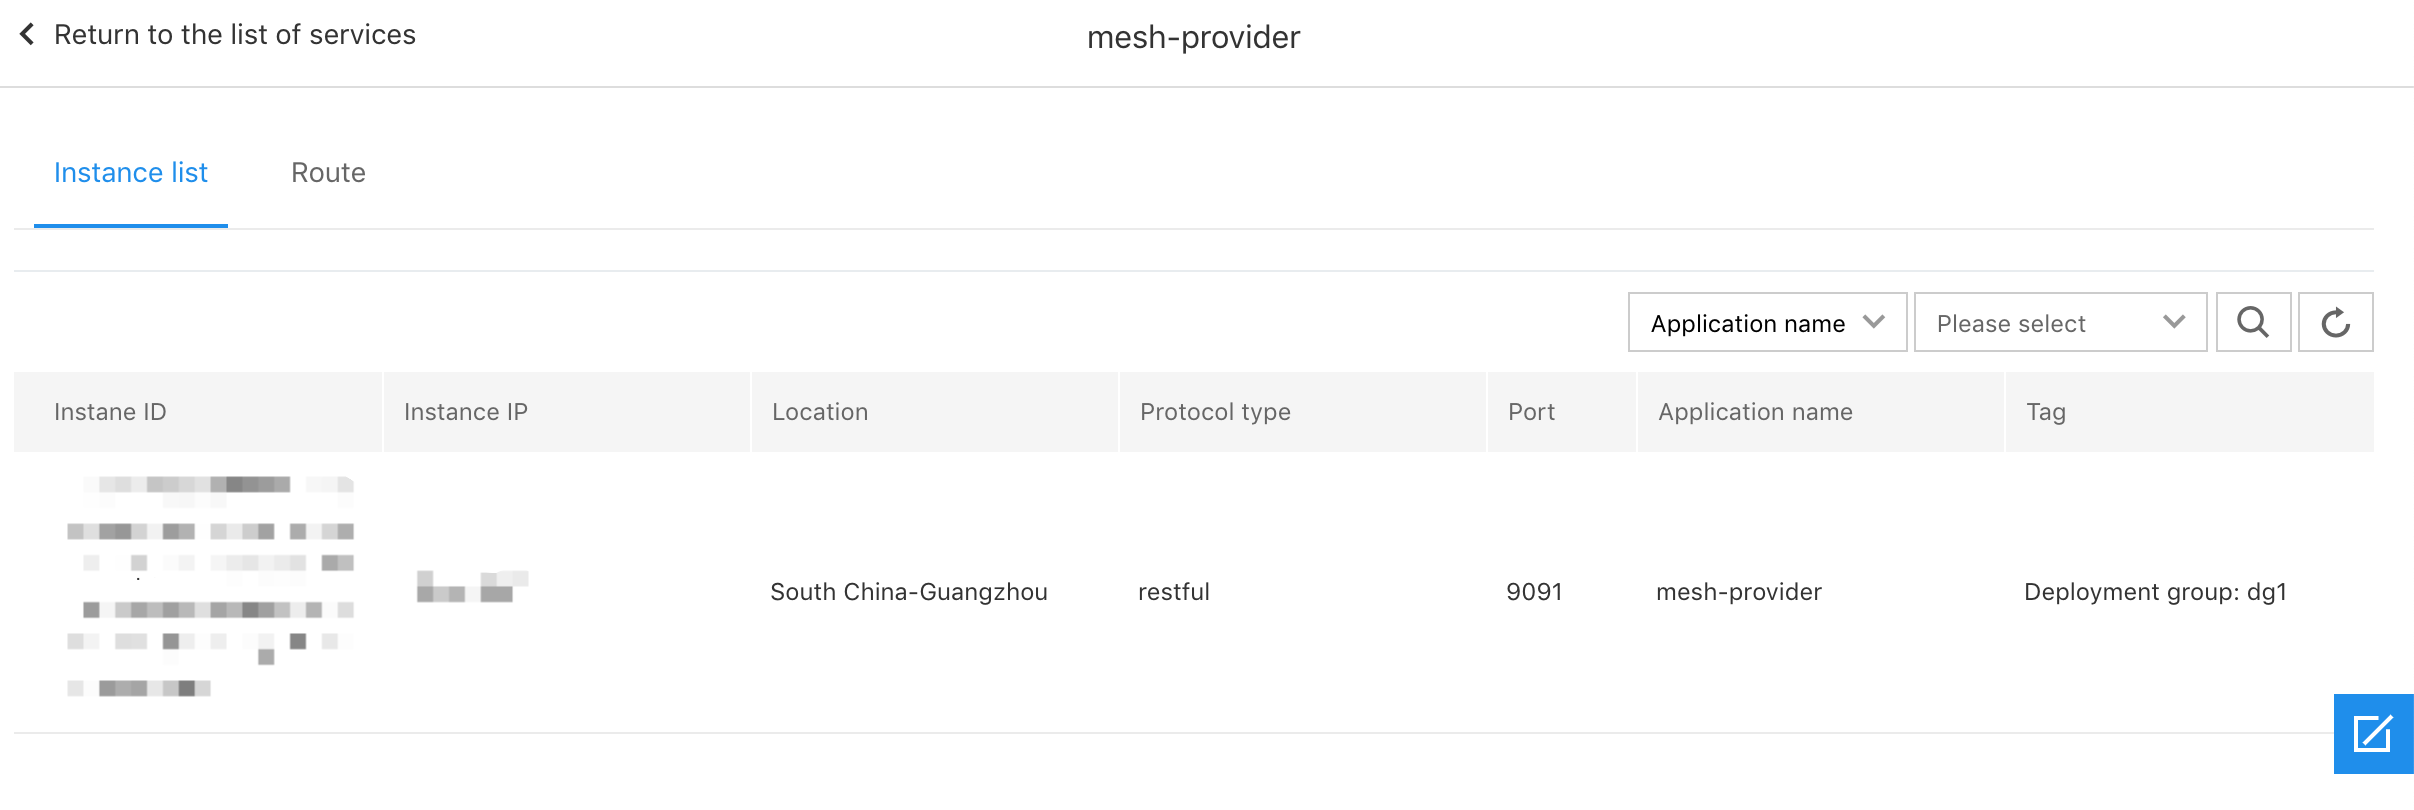
Instance information:
- Instance ID: Service instance ID
- Instance IP: IP of the service instance (this IP is the container network IP of the container group)
- Region located: The region of the cluster where the service instance is located
- The types of protocol: The communication protocol type supported by service instance
- Port number: Register the port number to provide service
- Application name: Name of the application to which this instance belongs
- Tags: Tag of the instance, for example: Deploy group:
Service Governance
The CNAP currently provides service governance policies as follows: Routing, throttling, circuit break.
Routing
Routing function provides access control between Micro-services, and users can specify access paths between Micro-services. When no routing rule is created, Micro-services in the same workspace and environment can access each other by default. For creation of routing rule, it is created by the provider to route traffics from different consumers.
Note:
- Traffic source and destination routing rule across different environments will not take effect
- When multiple routing rules are created, the rule created later will take effect first.
- Start, stop, creation, deletion and edit operation of rule need to wait 30 seconds to take effect
View routing rule
Select provider on the service list page, and click [Route] in [Operation] column to enter the routing rule page
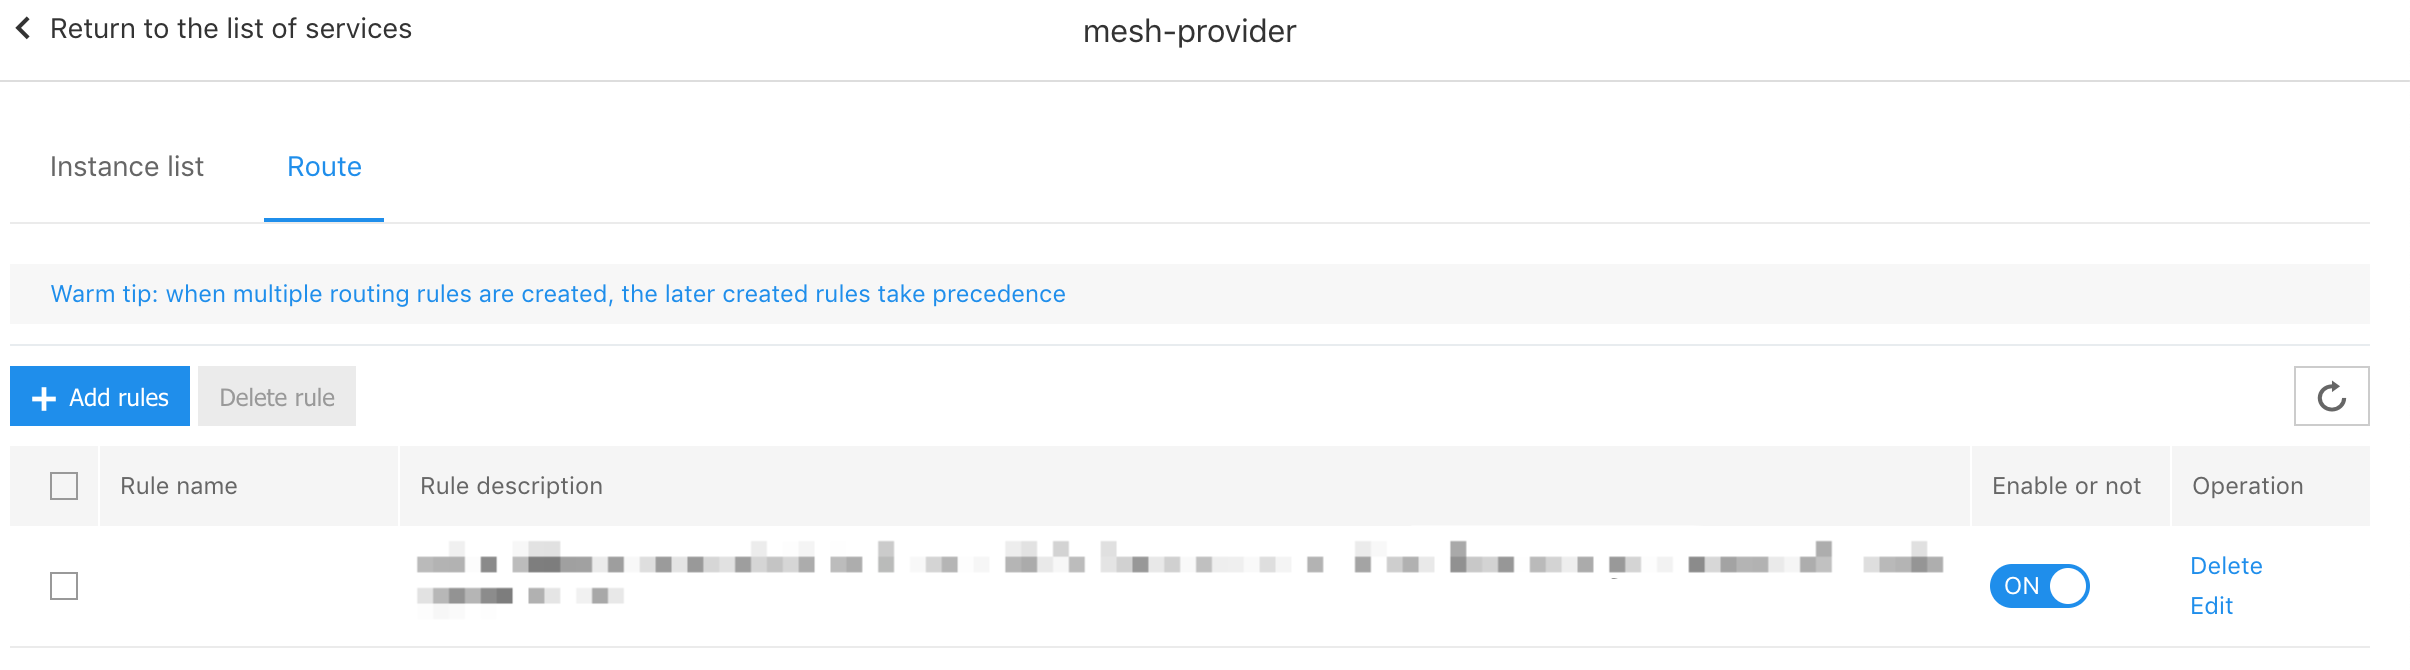
Display information:
- Rule name: Custom name when creating rule
- Rule description: Description of the configured rule
- Whether to enable: Whether the rule takes effect
- Operation: Remove (delete the rule), edit (change the routing rule)
Add routing rule
- Log in to the CNAP console.
- Select [Service List]-[Operation]-[Route] on the left menu bar to enter the route list
- Click [Add Rule] on the route list
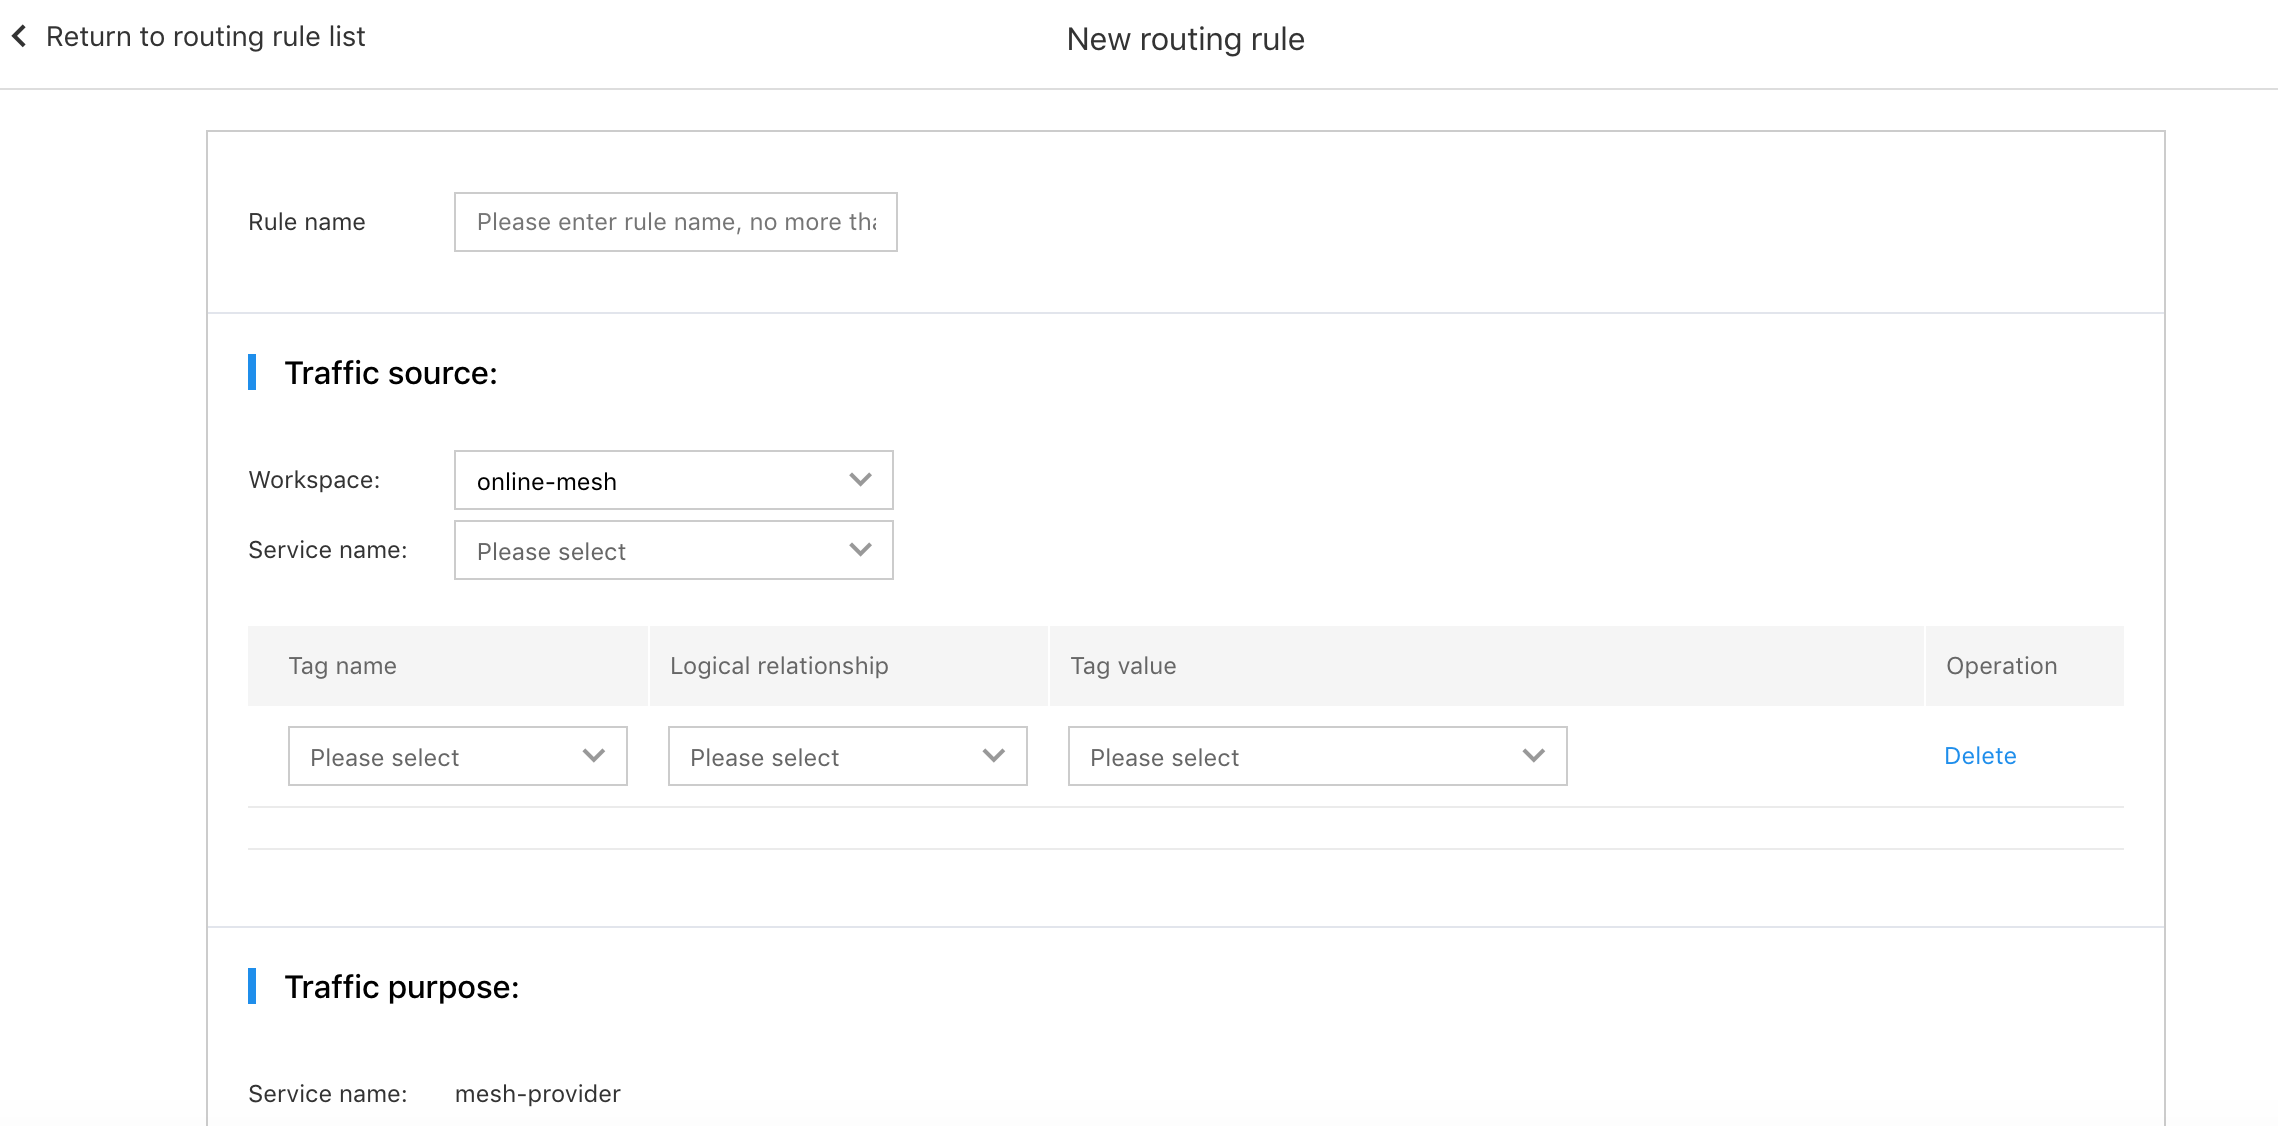
- Rule name: Routing rule name is no more than 30 characters
- Traffic source: Consumer information
- Service name: Select the service of the traffic source, that is, the service name of the consumer
-
Filter conditions: Traffic source only supports single filter conditions:
- Tag name: Support tag filter traffic source by application name or deploy group name
- Logical relationship: Currently only supports equal
- Tag value: Select the name of the application or deploy group
- Operation: Deletion
All instances that meet the service name and tag name filter conditions will become the source of traffic for this routing rule.
- Traffic purpose: provider's information
- Service name: provider's service name
- Allocation policy: Currently only supports weight allocation
-
Filter conditions: Traffic purpose supports multiple filter conditions
- Application name: Traffic destination application name
- Tag name: Only supports deploy group as tag
- Logical relationship: Currently only supports equal
- Tag value: Deploy group name:
- Weighting: Traffic weight allocated to this group of instances
- Operation: Deletion
-
Load balancing policy: Allocation policy for traffic distribution to all instances that meet the filter conditions, including random, roundbin, weighted roundbin and average response time
- Random: Random is allocated to all instances
- Roundbin: Roundbin is allocated to all instances
- Roundrobin: Frequent access error instance will be eliminated. After a certain period of time, this instance will continue to be added to the accessible instances, and will continue to be selected by the roundbin algorithm
- Average response time: Calculate the weight based on the average time for each instance to respond within a certain time window. The smaller the response time of the instance is, the more likely the instance will be selected
- Whether to enable: Whether the routing rule takes effect after it is created
Edit routing rule
- click [Edit] in the target rule [Operation] on the routing rule page to enter the modify routing rule page.
- Modifiable information includes:
- Rule name
- Filter conditions for traffic source
- Filter conditions for traffic purpose
- Load balancing policy
- Whether to enable
Delete routing rule
Provide function of single routing rule and batch rules deletion on the routing rule page. Single rule deletion: click [Remove] in [Operation] of the destination routing rule, delete it after confirmation. Delete in batch: Select the routing rule to be deleted, click the page function Delete Rule, and delete it after confirmation.
Throttling
Throttling rule is configured in the provider. It is a governance policy that restricts the traffic of the specified object by preventing large traffic shocks from causing service failure, or preventing a single consumer from occupying too many resources of the provider. Currently, the CNAP provides QPS-based throttling functions. The dimensions of the throttling objects include method level and instance level.
Note:
- Start, stop, creation, deletion and edit operation of rule need to wait 30 seconds to take effect.
- Only one throttling rule can be configured for the same application name+deploy group name+method under the same provider service.
View throttling rule
Select provider on the service list page, click [Throttling] in [Operation] column to enter the throttling rule page.
Display information:
- Rule name: Custom name when creating rule
- Rule description: Description of the configured rule
- Whether to enable: Whether the rule takes effect
- Operation: Remove (delete the rule), edit (change the throttling rule)
Add throttling rule
- Log in to the CNAP console.
- Select [Service List]-[Operation]-[Throttling] in the left function menu bar to enter the throttling rule list.
- Click [Add Rule] on the list.
Basic information
- Rule name: Rule name is no more than 30 characters
-
Traffic source: Filter requests based on a set of conditions. Requests that meet all the filter conditions will receive the restrictions of the throttling rule.
- Tag name: Support application name, deploy group name or service name as filter conditions
- Logical relationship: Support equal, not equal, contain, does not contain
- Tag value: Select application name, deploy group name or service name
- Deletion: Can add multiple filter rules or delete
Throttling object
- Service name: The throttling object is the provider that needs to be traffic limited
-
Filter conditions:
- Application name: Application name of throttling provider
- Deploy group: Deploy group name of throttling provider
- Method: The specific method that needs to be throttled (the method name supports manual input or select from registered methods).
- Throttling configuration: Supports QPS as the throttling condition to limit the maximum QPS of the traffic source to access the throttling object.
- Whether to enable: Whether the routing rule takes effect after it is created.
Edit throttling rules
- click [Edit] in the target rule [Operation] on the throttling rule page to enter the modify throttling rule page.
- Modifiable information includes:
- Rule name
- Filter conditions for traffic source
- Throttling configuration
- Whether to enable
Delete throttling rule
Provide function of single throttling rule and batch rules deletion on the throttling rule page. Single rule deletion: click [Remove] in [Operation] of the destination throttling rule, delete it after confirmation. Delete in batch: Select the throttling rule to be deleted, click the function [Delete Rule] on the throttling list page, and delete it after confirmation.
Circuit Break
Circuit break provides a Micro-service protection policy. When the percentage of errors returned by the provider is too high, the traffic is temporarily interrupted to prevent the call chain from avalanching. The circuit break policy is configured in the consumer.
Note:
- In the same consumer, only one circuit break rule can be configured for the same provider service name+method.
- Start, stop, creation, deletion and edit operation of rule need to wait 30 seconds to take effect.
View circuit break rule
Select the consumer service on the service list page, click [Circuit Break] in Operation column to enter the circuit break page.
- Rule name: Rule name of circuit break
- Circuit break method: Automatic circuit break or manual circuit break
- Rule description: Specific policy description of circuit break rule
- Whether to enable: Whether the circuit break rule takes effect
- Operation: Edit or delete the circuit break rule
Add circuit break rule
Click [Add Rule] button at the top left of the list on the circuit break rule page to enter the add circuit break rule page.
Basic information
- Rule name: Circuit break rule name is no more than 30 characters
-
Filter conditions of circuit break object: Filter requests from the consumer. Requests that meet all the filter conditions will be blown out by this rule. ()
- Tag name: Support filtering by application name or deploy group name
- Logical relationship: Support equal, not equal, contain, does not contain
- Tag value: Select a filtered application name or deploy group name
-
Requested service filter conditions: Support the specified service and method filter, or all services and methods filter. When a request matches multiple circuit breaker rules at the same time, only the finest-grained rule will be hit.
- Service name: Accessed service name
- Method: Accessed method (requires full method name entered manually, regular expression matching is not supported)
- Circuit break method: Automatic circuit break or manual circuit break. Manual circuit break takes effect immediately, automatic circuit break will take effect when the circuit break condition is triggered
- Circuit break duration: Duration of the circuit break trigger during automatic circuit break
Circuit break conditions: When automatic circuit break is selected, trigger conditions for automatic circuit break need to be configured.
- Number of window requests: Window for number of requests used to determine whether circuit break has been triggered.
- Anomaly ratio threshold: Threshold of the abnormal request proportion to judge whether it is blown out when the number of requests reaches the window value.
- Whether to enable: Whether the circuit break rule has taken effect
Edit circuit break rule
- click [Edit] in the target rule [Operation] on the circuit break rule page to enter the circuit break rule page.
- Modifiable information includes:
- Rule name
- Filter conditions of circuit break object
- Circuit break mode and conditions
- Whether to enable
Delete circuit break rule
Provide function of single circuit break rule and batch rules deletion on the circuit break rule page. Single rule deletion: click [Remove] in [Operation] of the destination circuit break rule, delete it after confirmation. Delete in batch: Select the circuit break rule to be deleted, click the function [Delete Rule] on the circuit break list page, and delete it after confirmation.
Call Chain
The call chain is used to query the link status information of the service, which can help you quickly locate the problem when the service fails. The call chain supports mutual calls between Spring Cloud application and Mesh application. The call chain function includes call chain query and call chain details show.
Call Chain Query
- Log in to the CNAP console.
- Click [Call Chain] under [Micro-service Management] on the left function menu bar to enter the link query page.
- Set the query conditions for query. The query supports fuzzy query and TraceID query.
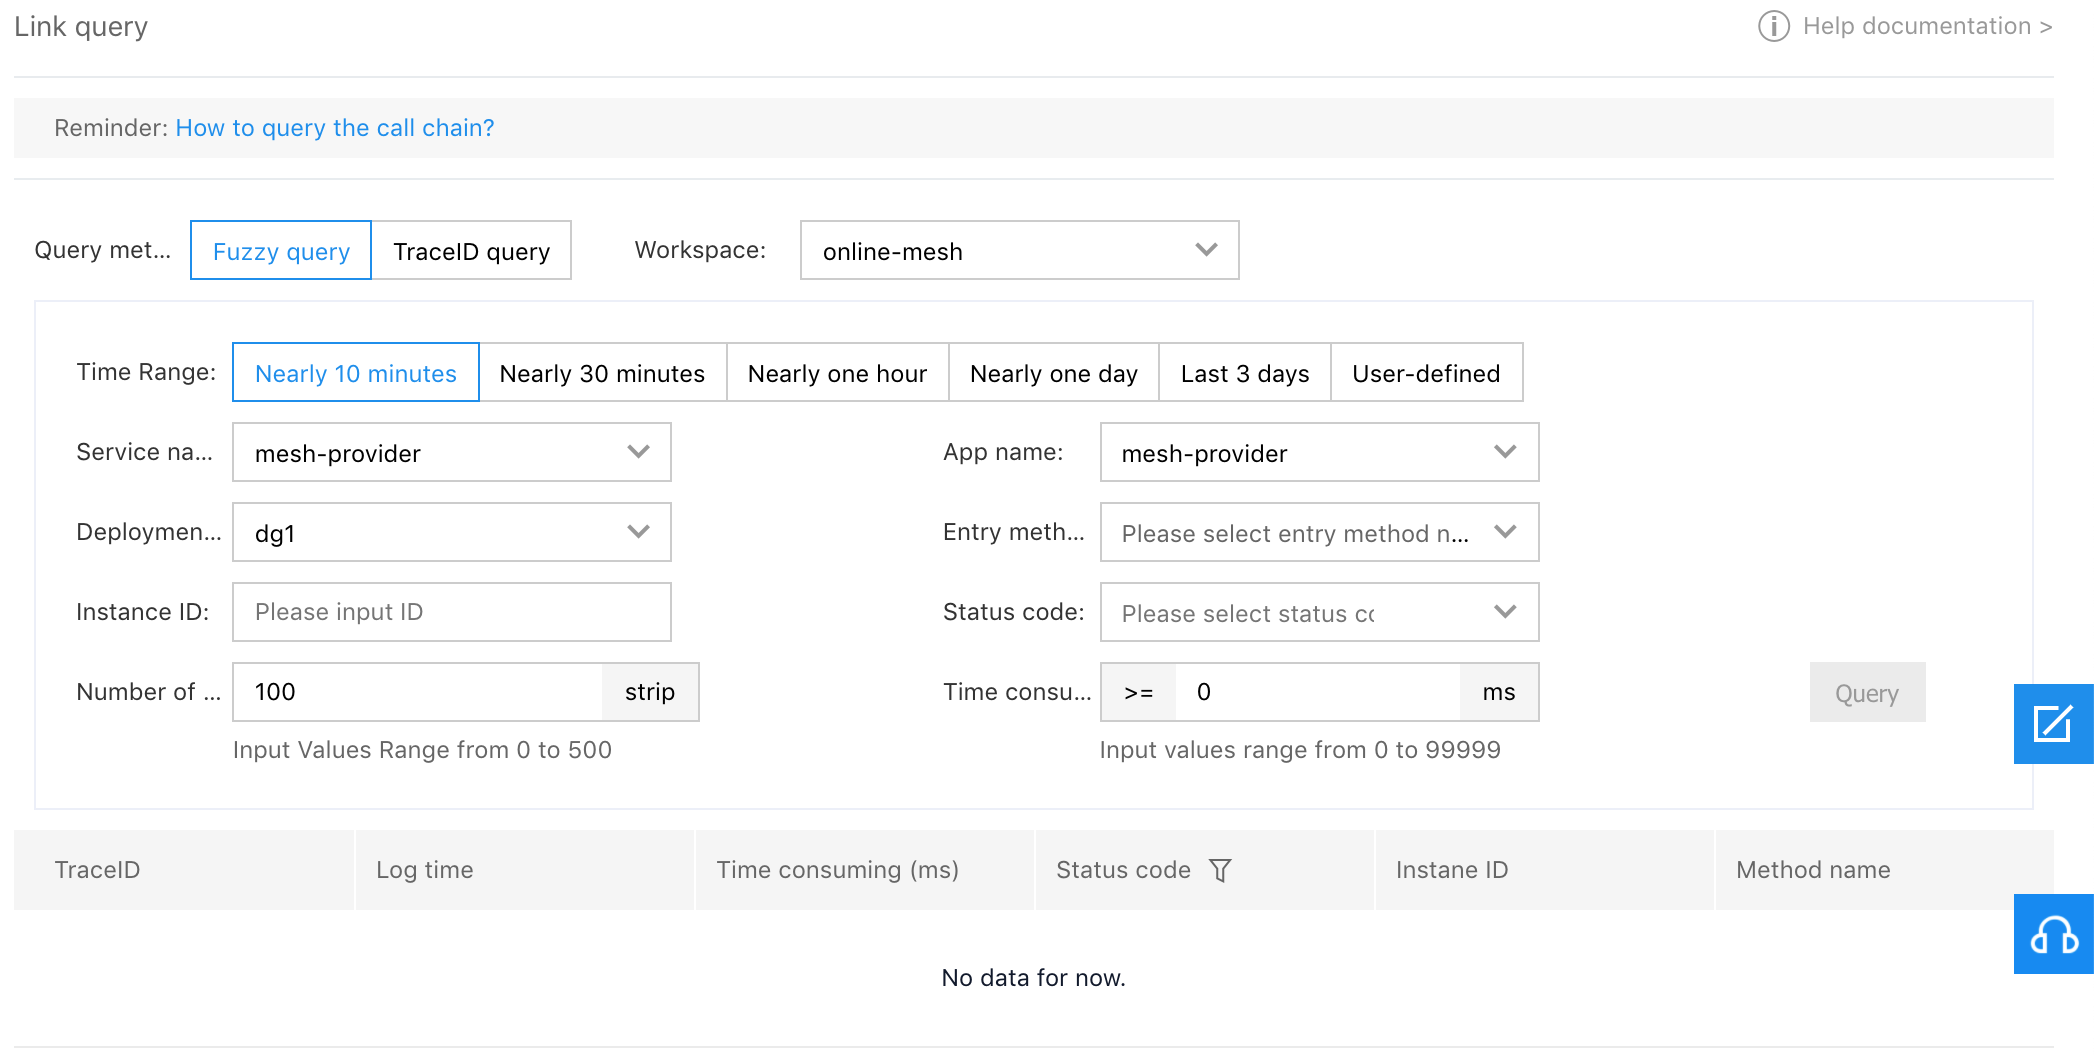
Fuzzy query
Query conditions:
- Time scope: Select fixed time (last 10 minutes, last 30 minutes, last 1 hour, last 1 day, last 3 days). or select custom to customize the time period
- Service name: Select the target service name under the current workspace.
- Application name: Select the target application name under the service.
- Deploy group: Select the deploy group under the target application.
- Portal method: Select the portal method name under the target deploy group.
- Instance ID: (Optional) Single instance ID of the target deploy.
- Status code: (Optional) All, 200, 500, or manually enter the status code. The default is "All".
- Number of results returned: The default value is 100 and the maximum value is 500.
- Time consuming: Filter based on the elapsed time of the call chain.
The query results are as follows:
Show TraceId, log time, call elapsed time, status code, instance ID, method name.
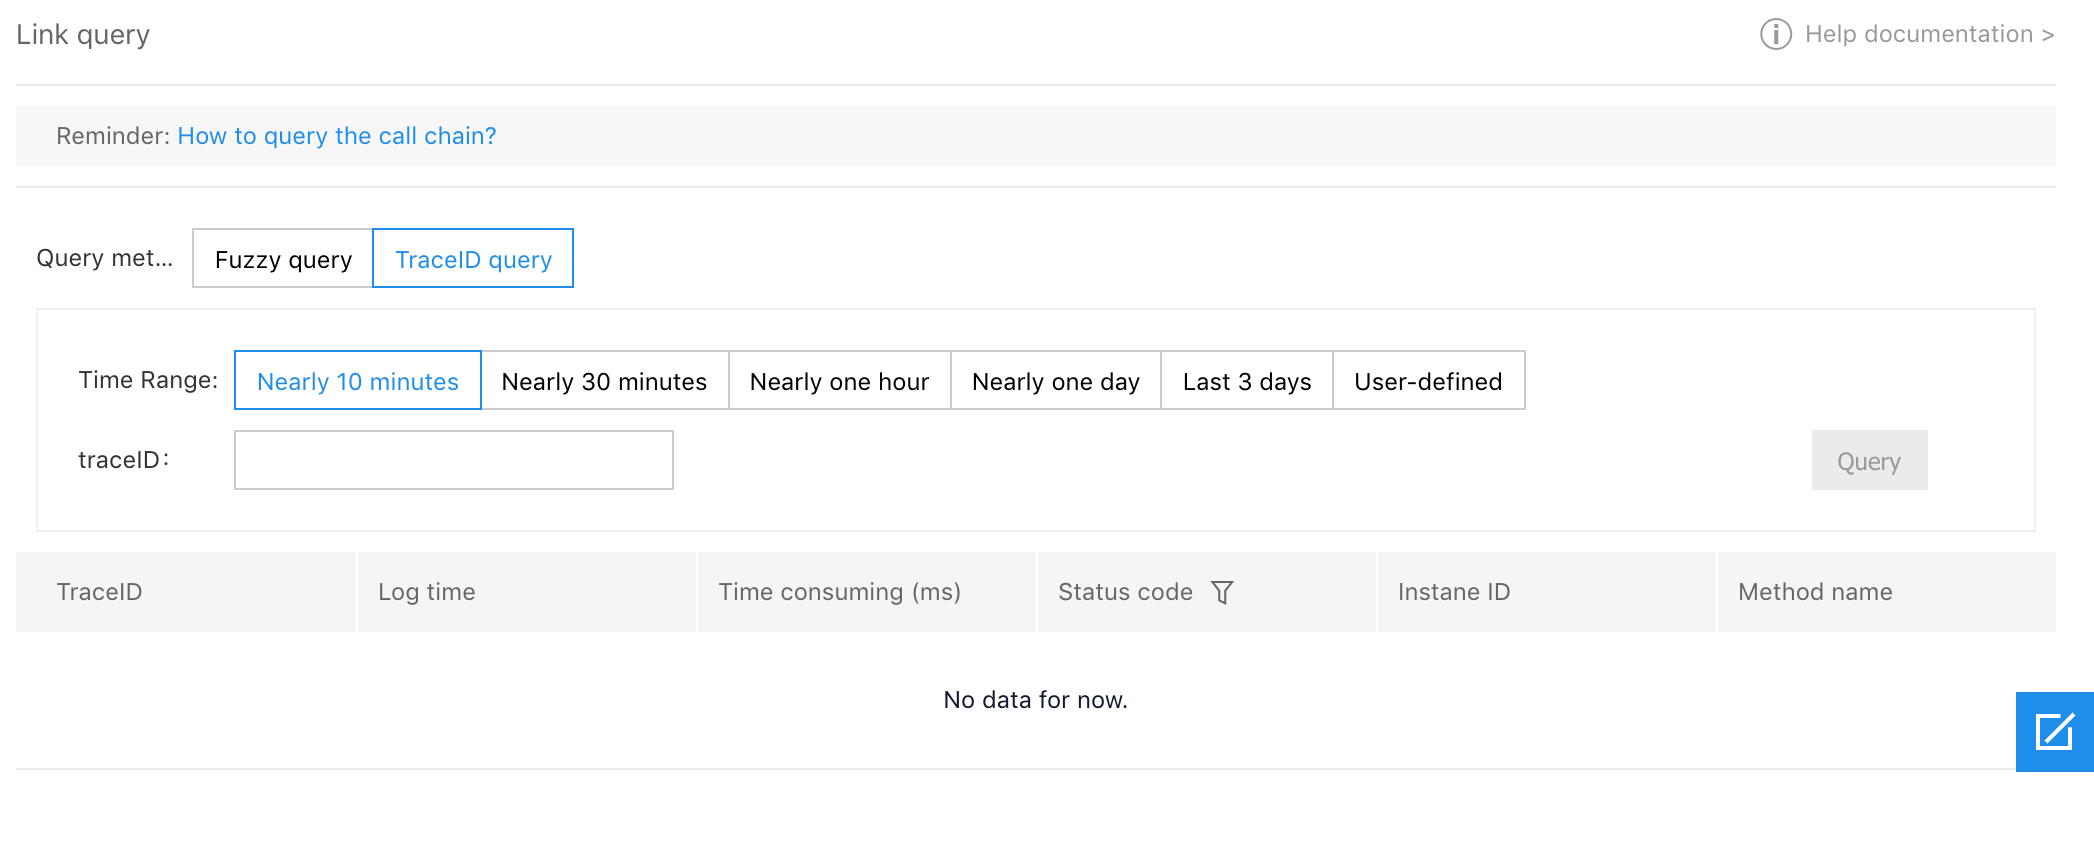
TraceID query
When traceID is known, you can query directly through traceID.
Query conditions:
- Time scope: Select fixed time (last 10 minutes, last 30 minutes, last 1 hour, last 1 day, last 3 days). or select custom to customize the time period.
- traceID: TraceID to query
The query results are as follows:
Call Chain Details
The details of the call chain can show the link status of a single Trace. Click the traceID field in the query results obtained through "fuzzy query" or "traceID query" to view the call details. The query results show the calling link information of TraceId, including the application name, service name, status, elapsed time and instance ID of each call. Show the elapsed time situation of each call link of the TraceId on the time axis according to the sequence of the calls.
Holographic log
Users can view the call log information associated with each call record in the operation bar of the call chain details through the holographic log function. The association between the call chain and the log is achieved by matching TraceID and SpanID, which needs to be manually configured by the users.
Inject call chain information for application log
For Spring Cloud application, to inject call chain information into MDC (Mapped Diagnostic Contexts) function of log dependent SLF4J, users need to use the SLF4J integrated logging framework in their applications. After using SLF4J, users need to manually configure call chain information in the log configuration file. Taking logback as an example, you need to add call chain related fields to the configuration of pattern:
<encoder>
    <pattern>%d{yyyy-MM-dd HH:mm:ss.SSS} %-5level %logger{5}: [%X{X-B3-TraceId:-},%X{X-B3-SpanId:-}] %msg%n</pattern>
    <charset>UTF-8</charset>
</encoder>
Please configure the call chain fields according to the above format of "%X{X-B3-TraceId:-},%X{X-B3-SpanId:-}", that is, "TraceId, SpanId".
For Mesh application, users need to obtain TraceId and SpanId in the request header of the application. The keys of the request header are X-B3-TraceId and X-B3-SpanId, and then print the information in the format of "TraceId, SpanId"on each log needs to be captured. Taking go language as an example, you need to add the following log content to the code:
log.Printf("traceId and spanId: %s,%s", req.Header.Get("X-B3-TraceId"), req.Header.Get("X-B3-SpanId"))Configure log collection policy
Add the data source to be collected by the application in "Log Data Source" in the operation and maintenance configuration of the deploy group:
Use the built-in ES in the component center to collect log data (currently only the ES built in the cluster is supported) in the "Log Collection Policy". A multi-line collection policy can be configured as required (such as collecting multi-line stack information printed in a log by a Java application, and selecting the default "Log Example 1" to support the multi-line collection of the pattern in the example above. Other formats need to be manually modified to suit the situation.)
View hologram log
Click "Holographic Log" button in the right operation bar of a call in the call chain details to view the associated log information: