
Micro-service Monitoring
Precondition
The collection of microservice monitoring indicator data relies on the "Prometheus" component in the component center. To use microservice monitoring related features, please enable "Prometheus" in the component center first.
Service Overview
Enter [Micro-service Monitoring] to select [Service Overview]
Select [Workspace · Application · Deploy Group] to view the summary information of the application's running data, including overview data and graph data.
Overview indicators
-
Total number of requests: Number of times the current application has been accessed, including normal access and abnormal access. Normal access refers to records generated by the interface to the external service provided by the application. Abnormal access refers to records generated by methods that do not exist in the call interface of the external application, or internal methods of the Micro-service framework (health checks, etc.).
- Average response time: Provide the average response duration of the service interface.
- Number of instances: An [Application-Deploy] Group can have multiple instances, and the number of currently running instances is shown here.
- Number of exceptions: Statistics on the anomaly number thrown during application running.
Graph indicators
- Number of requests Curve of change of number of requests over time.
- Average response time Curve of change of average response time over time.
- Error rate Curve of change of response status code anomaly rate (inconsistent with the anomaly in the monitoring indicators) over time.
Service Topology
Enter [Micro-service Monitoring] to select [Service Topology]
Select [Workspace · Application · Deploy Group] to show service topology diagram
The information shown in the diagram includes
- Node An application's deploy group is considered as a node. Database, cache, etc. are also considered as nodes.
- Ligature For the HTTP, RPC, DB and CACHE categories, different curves are shown. Each will show summary information for the category.
Interface Analysis
Enter [Micro-service Monitoring] to select [Interface Analysis]
Select [Workspace · Application · Deploy Group] to view interface related data.
Interface List
Show a list of near-term interface calls, including normal method calls and some abnormal method calls (external application access interface that does not exist in the application). Each method contains summary information: Response time, number of requests, number of errors, anomaly number. The anomaly number refers to anomaly or error thrown at runtime, and the number of errors refers to the incorrect status code returned by the call interface.
Interface Overview
The interface overview includes the following statistical items:
- Topology diagram Method-level topology diagram. One method is a node. Based on the summary of the monitoring data, the topology diagram is used to show the upstream and downstream dependencies between the methods. It should be noted that some methods node not only shows the records of the current portal method, but also the records generated when other methods access the node. The ligature in the topology diagram shows statistical data of calls between method nodes.
- Time curve of number of requests Curve of change of method-level number of requests over time.
- Time curve of average response time Curve of change of average response time over time.
- Time curve of number of errors Curve of access of incorrect number of response status codes over time.
SQL Analysis
Show the sql call status of an interface in the latest specified time period. Get the SQL call associated with the portal method according to the method list, and show the statistical information of the call, including the number of calls, average time, and draw a statistical curve.
It should be noted that sql analysis has portal only in application where database access occurs.
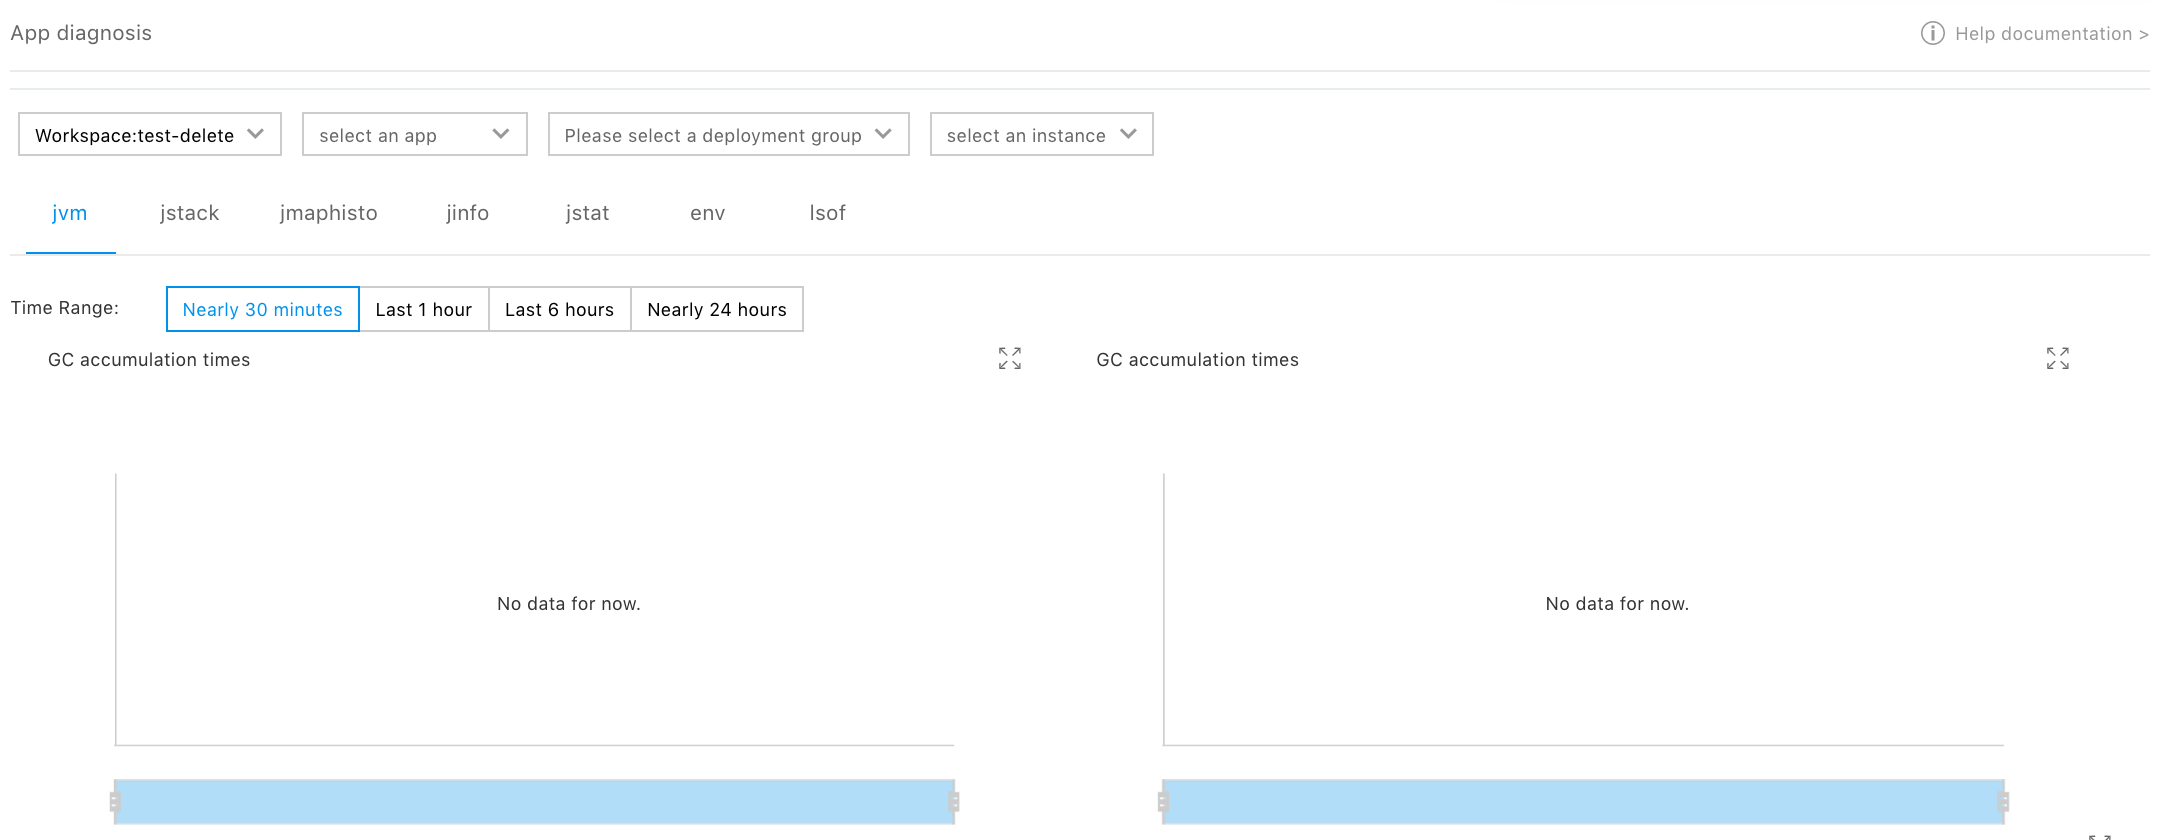
Application Diagnosis
Enter [Micro-service Monitoring] and select [Application Diagnosis] to enter the diagnosis page. Select [Workspace · Application · Deploy Group] Instance to view the JVM monitoring information of the instance or remotely perform diagnosis for the application on the instance.
JVM monitoring
Show the JVM statistics of the application.
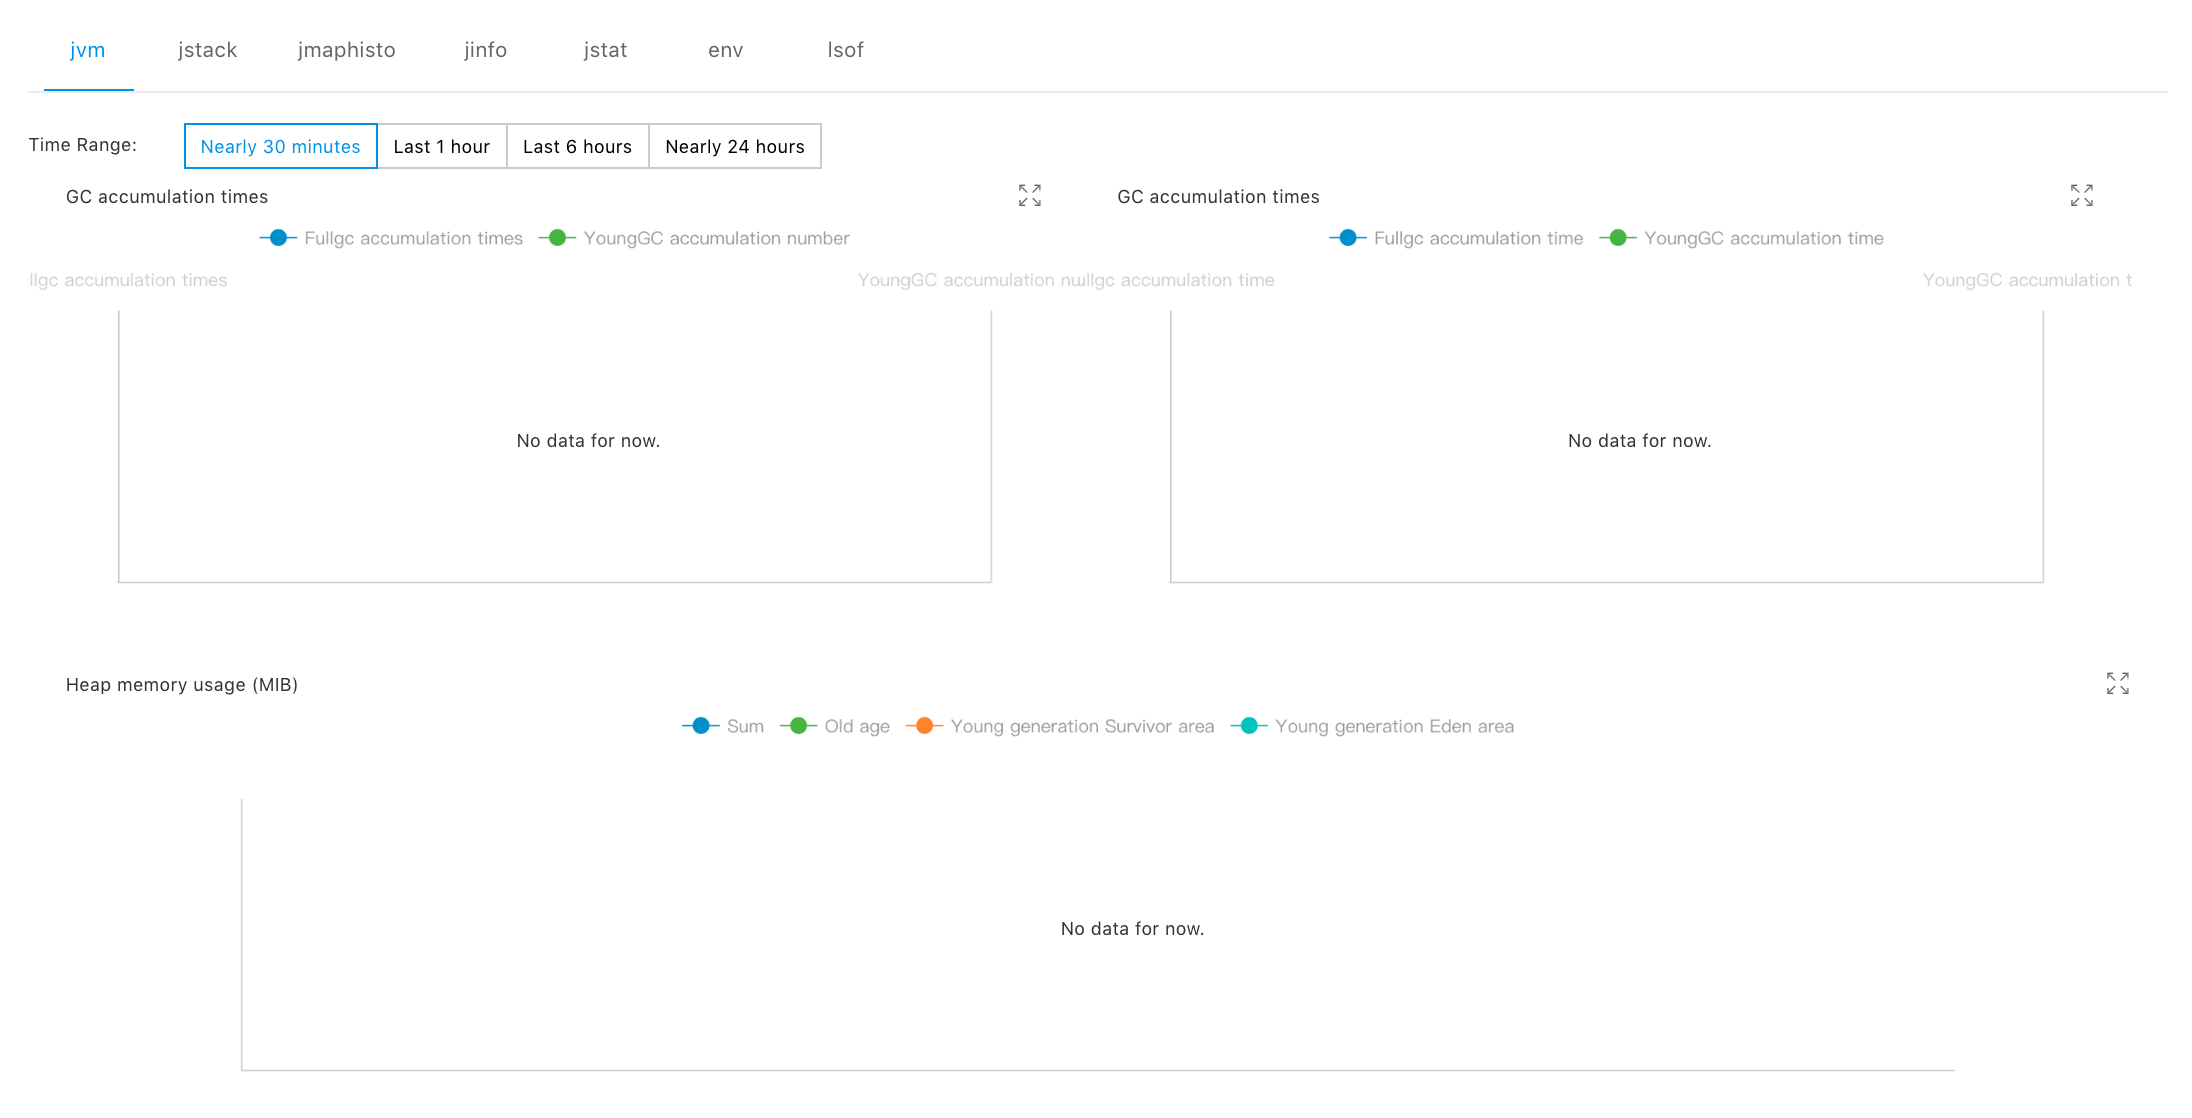
Statistical items include:
- GC accumulation times\GC accumulation elapsed time Accumulated GC data statistics from the start of the application.
- Heap memory usage amount Time variation curve of near-term heap memory usage.
- Thread count Time variation curve of various types of thread counts for JVM.
Remote Application Diagnosis
The application diagnosis function supports diagnostic commands commonly used by JVM and system to help users with remote troubleshoot. The commands include jstack, jmap, jinfo, jstat, env and lsof.
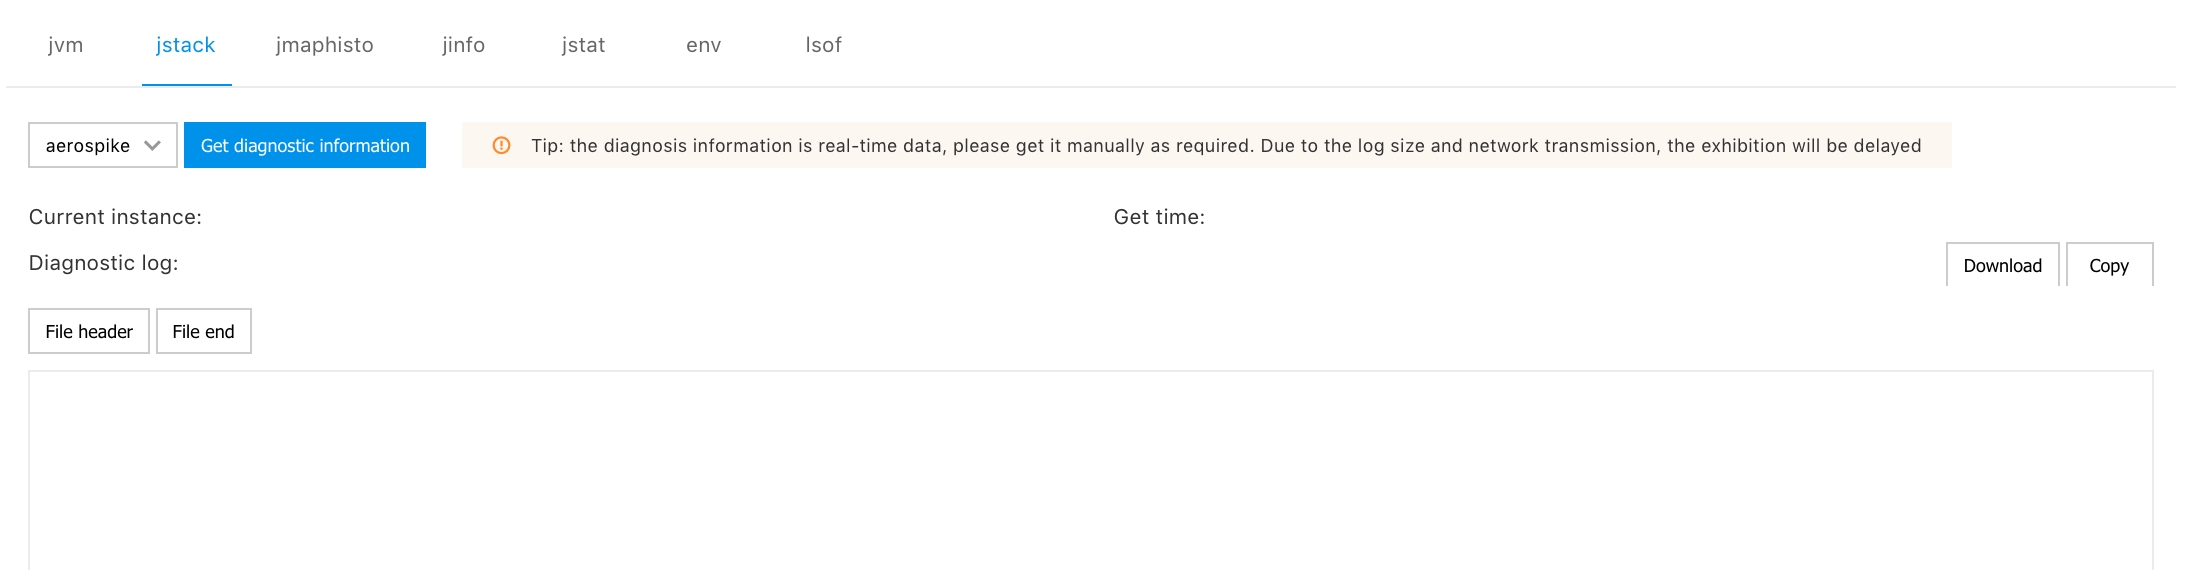
Note:
- Support for diagnostic commands has been added to the recommended Micro packaging script. If you need a custom Micro, make sure that the Micro supports JVM diagnostic commands and system diagnostic commands, otherwise the diagnostic commands will execute abnormally.
-
The jmap and jinfo commands execute ptrace setting that depends on the operating system. If the virtual machine of the WORKER node for the CCE cluster uses the 7.3 and previous centos operating system (that is, the virtual machine operating system manually specified when the CCE cluster is created), the execution of the jmap and jinfo commands will encounter permission problems. At this time, the users need to manually log in to the CCE virtual machine node and execute the following command on the virtual machine to remove the restriction:
echo 0 > /proc/sys/kernel/yama/ptrace_scope
Monitor Custom Configuration
According to the configuration differentiation in application monitoring, the functions required by the users are customized, the unnecessary functions are shielded, and configuration contents are delivered to the user application, and hot update is realized. (Note:All configuration items take effect without restarting the application)
Configuration's effective level
Currently support user space Global and Application Two configuration effective levels; application-level configuration takes precedence over global and will override global configuration.
Configuration's content
Currently support three types of configurations as follows:
-
Plug-in switch: Whether to disable a certain plug-in. Tick single/multiple plug-ins is disabled; currently supported plug-ins include.
- httpclient4-plugin
- mysql-plugin
- restemplate-plugin
- springmvc-plugin
- Sampling rate setting: Setting the sampling rate of the information collected by the monitoring probe and adjusting it to an appropriate sampling rate can reduce unnecessary data transmission and lower the impact on application performance. Value range: 0%~100%. This configuration supports both java and mesh applications.
Note:When the sampling rate is set to 0%, collection will stop. Will affect the normal use of functions such as topology and call chain. - Setting of SQL collection threshold: Setting the SQL collection threshold will only collect statements that may be slow SQL or the user cares about. SQL less than the set value will not be collected.