
Chart drill down
When you click a part of this chart, you can open a new chart or hyperlink to view the details related to this part of the chart. Sugar supports unlimited levels of RIH. As long as the pop-up chart of drill down also supports drill down, you can continue to configure further drill down.
When editing a report, you can see the drill down tab in the control panel of some charts:
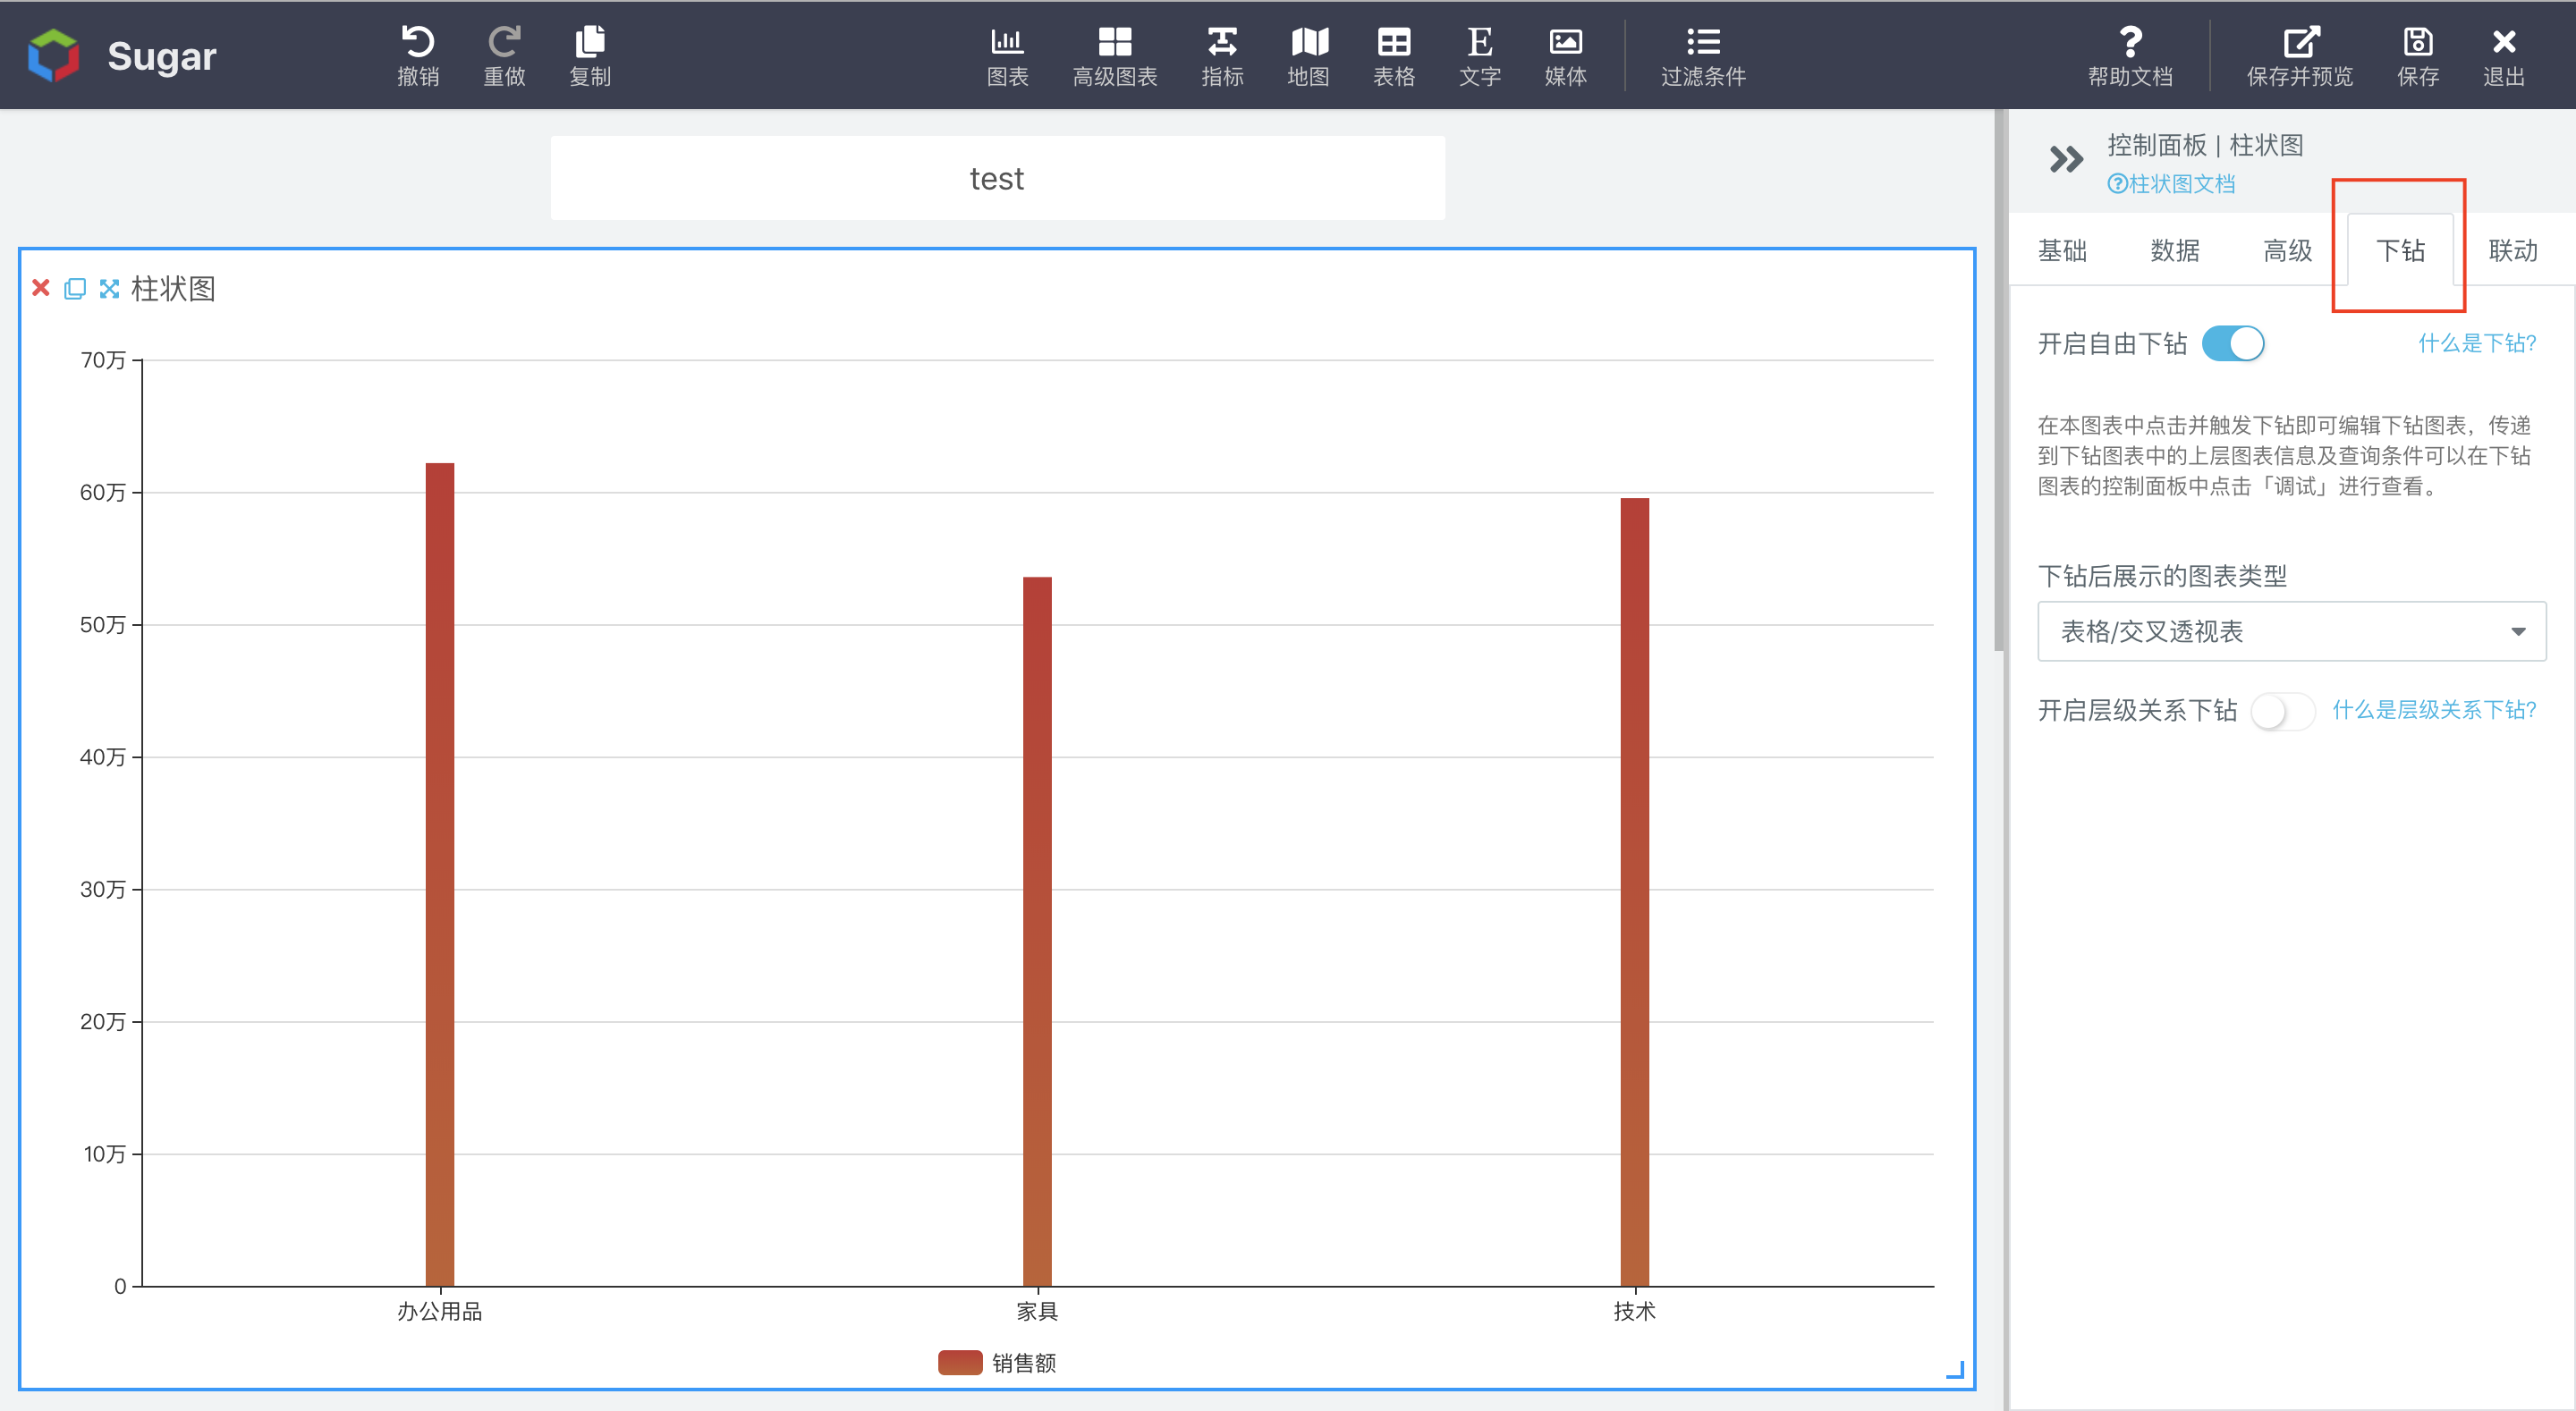
Each chart triggers drill down in different ways. For example, a line chart is triggered by clicking a point on the line, a map by clicking an area, and a table by clicking a row or column.
Sugar provides two drill-down modes: free drill down and hierarchical drill down. Free drill down means that you can freely configure any configuration items of drill down chart. Hierarchical drill down automatically generates all drill down configuration items for you when a dimension with hierarchical relationship is used in your data configuration item.
Let's start with hierarchical drill down.
Hierarchical Drill Down
Hierarchical drill-down means that, if the dimension axis of a chart uses a dimension with hierarchical relationship, then the hierarchical drill-down can be enabled to generate configuration items of all drill-down charts with zero configuration. Currently supported charts include column chart, line chart, pie chart, regional color map, table and carousel table. Among which, the configuration of tables is slightly different from other charts.
Set Hierarchy Field
Hierarchical drill down generates configuration items according to the hierarchy field. Hierarchical fields refers to a group of fields with hierarchical relationship, for example, country (China ), region (northwest, northeast ), and city (Xi'an ). Therefore, we should firstly understand how to set the hierarchy fields.
We take the three dimensions: country, region and city as an example to explain how to create hierarchy fields.
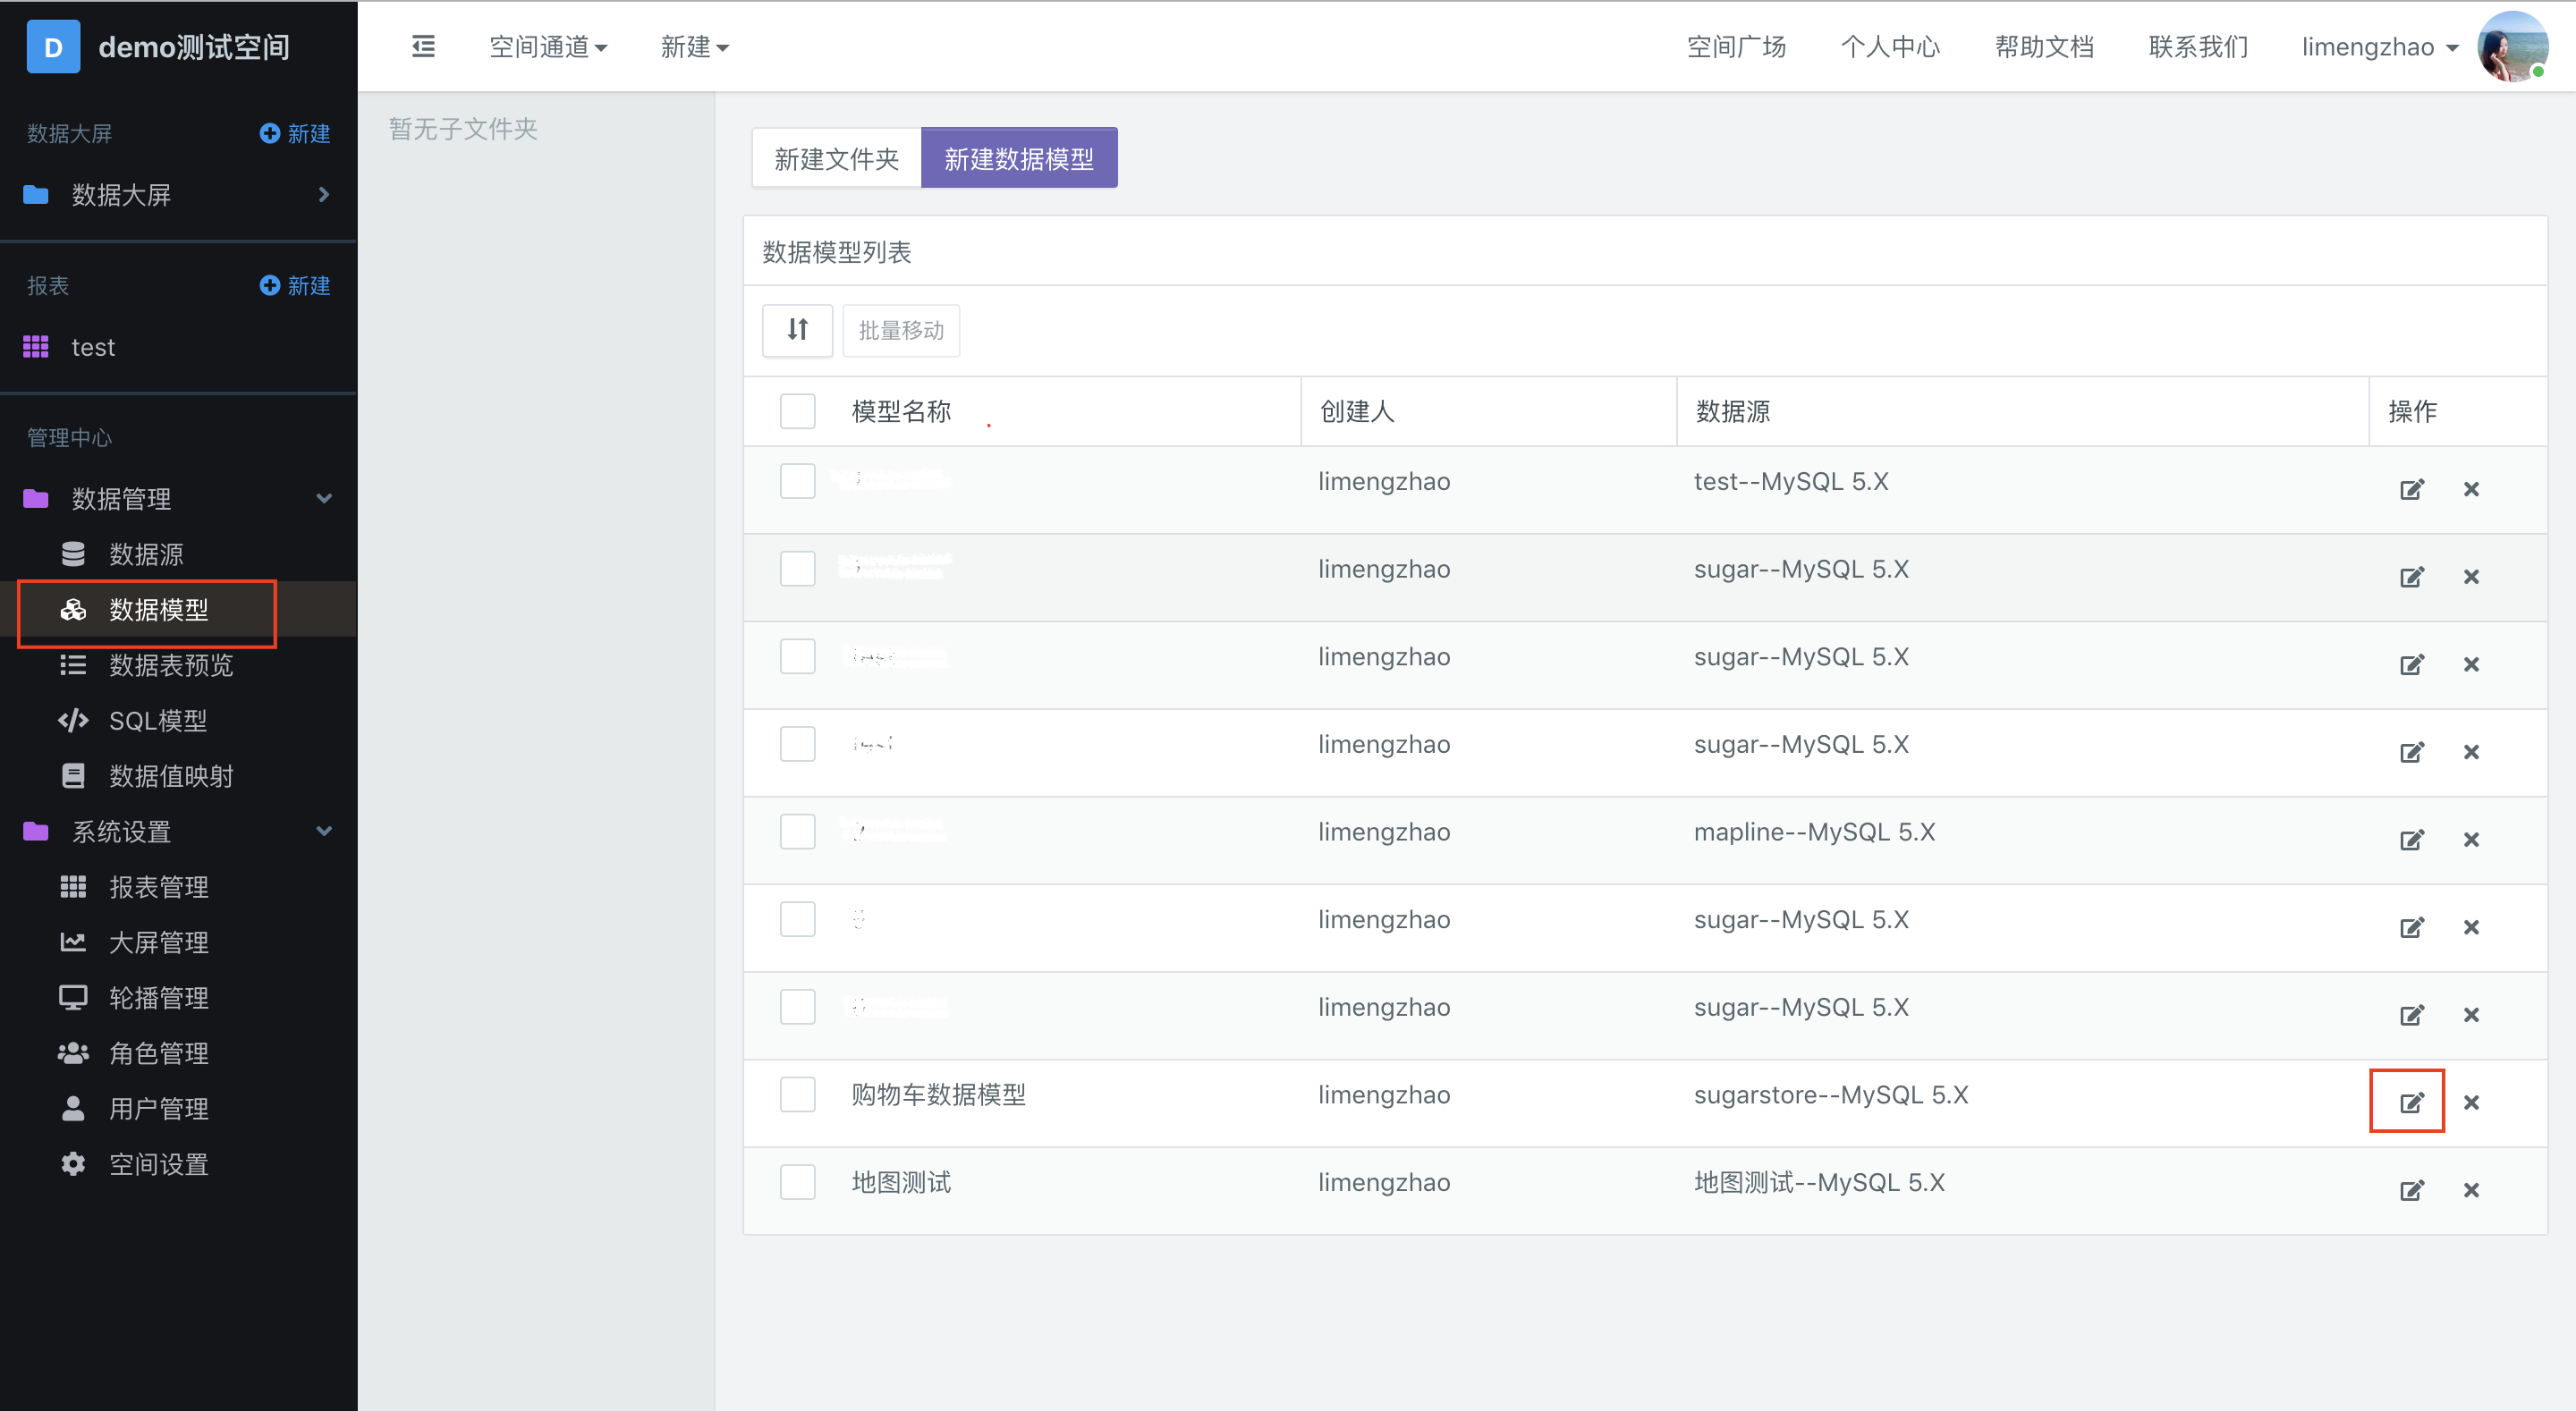
First, click [Data Model] in [Data Management] on the left, locate the data model you want to edit in the right page, and click [Edit] to enter the data model editing page. The operation is as follows:
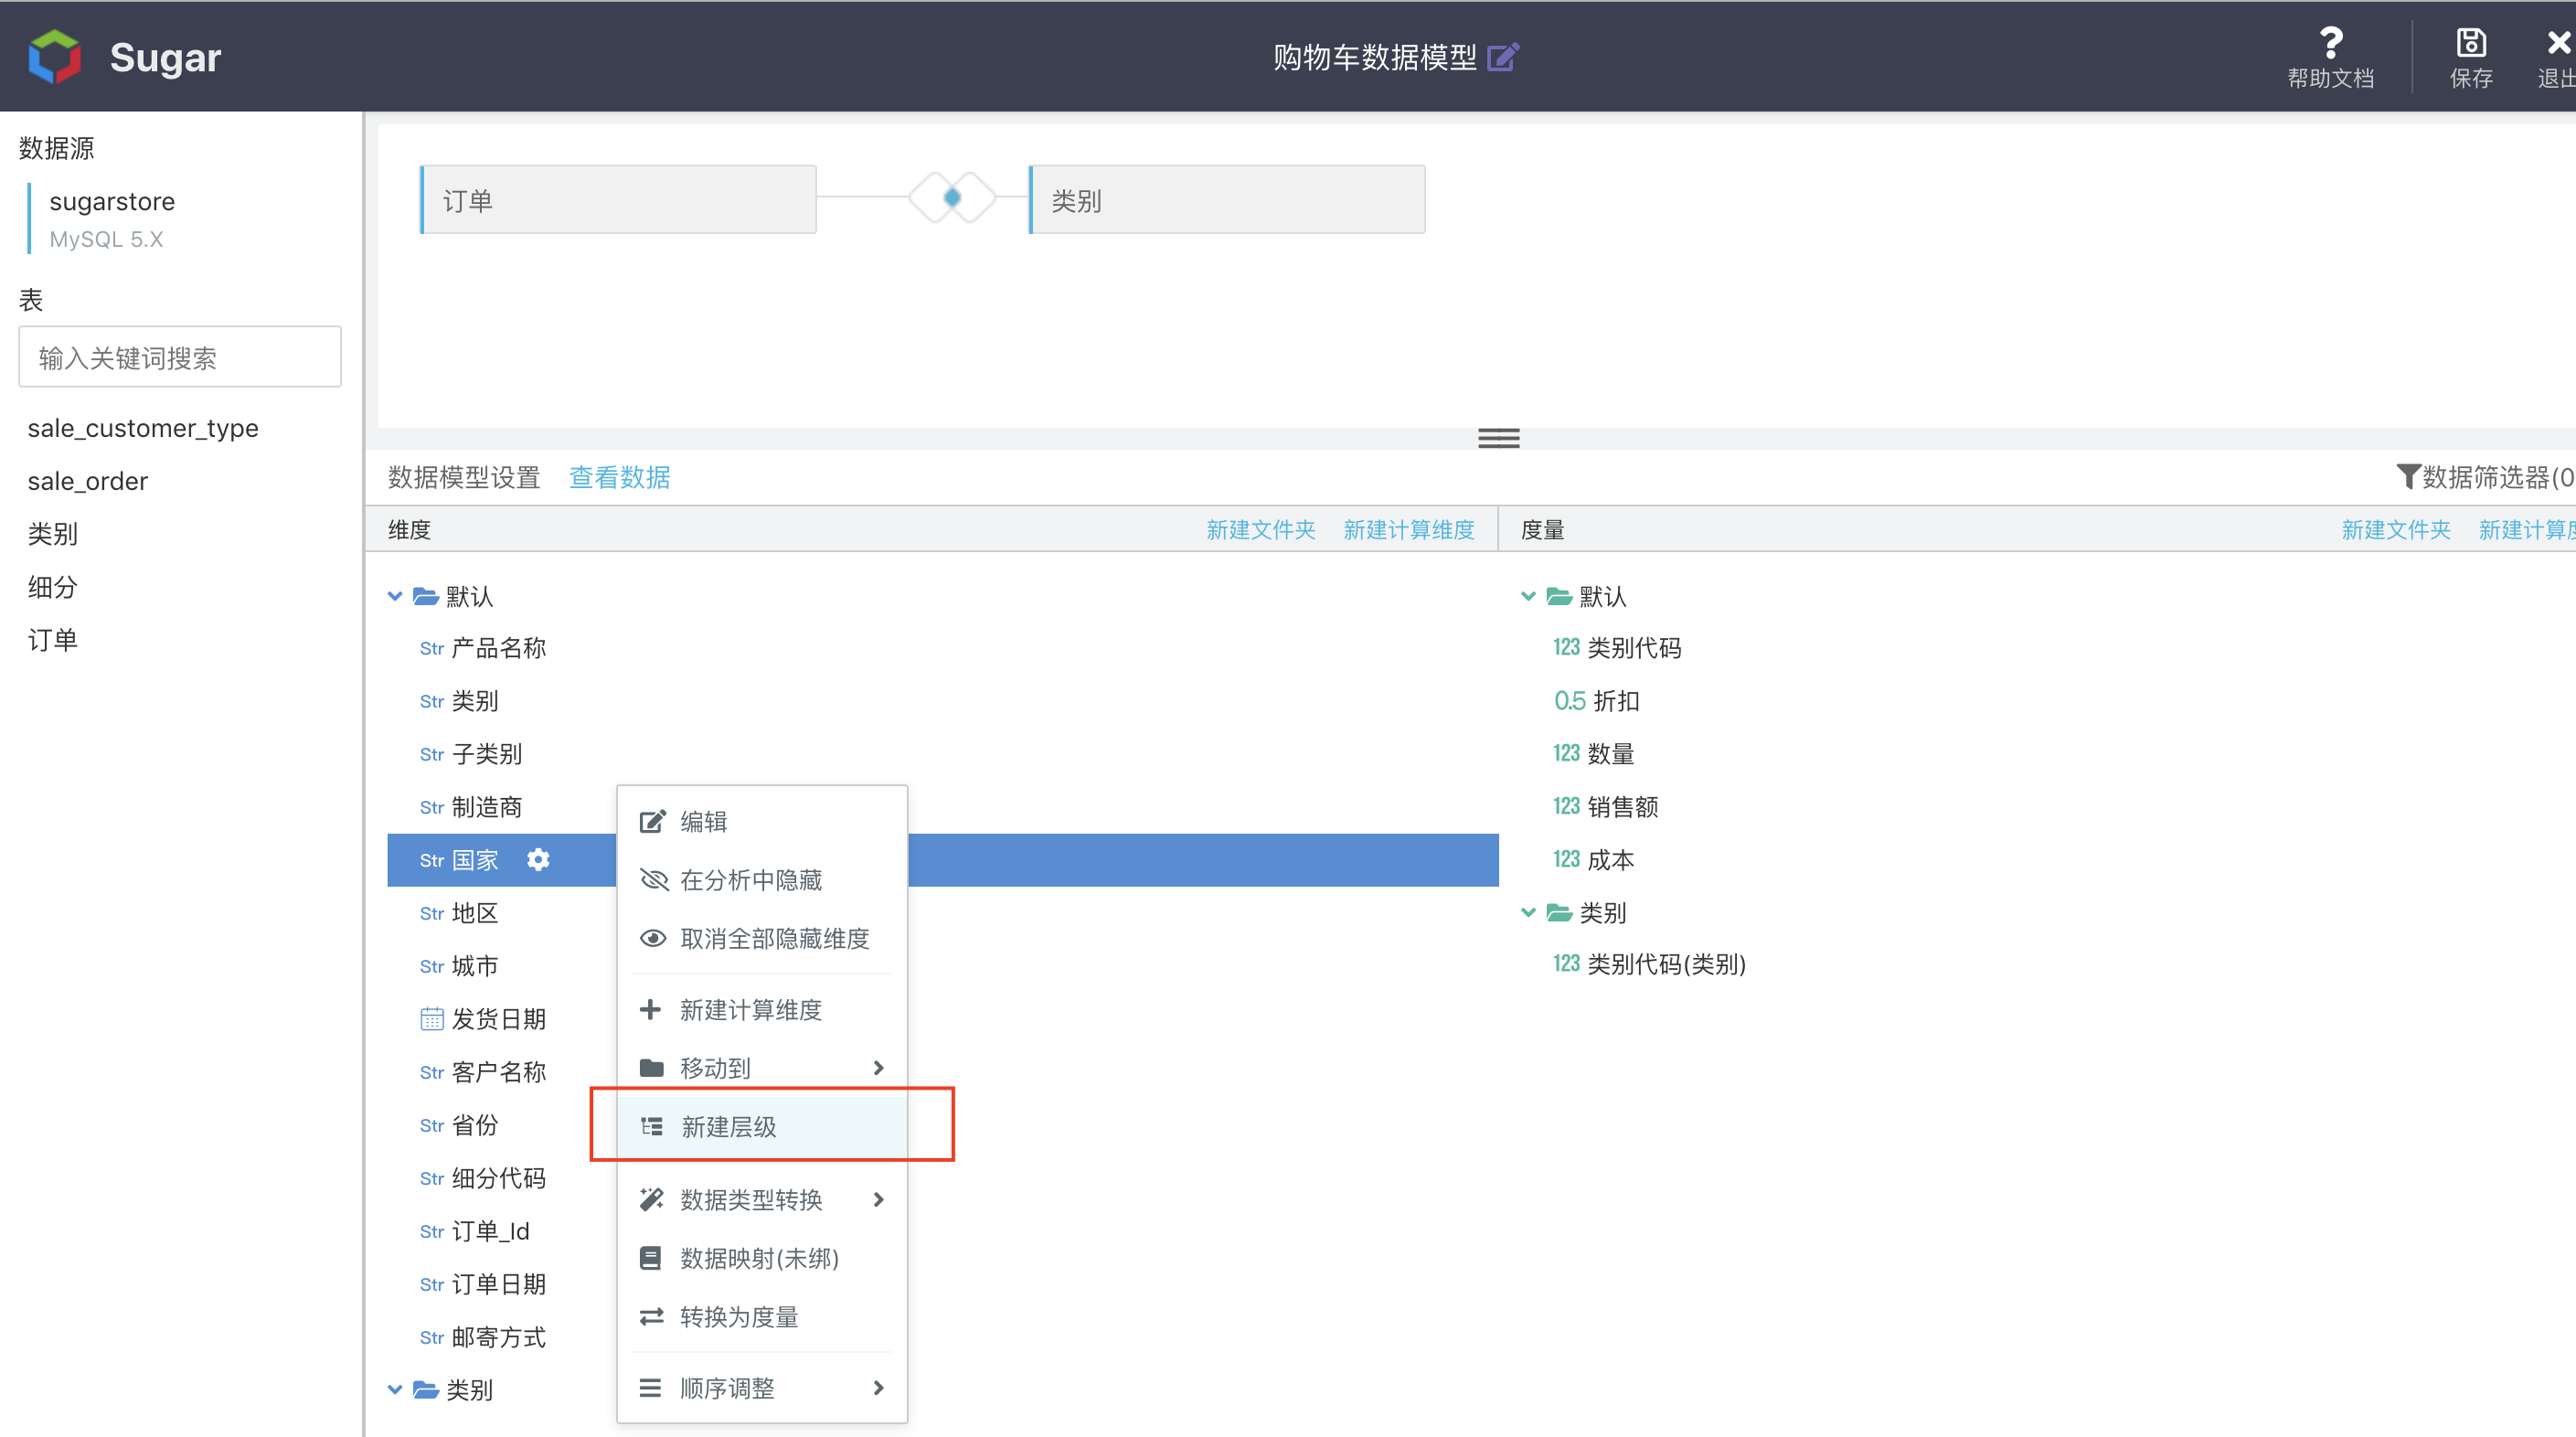
Then, on the editing page, right-click the dimension that you want to set as a hierarchical relationship, and select [New Hierarchy] from the pop-up menu.
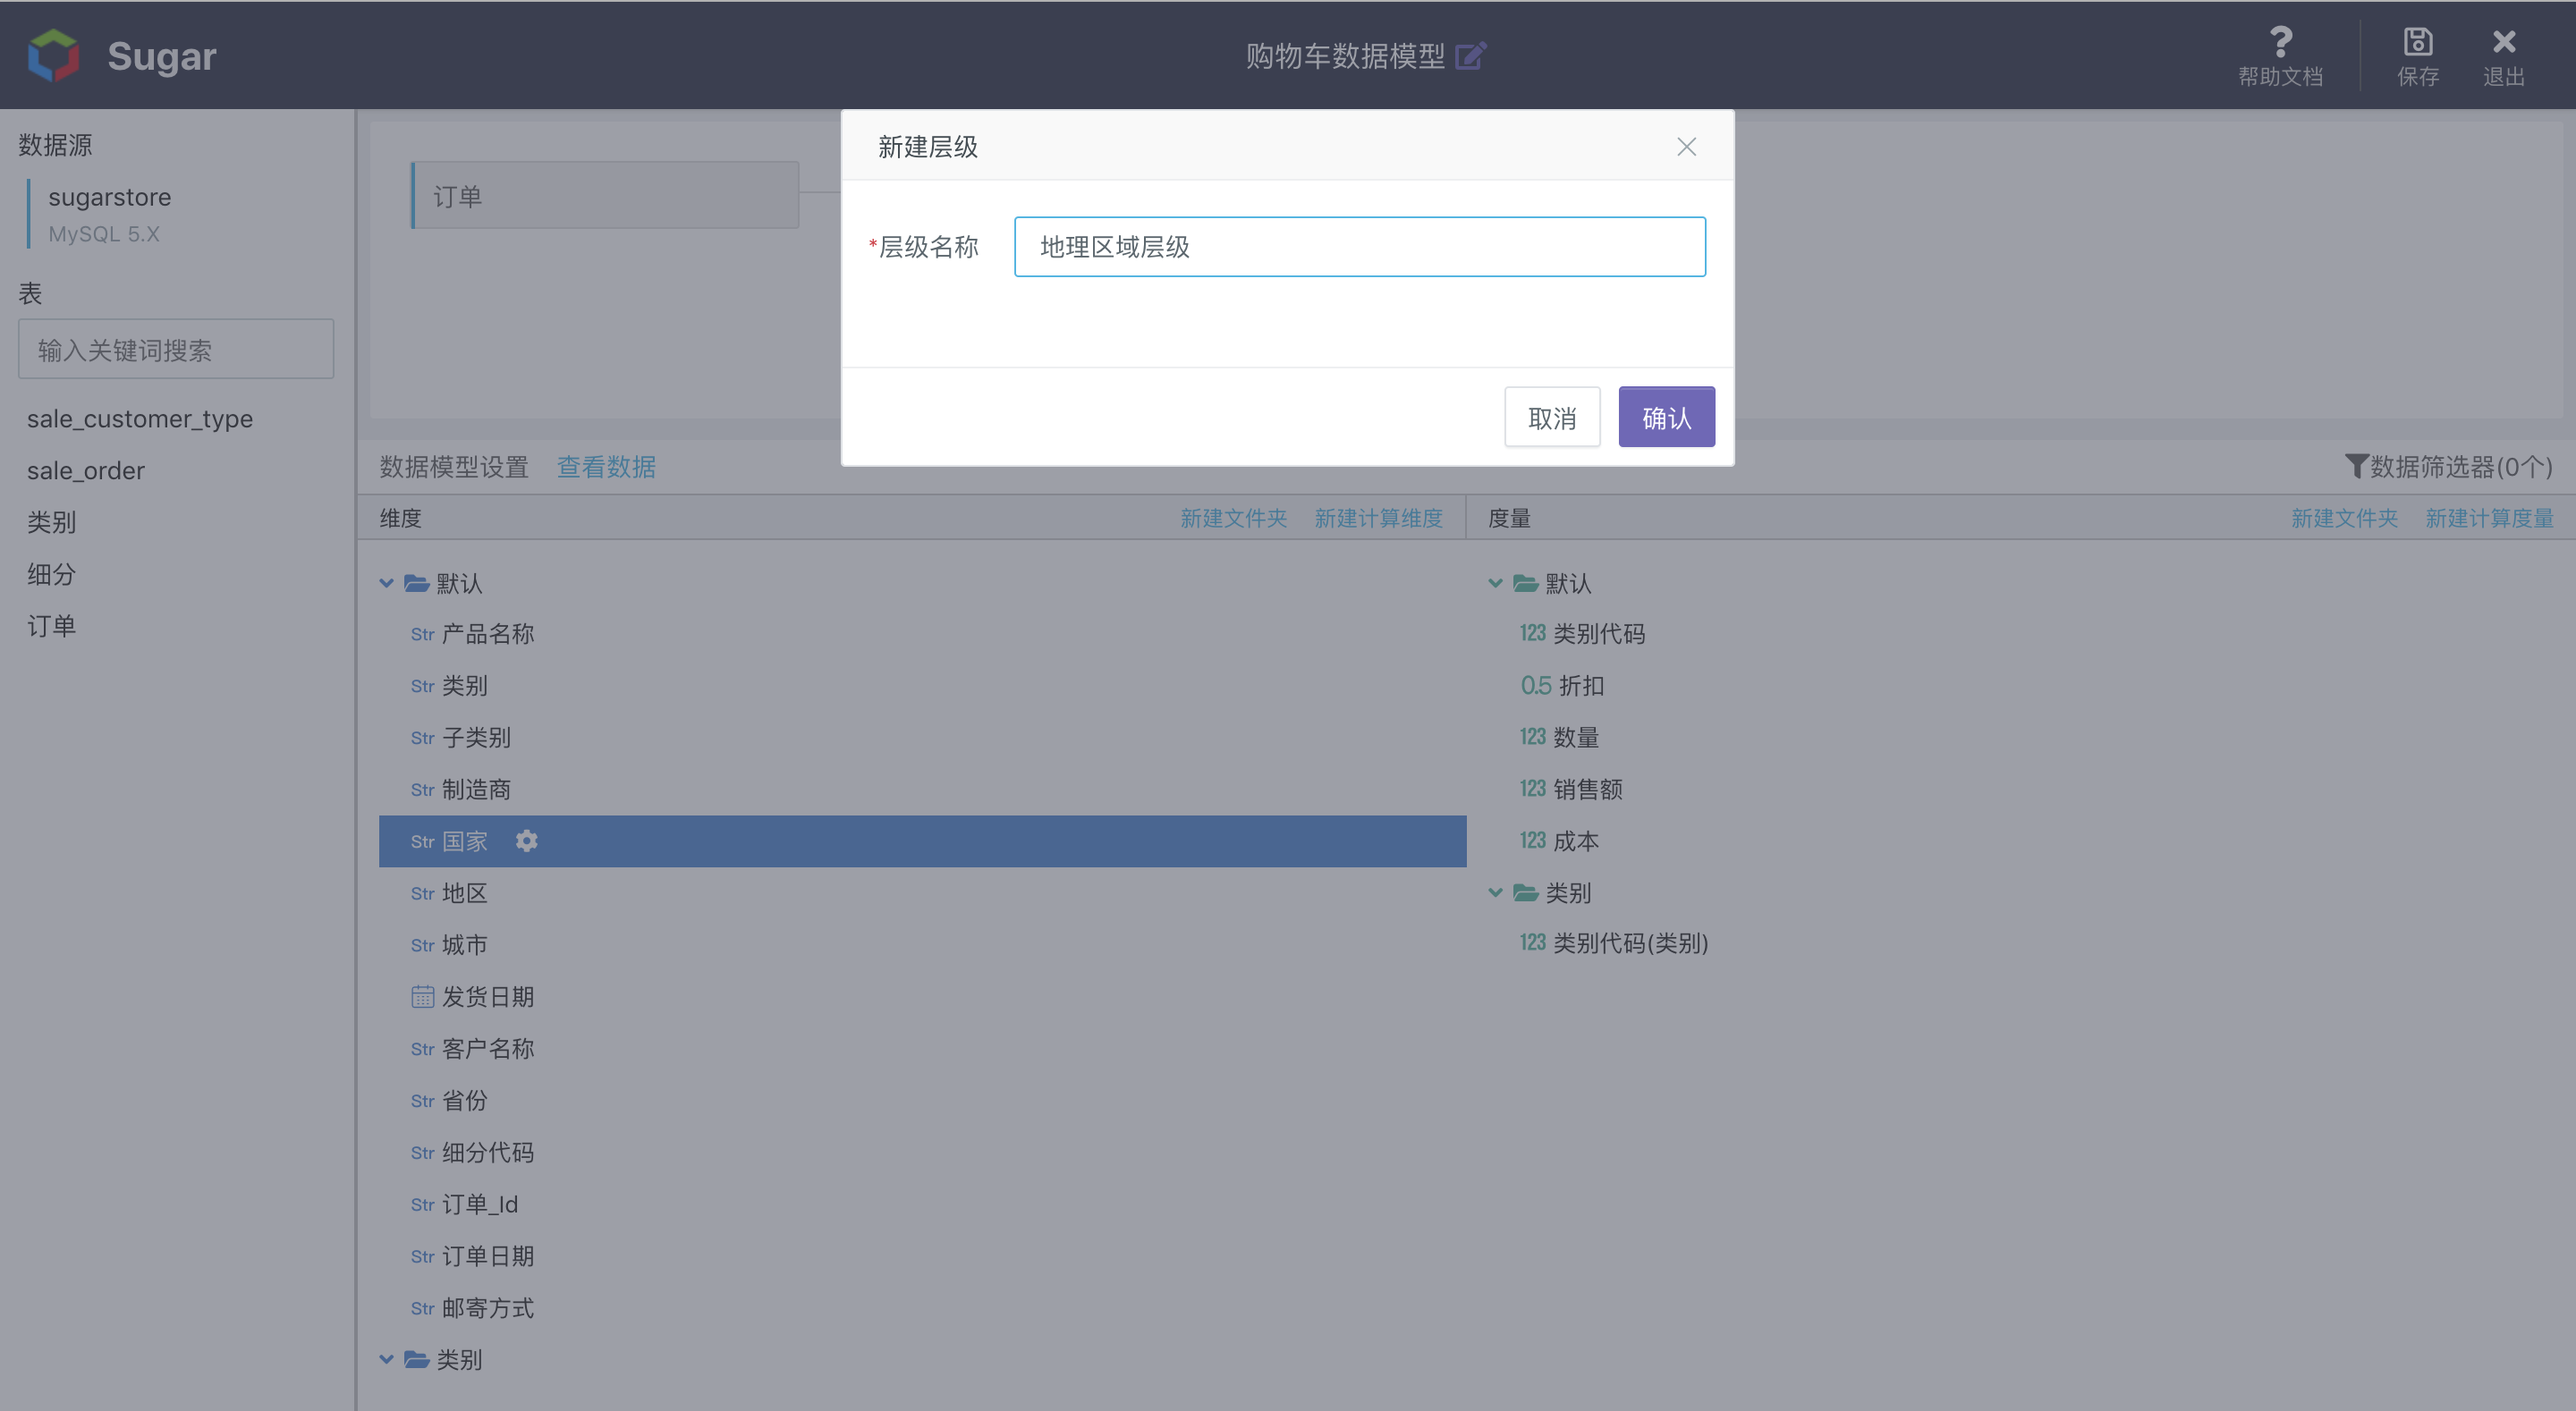
After that, fill in the name of the hierarchical relationship dimension in the pop-up dialog box.
And then drag the region and city dimensions into the geographic region hierarchy, or right-click and select Add Hierarchy in the pop-up menu. 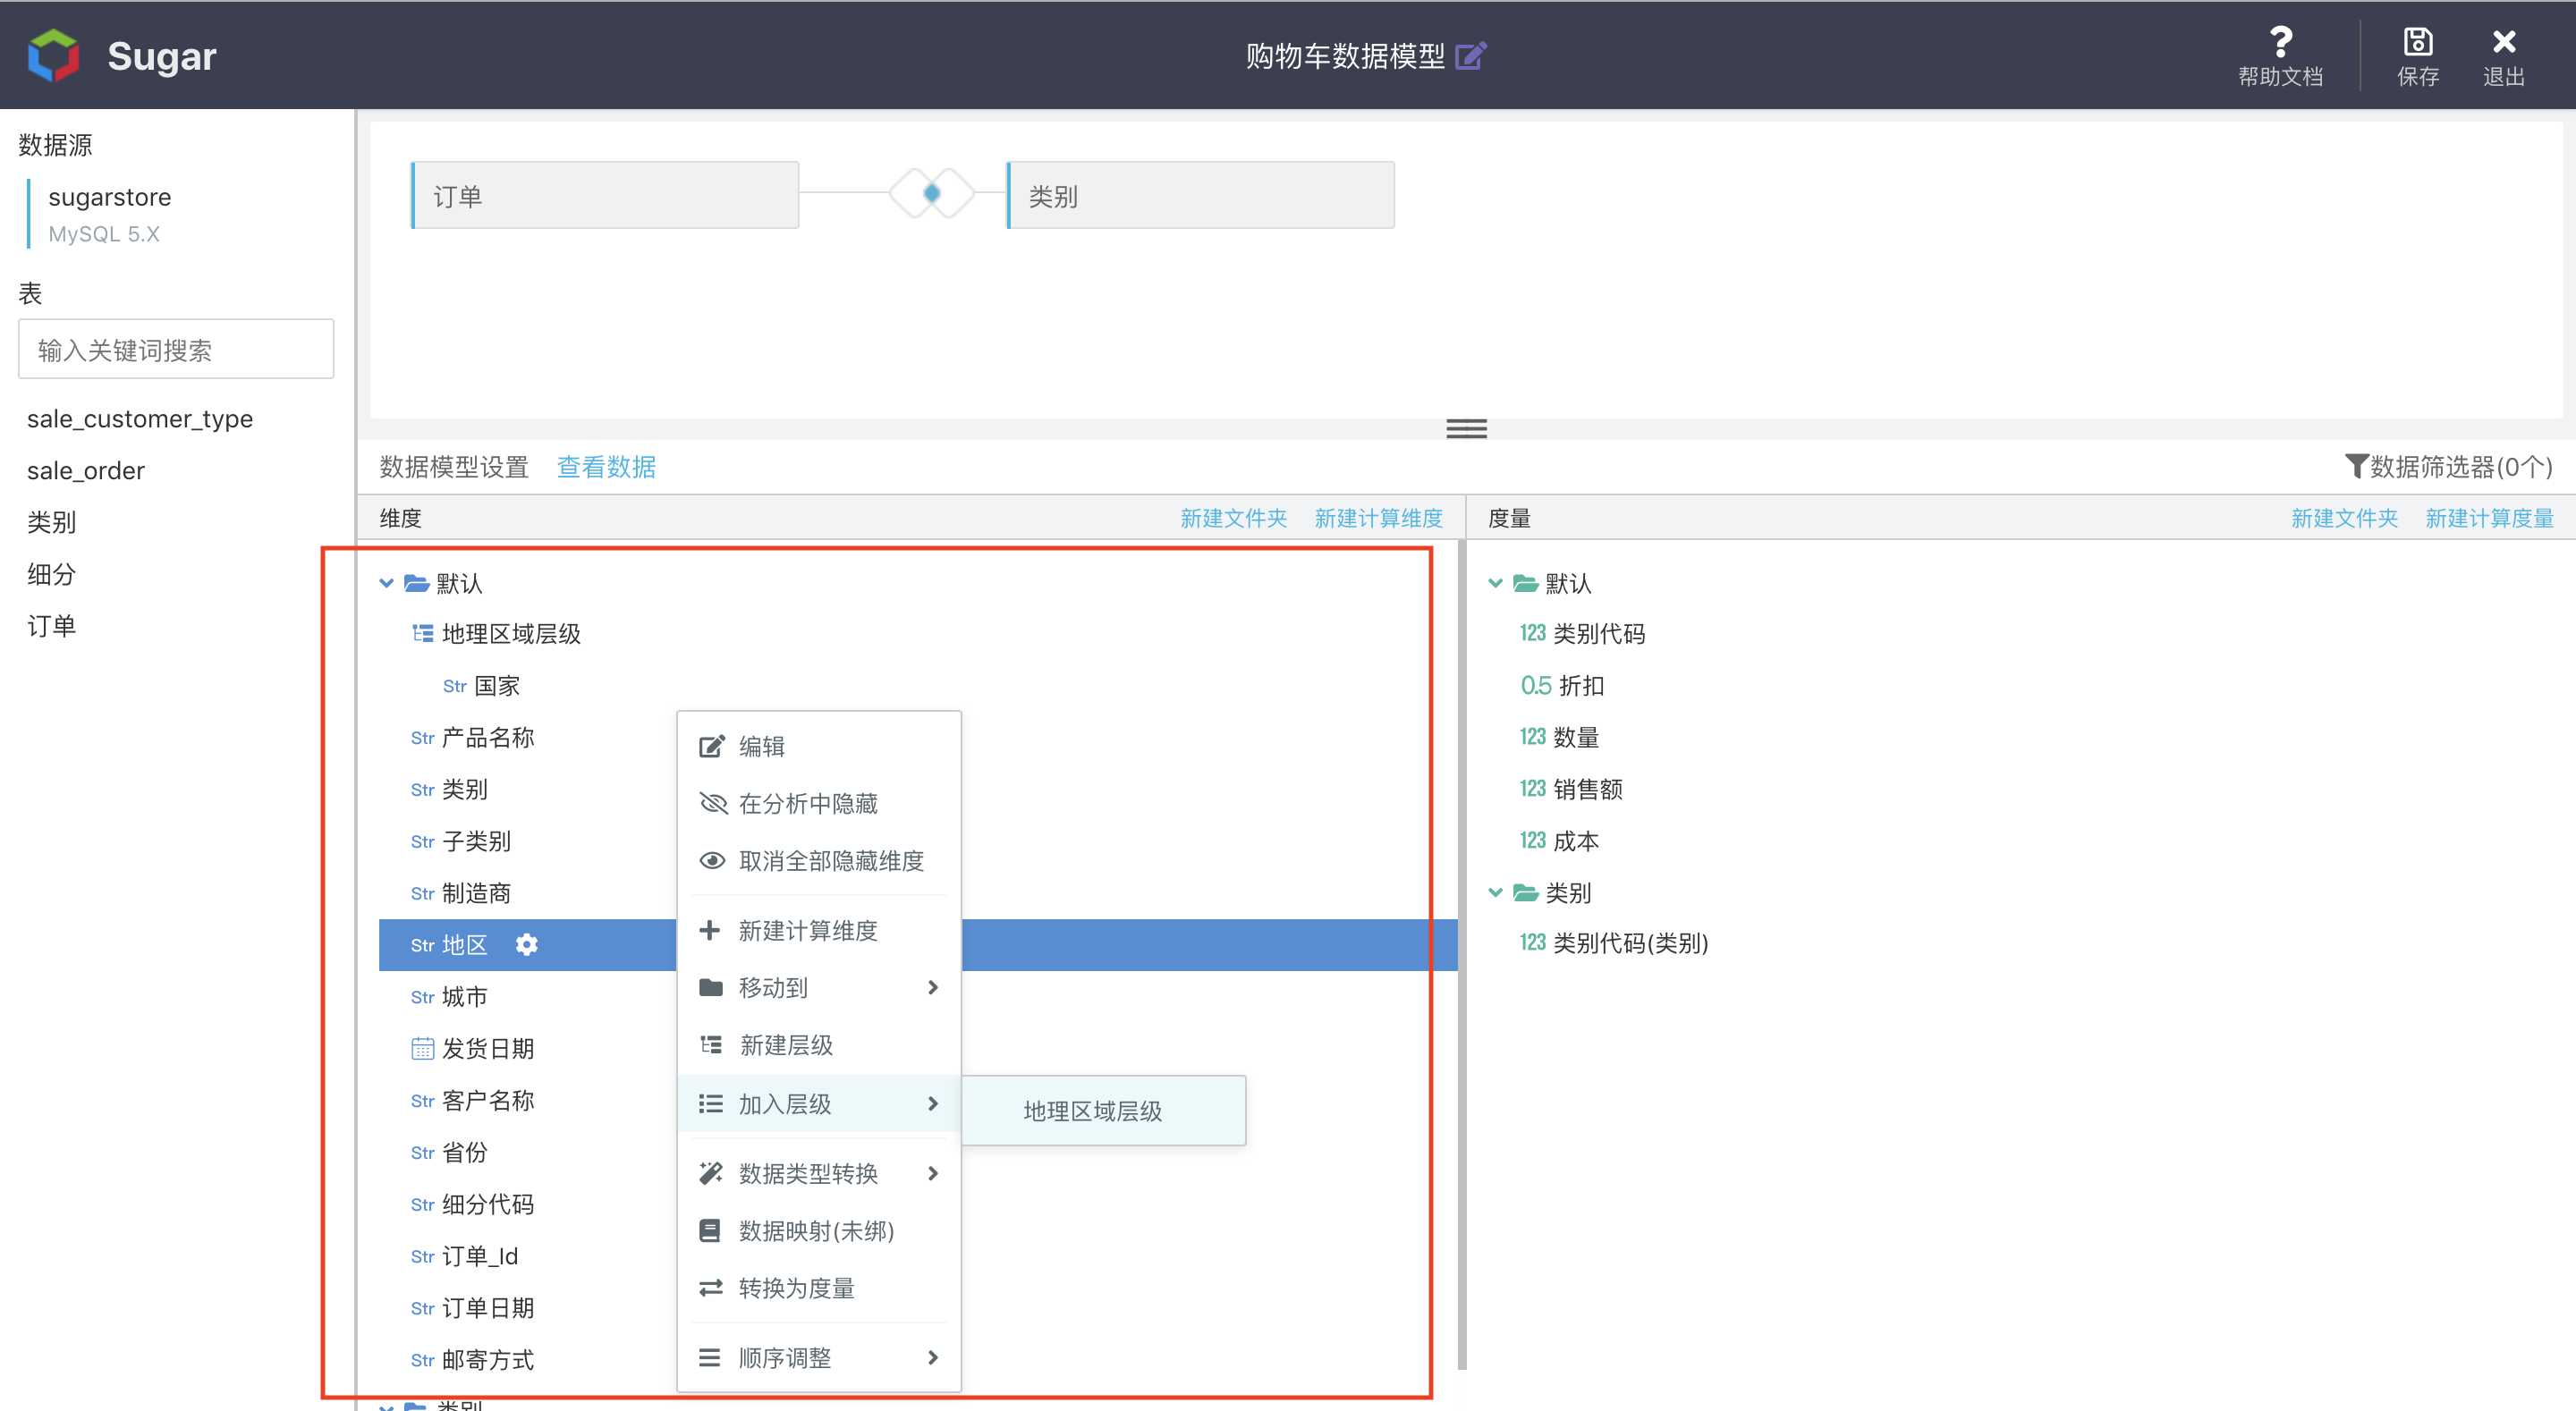
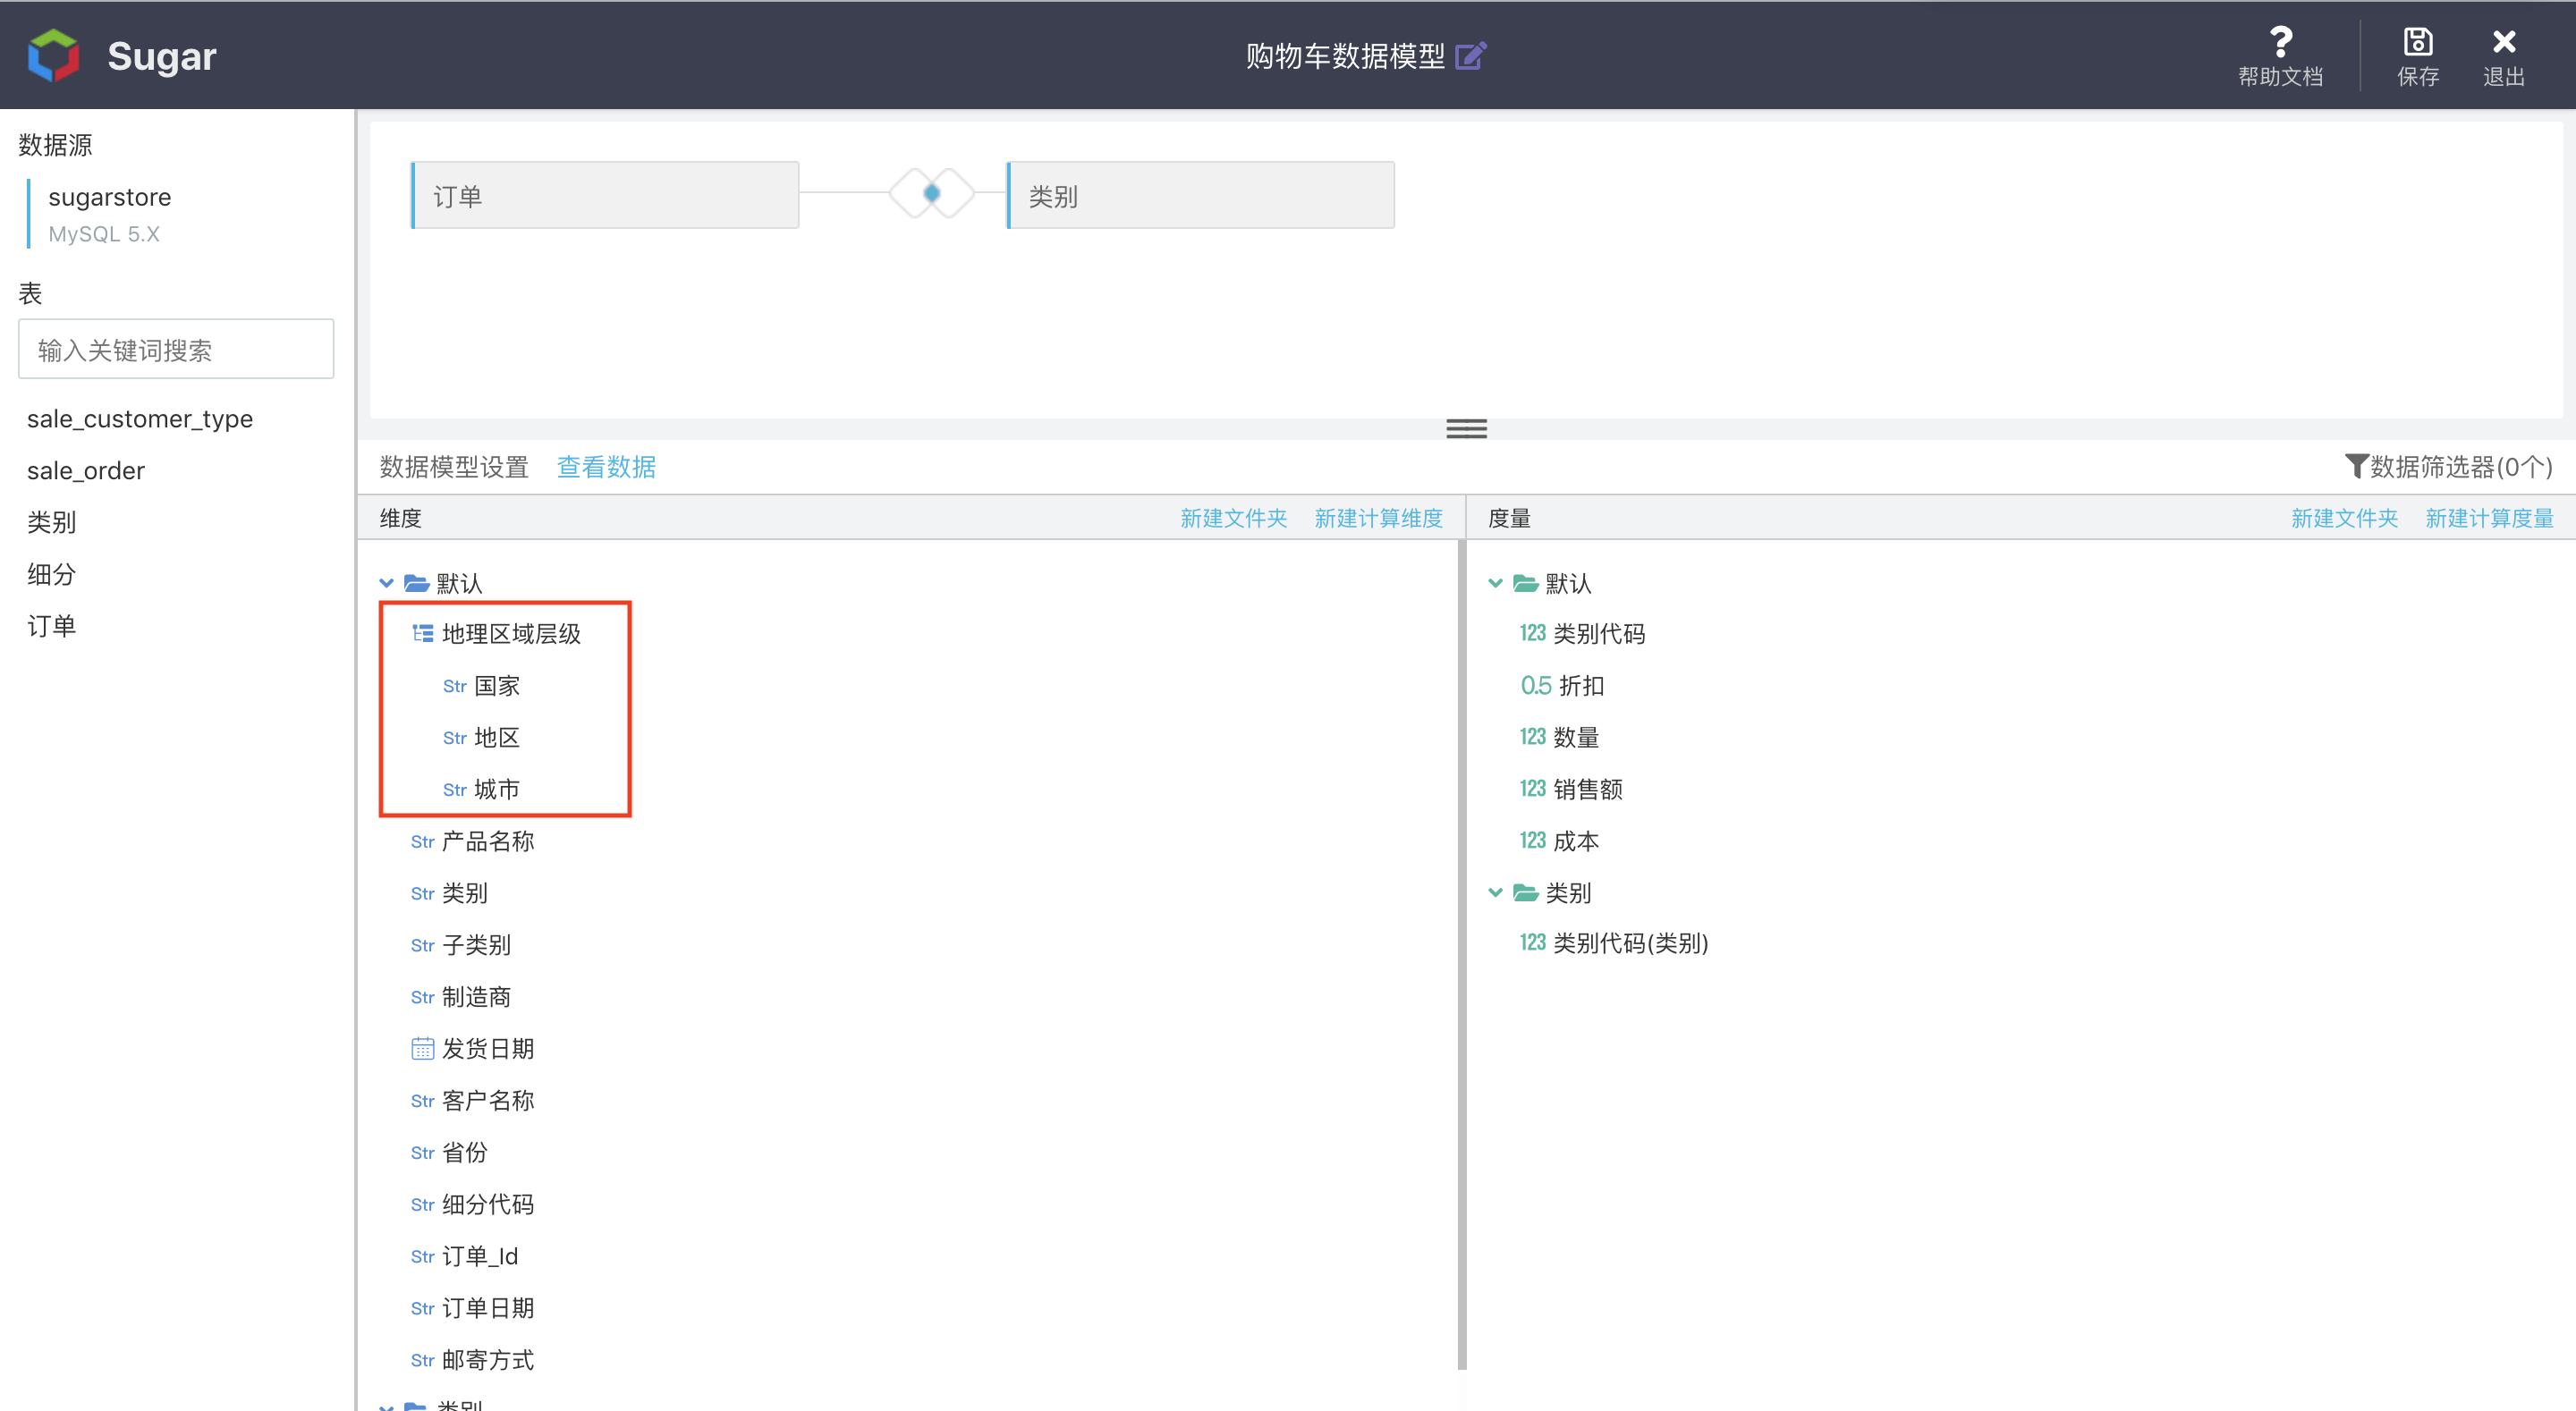
It should be noted that the order of the three dimensions under the geographical region hierarchy represents the hierarchical relationship among three of them. As shown in the figure below, it represents the hierarchical relationship of country -> region -> city.
Now Let's firstly explain the hierarchical drill down of non-tabular charts.
Drill down settings of column chart, line chart, pie chart and regional color map
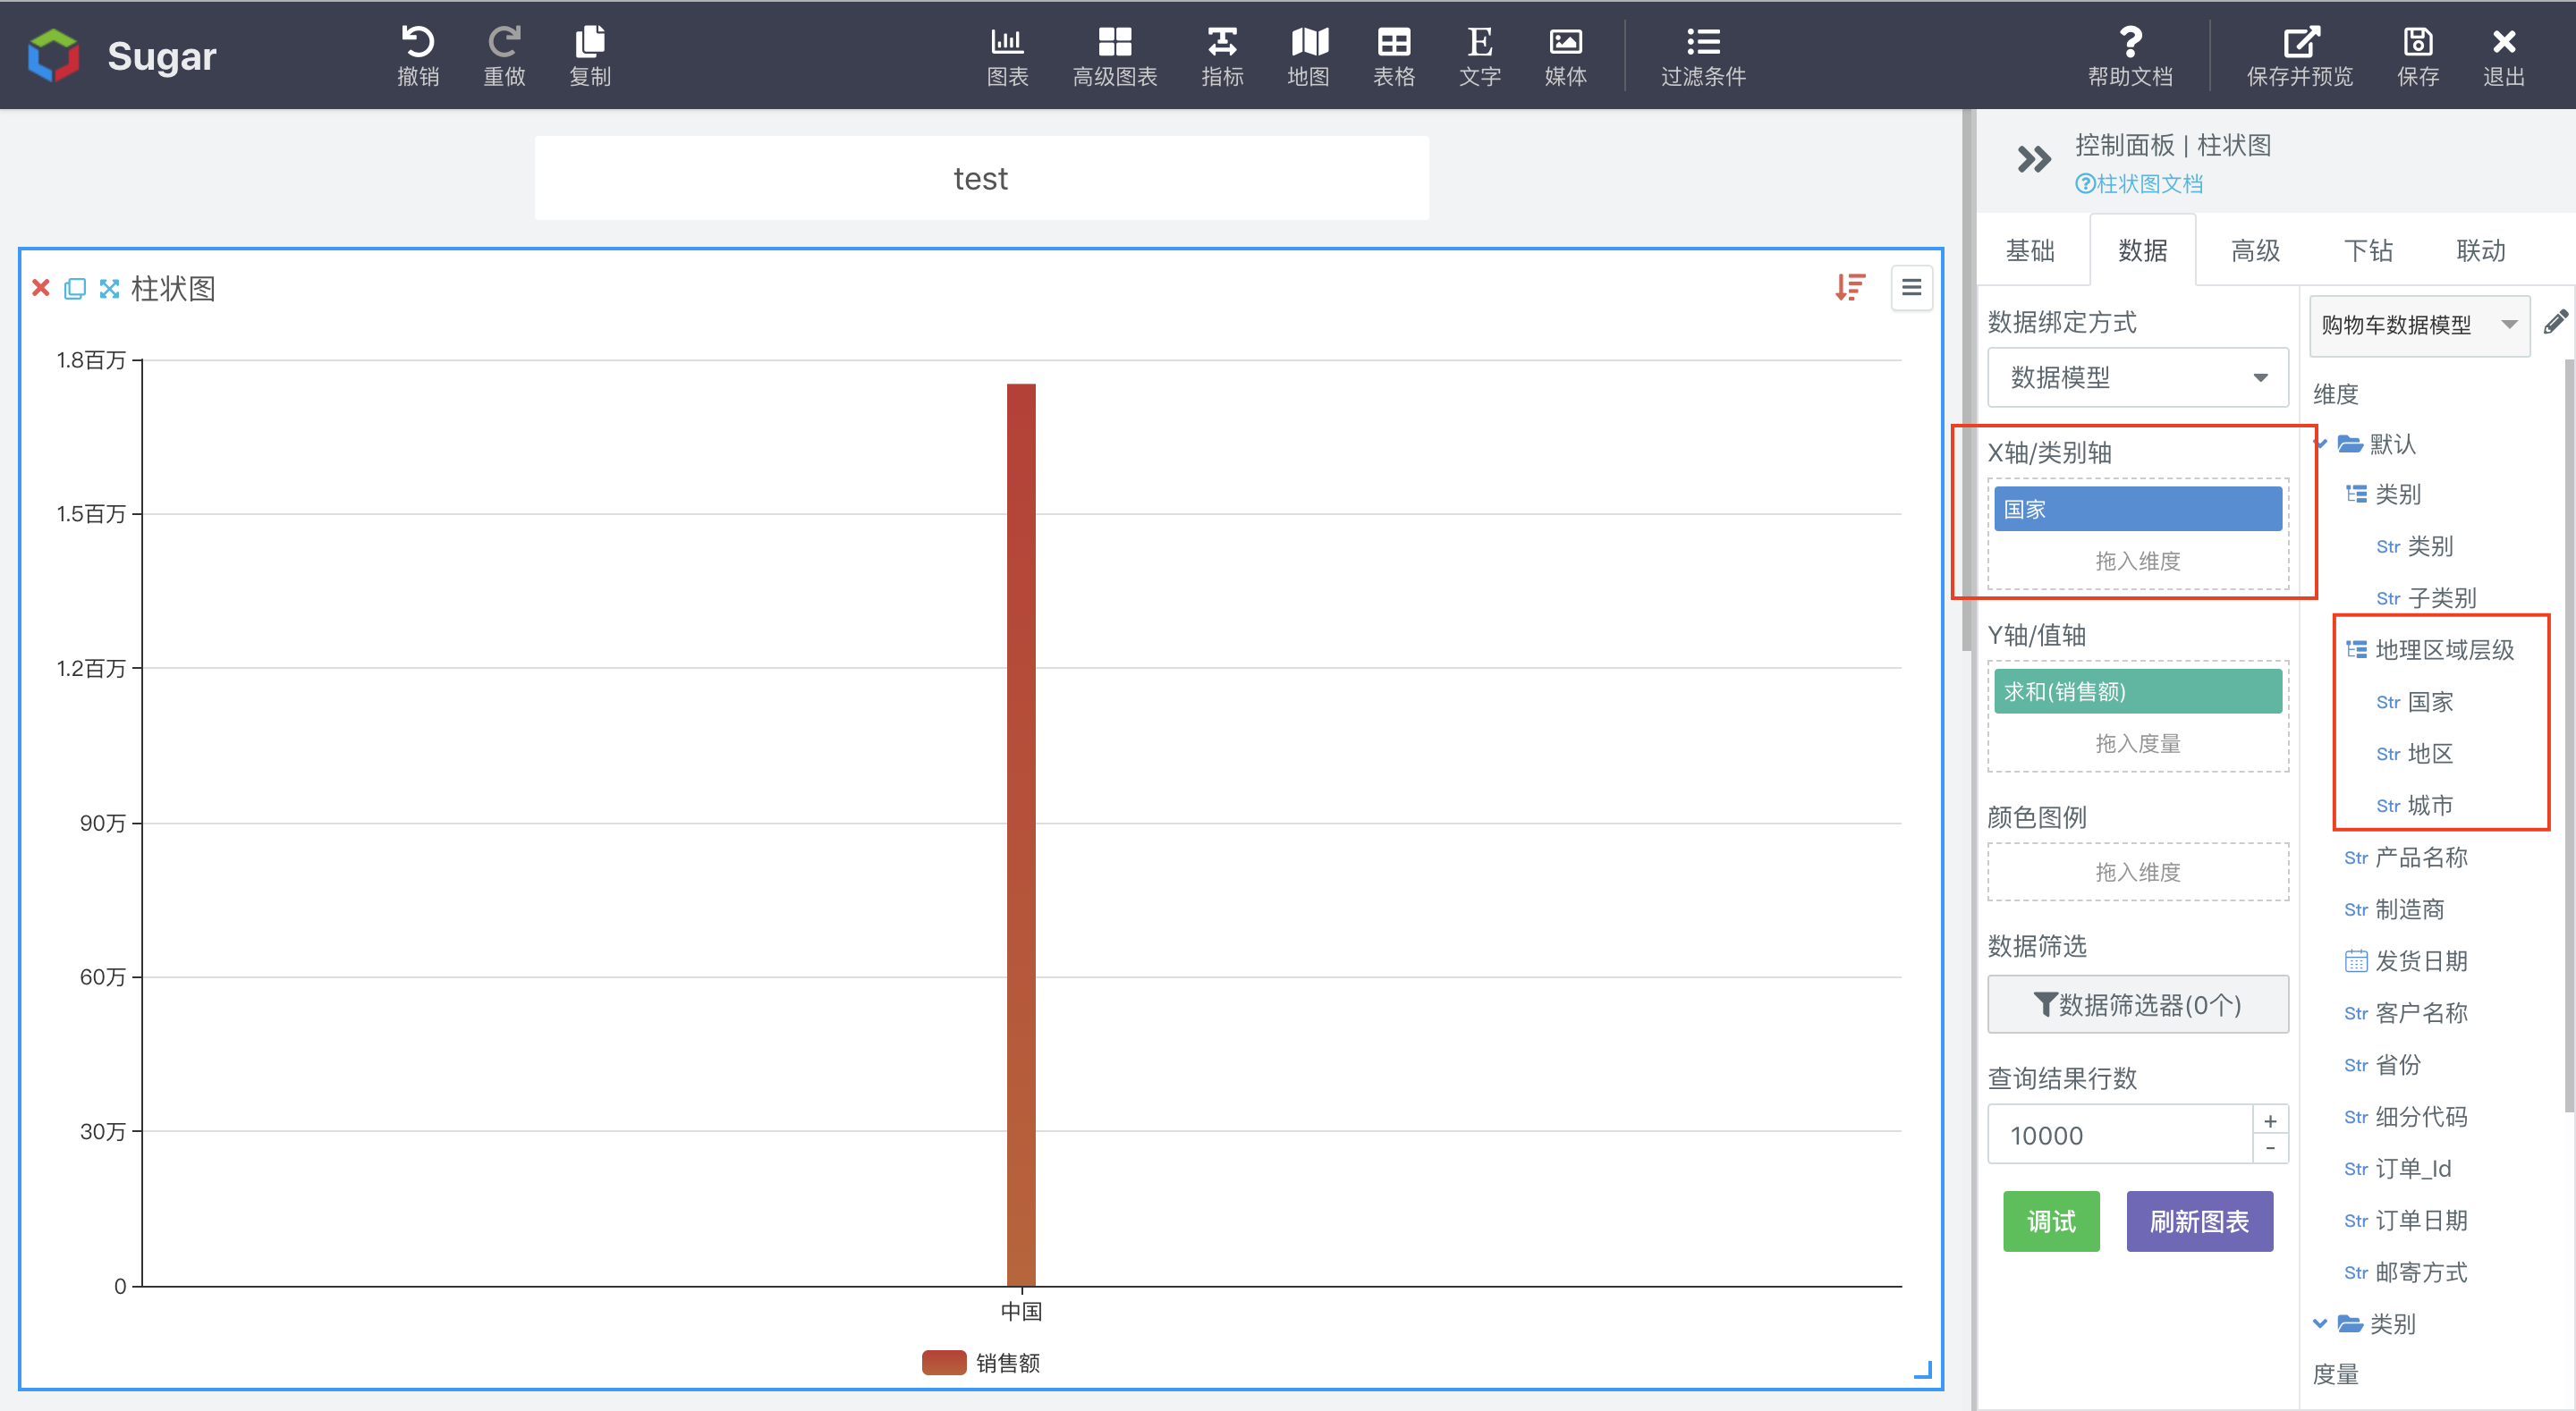
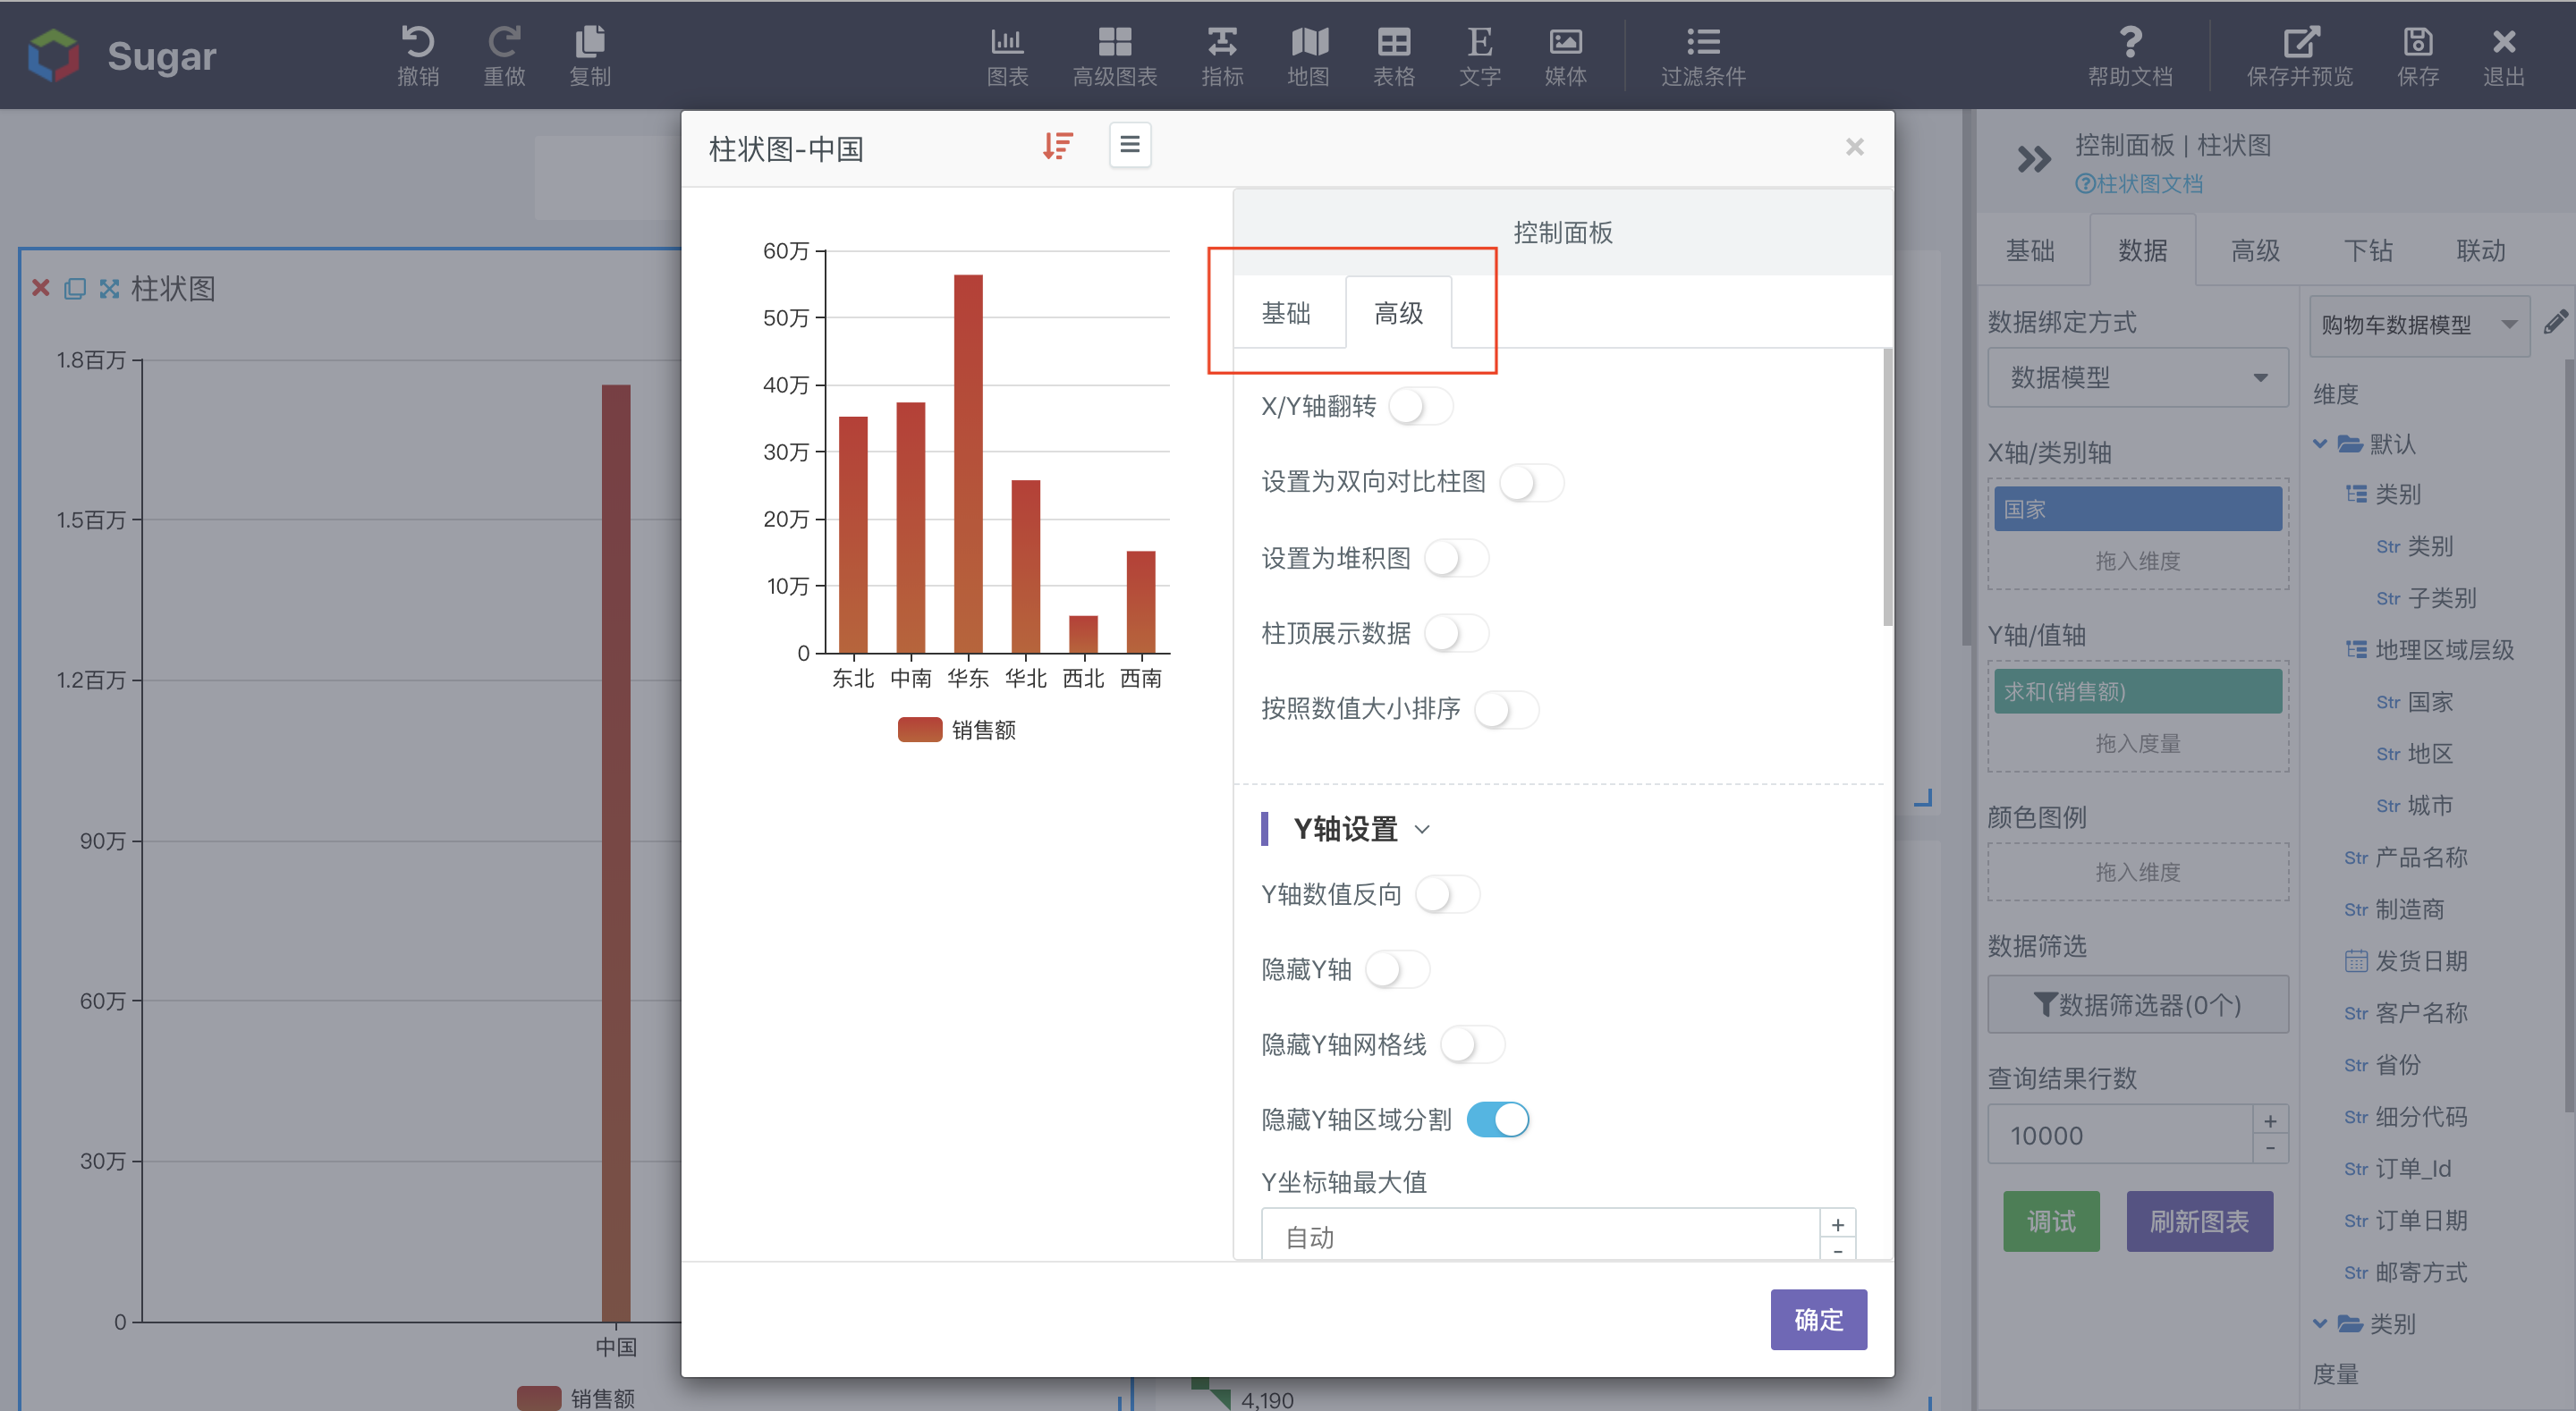
Taking column chart as an example, in the data control panel, the [X-Axis/Category Axis] uses the [Country] dimension in the geographic region hierarchy. You can select the [Country] dimension in the drill down control panel. Except for tables, other charts only support the dimension axis. When setting a single hierarchical relational dimension, turn on the hierarchical drill down, the specific configuration of [Data] of column chart is shown in figure below:
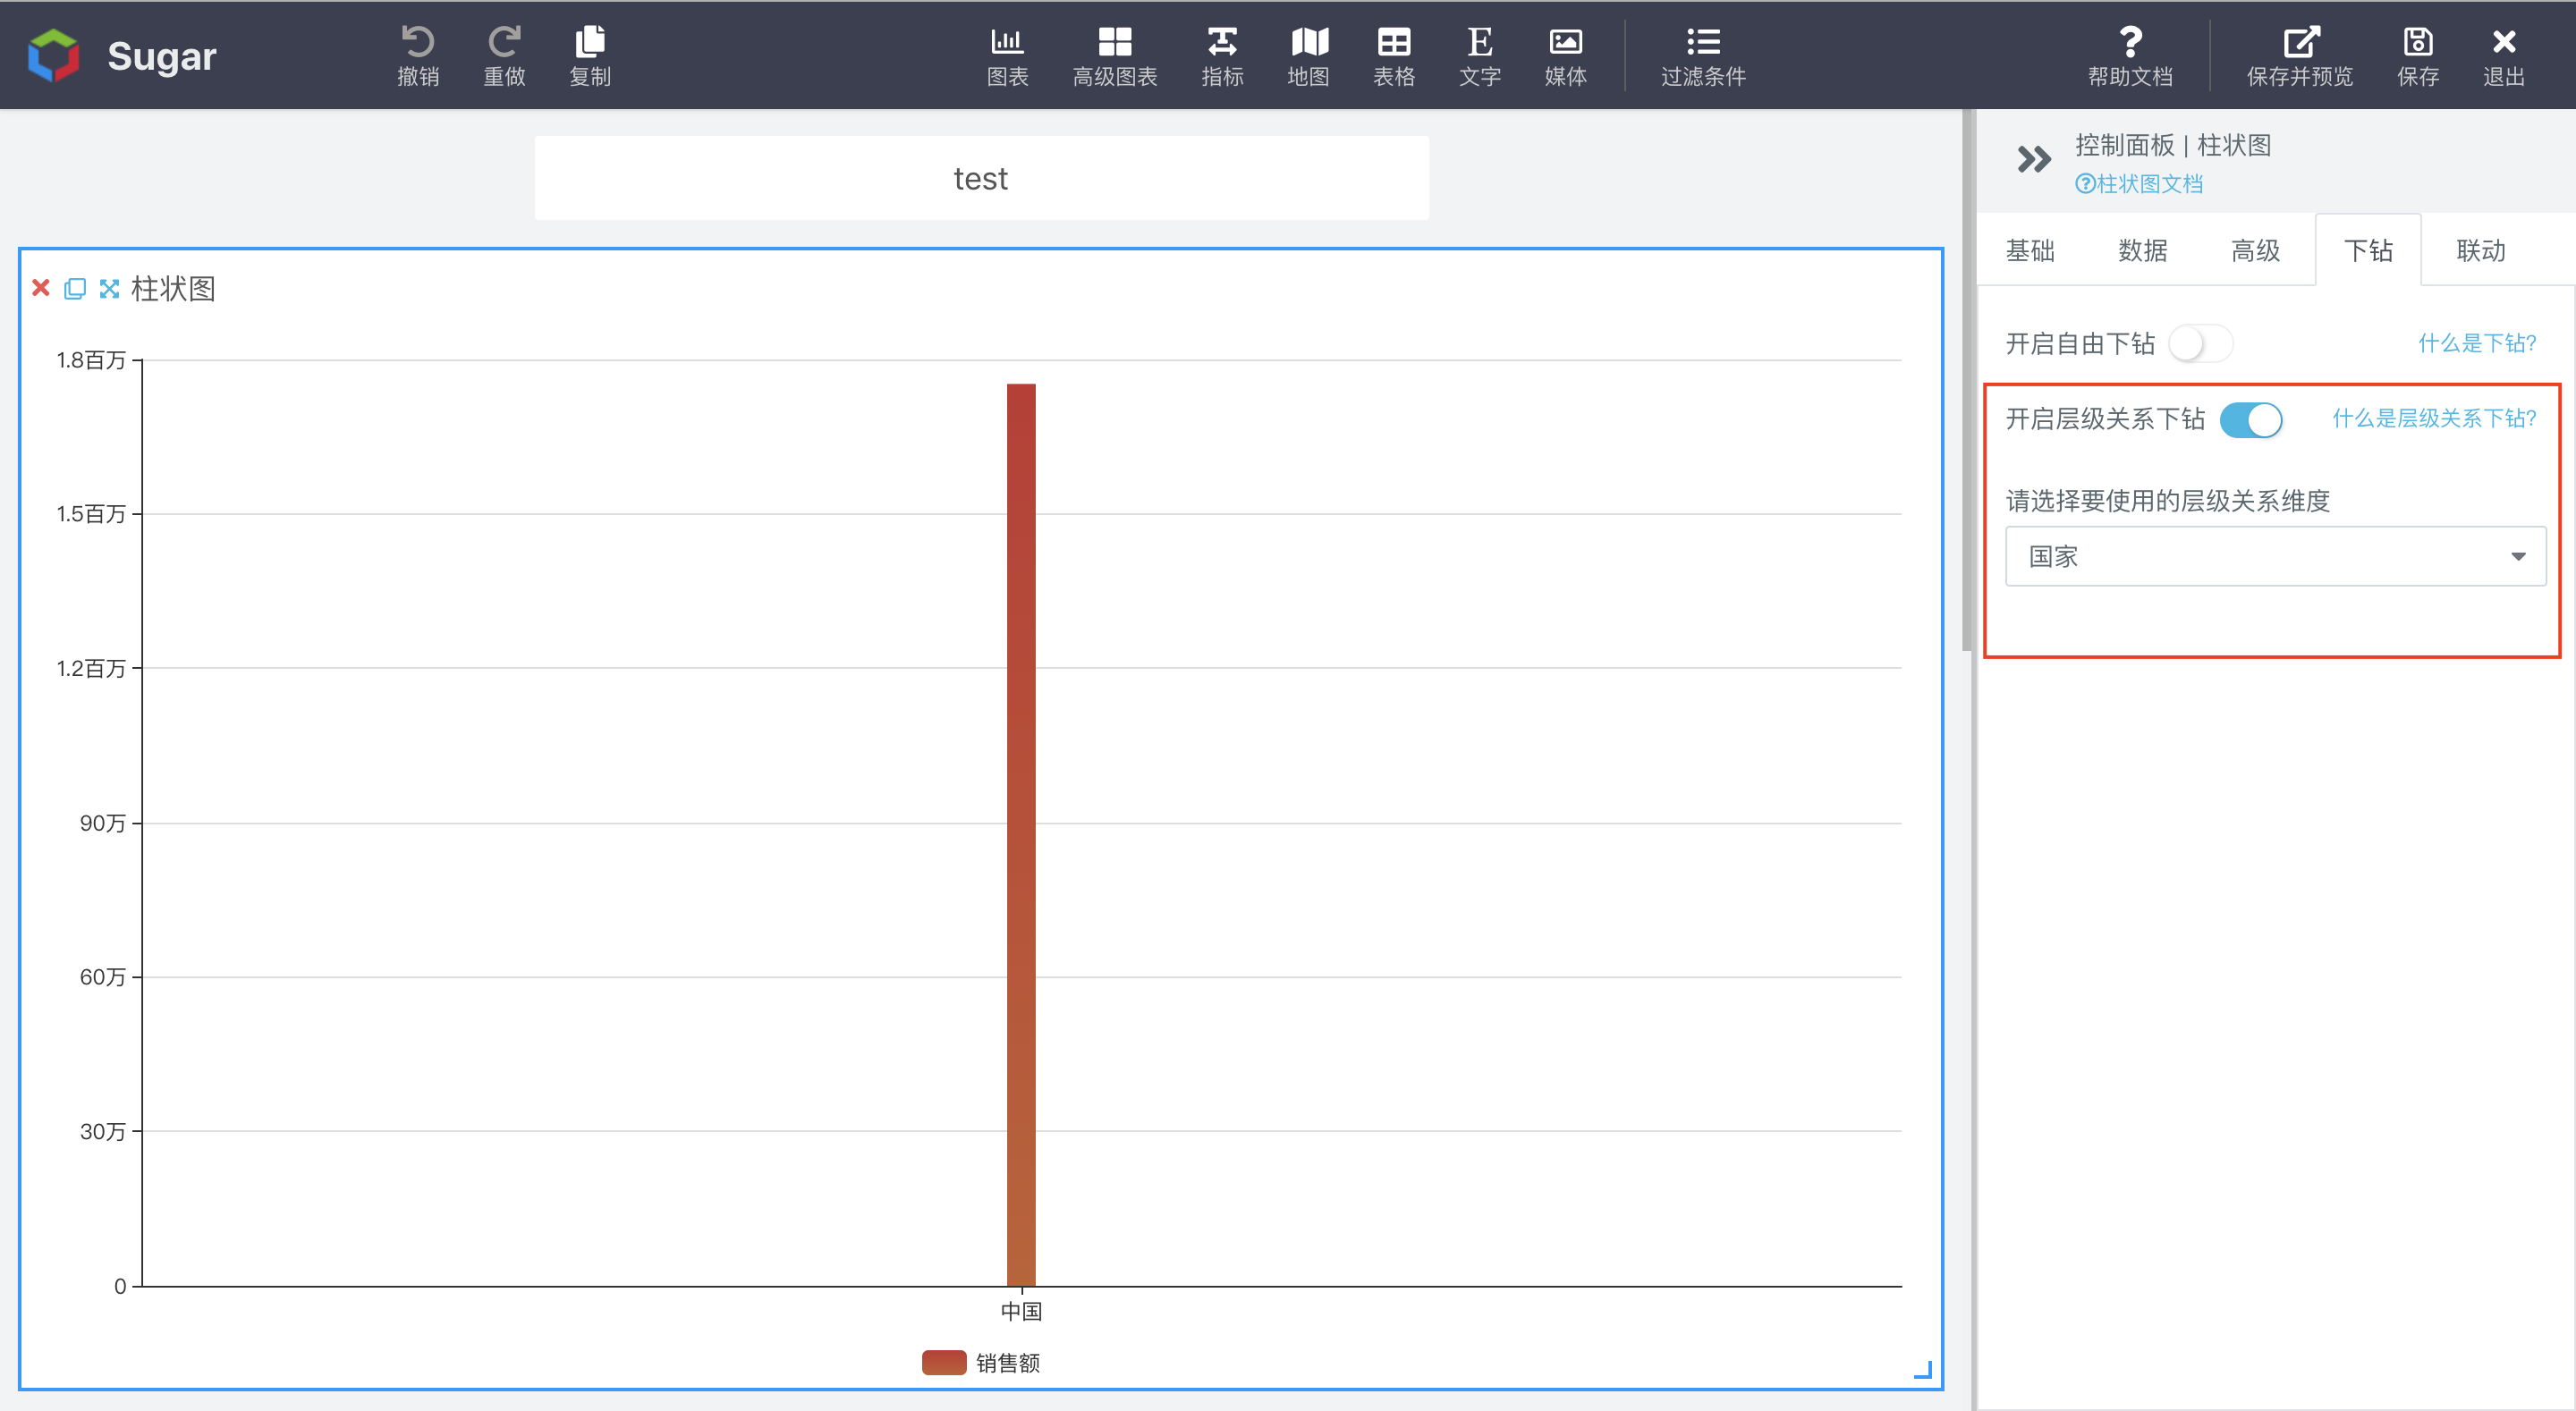
The [Drill Down] panel configuration is shown in the figure below. Select the hierarchical dimension [Country] used on the X-axis.
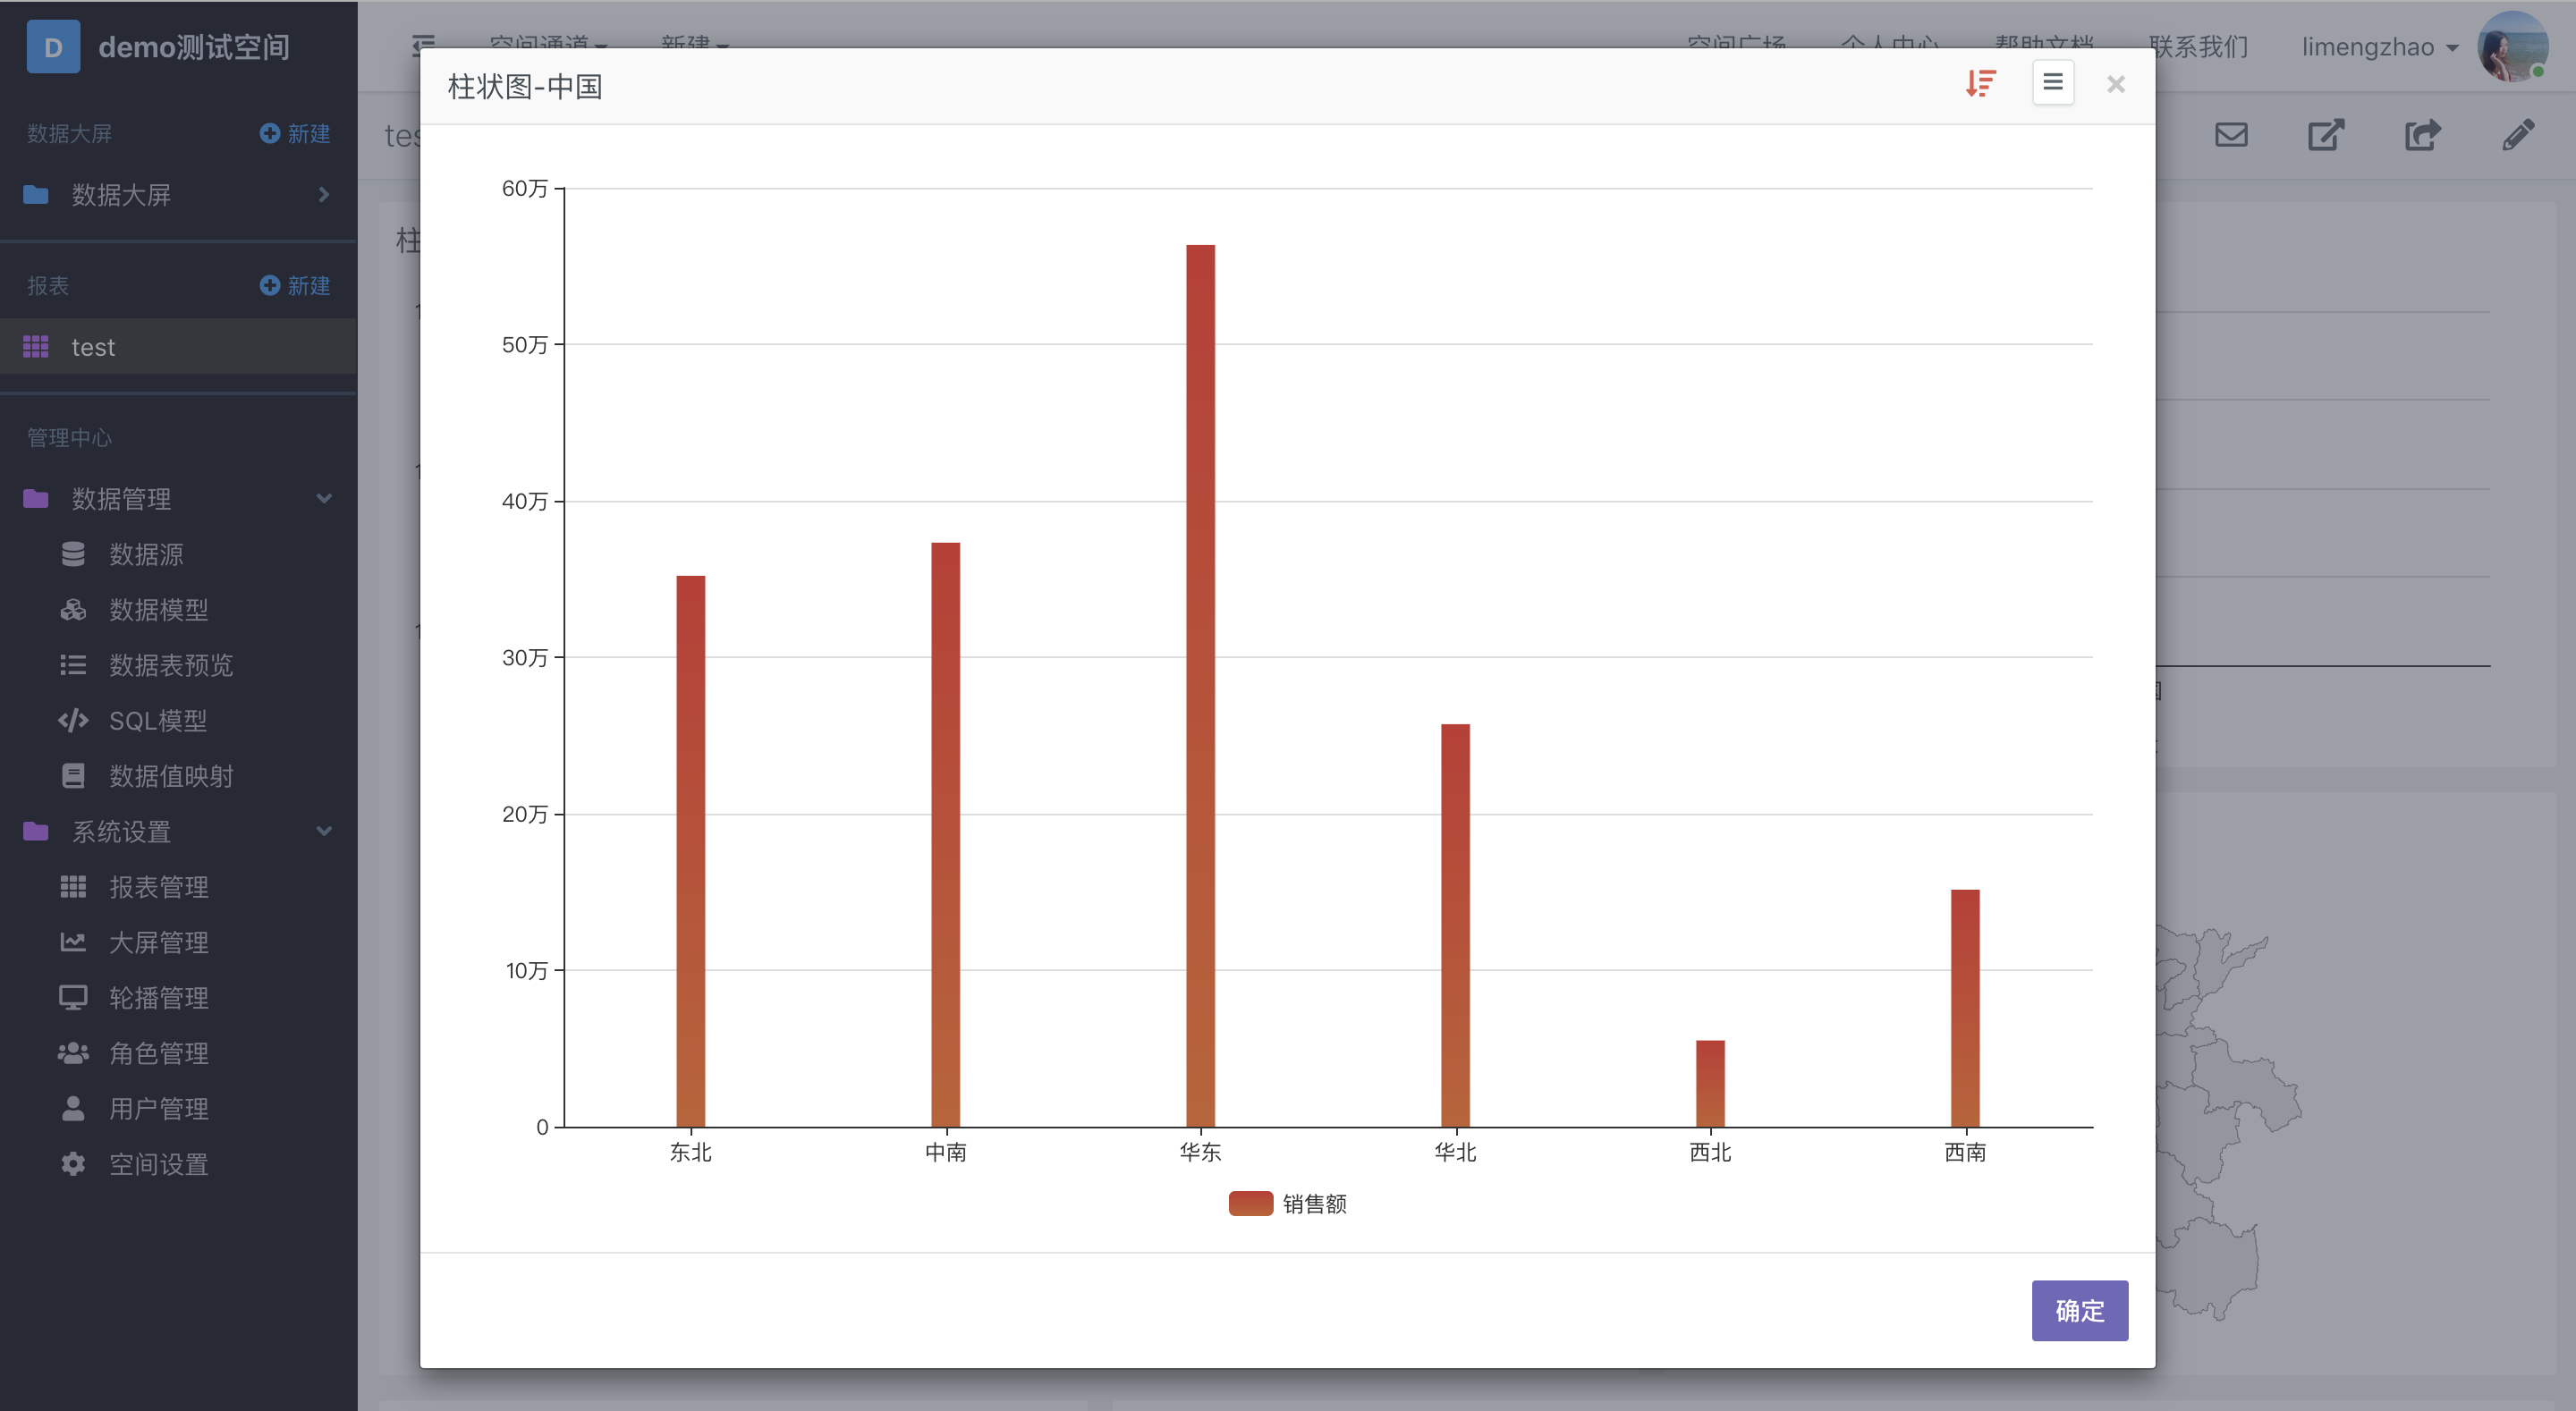
After the configuration is completed, the drill down configuration of the region and city levels under the country will be automatically generated in the geographic region hierarchy. Click on the column "China", the drill-down chart [Column Chart – China] for the regions under China will pop up. The effect is shown in the figure below:
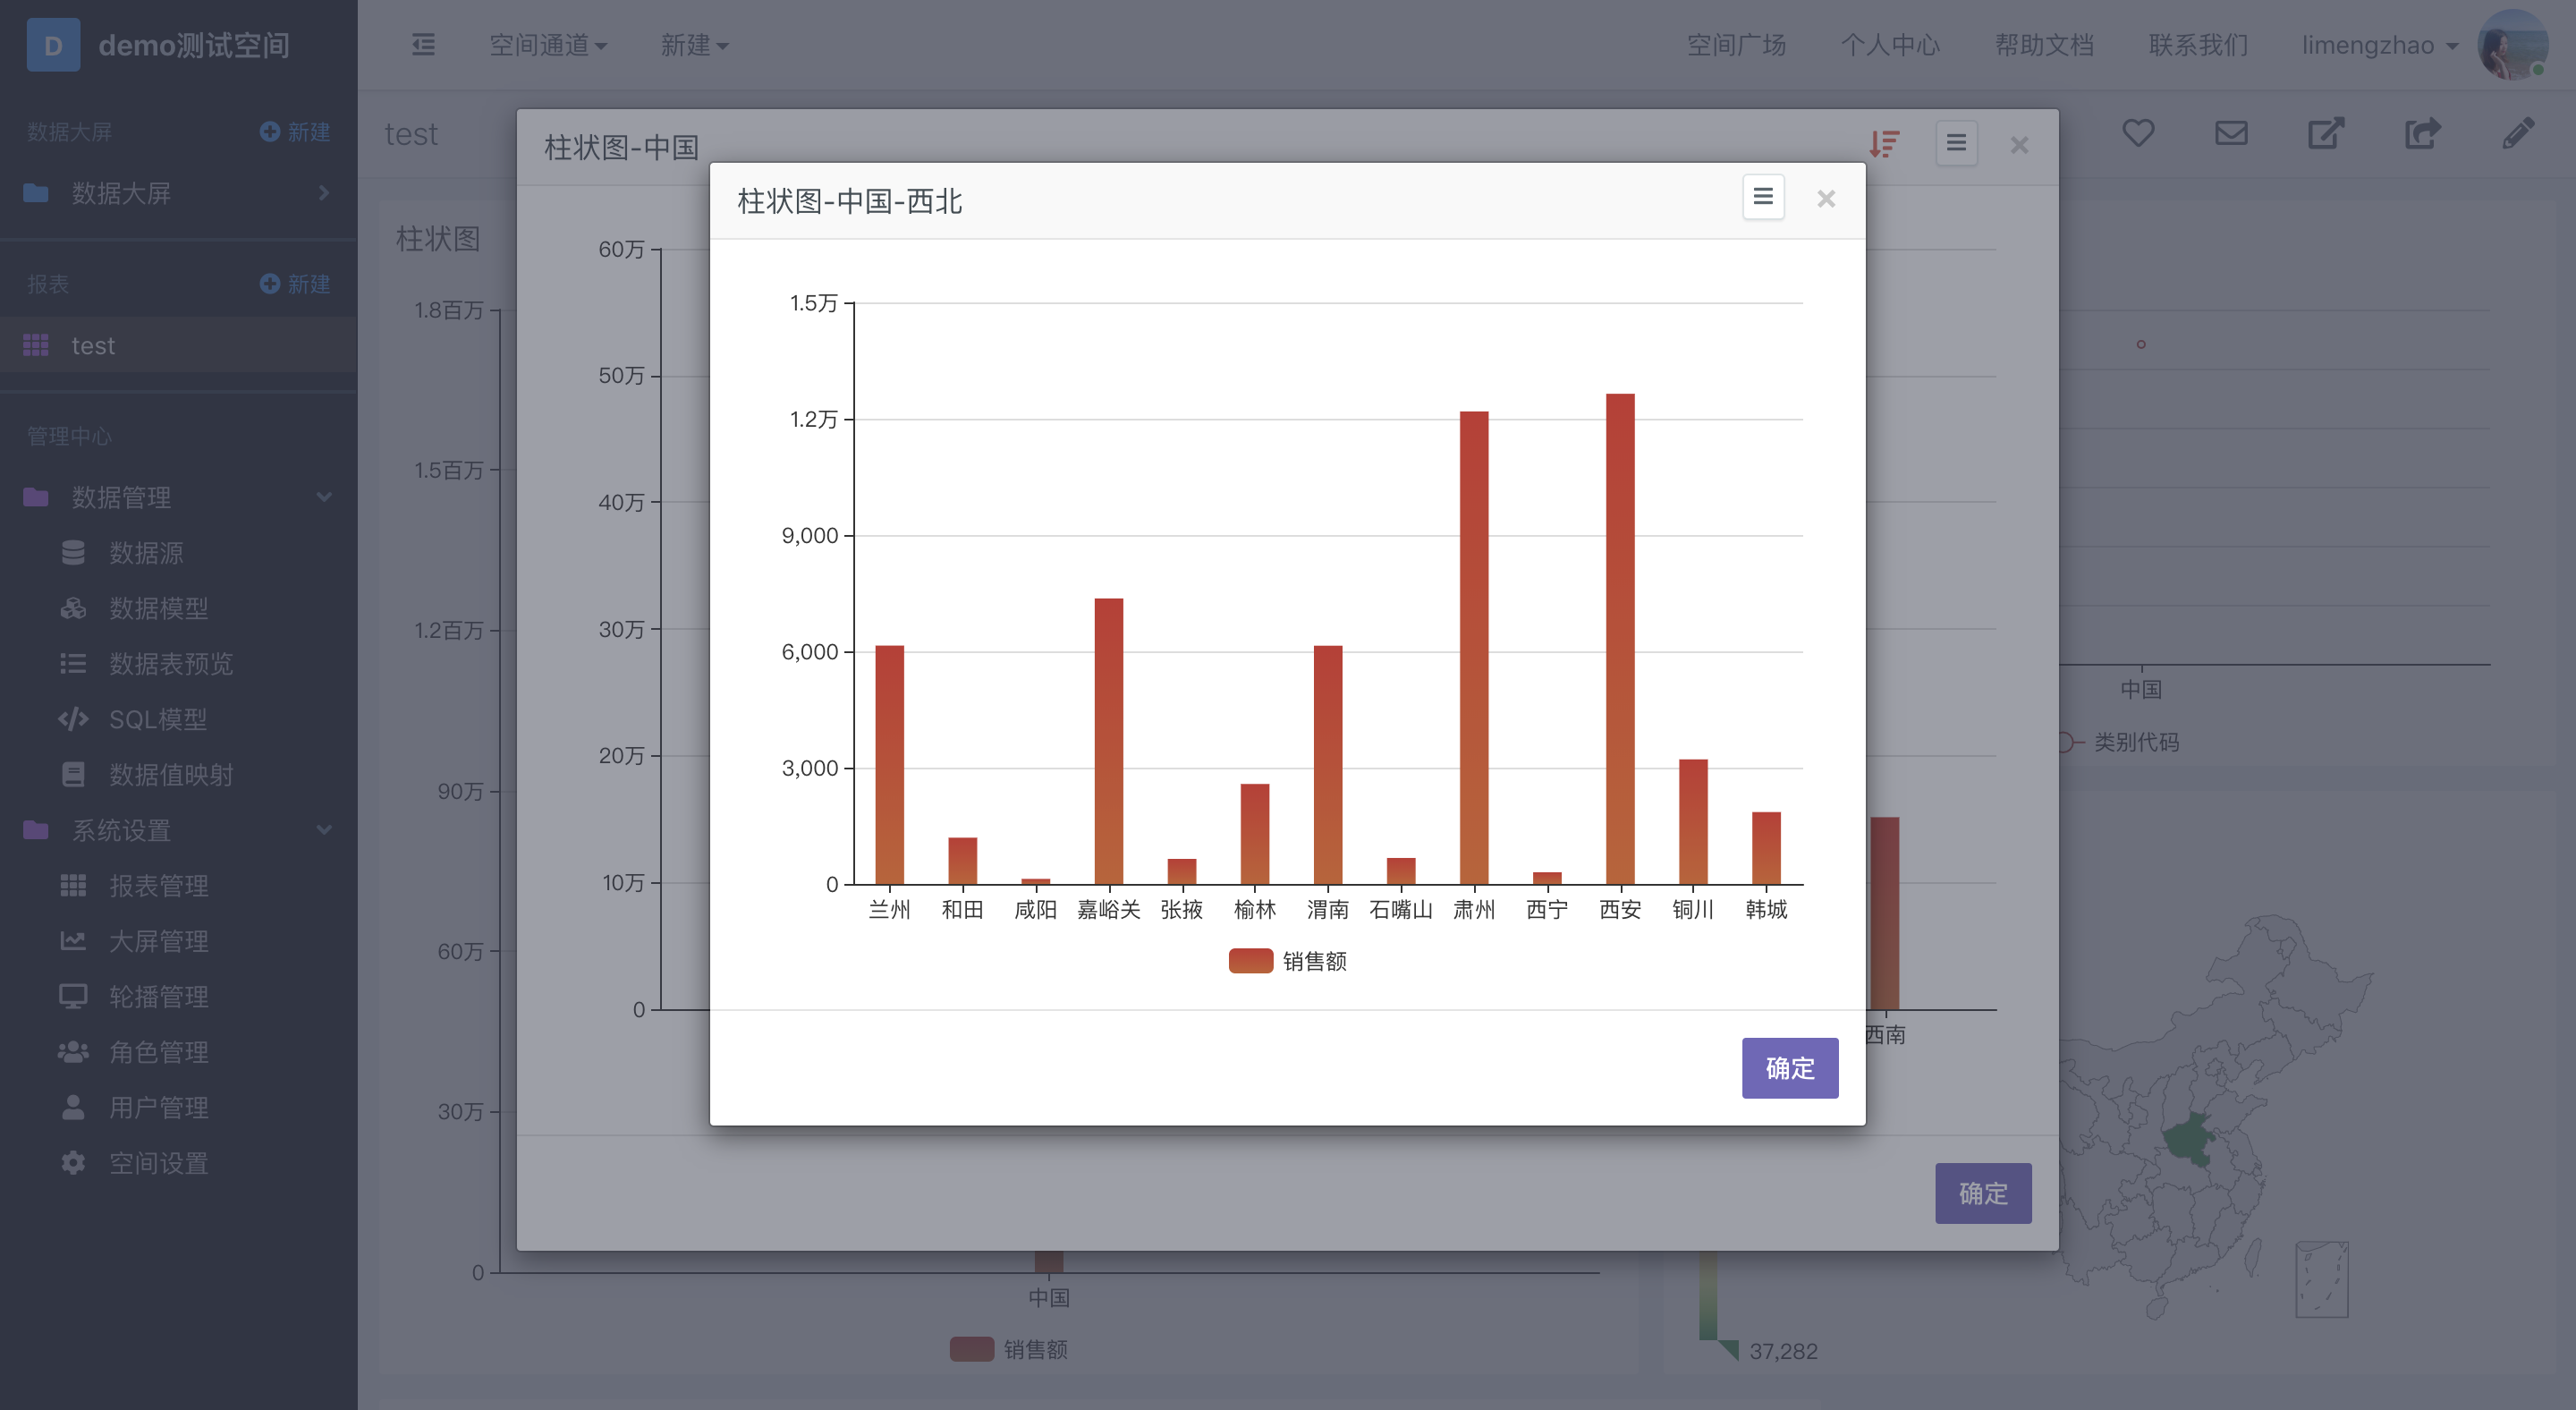
Click the column "Northwest", the drill-down chart [Column Chart - China – Northwest] of the city level under Northwest will pop up, as shown in the figure below:
The drill-down chart of hierarchical drill down also supports the configuration of its own styles:
Tabular charts
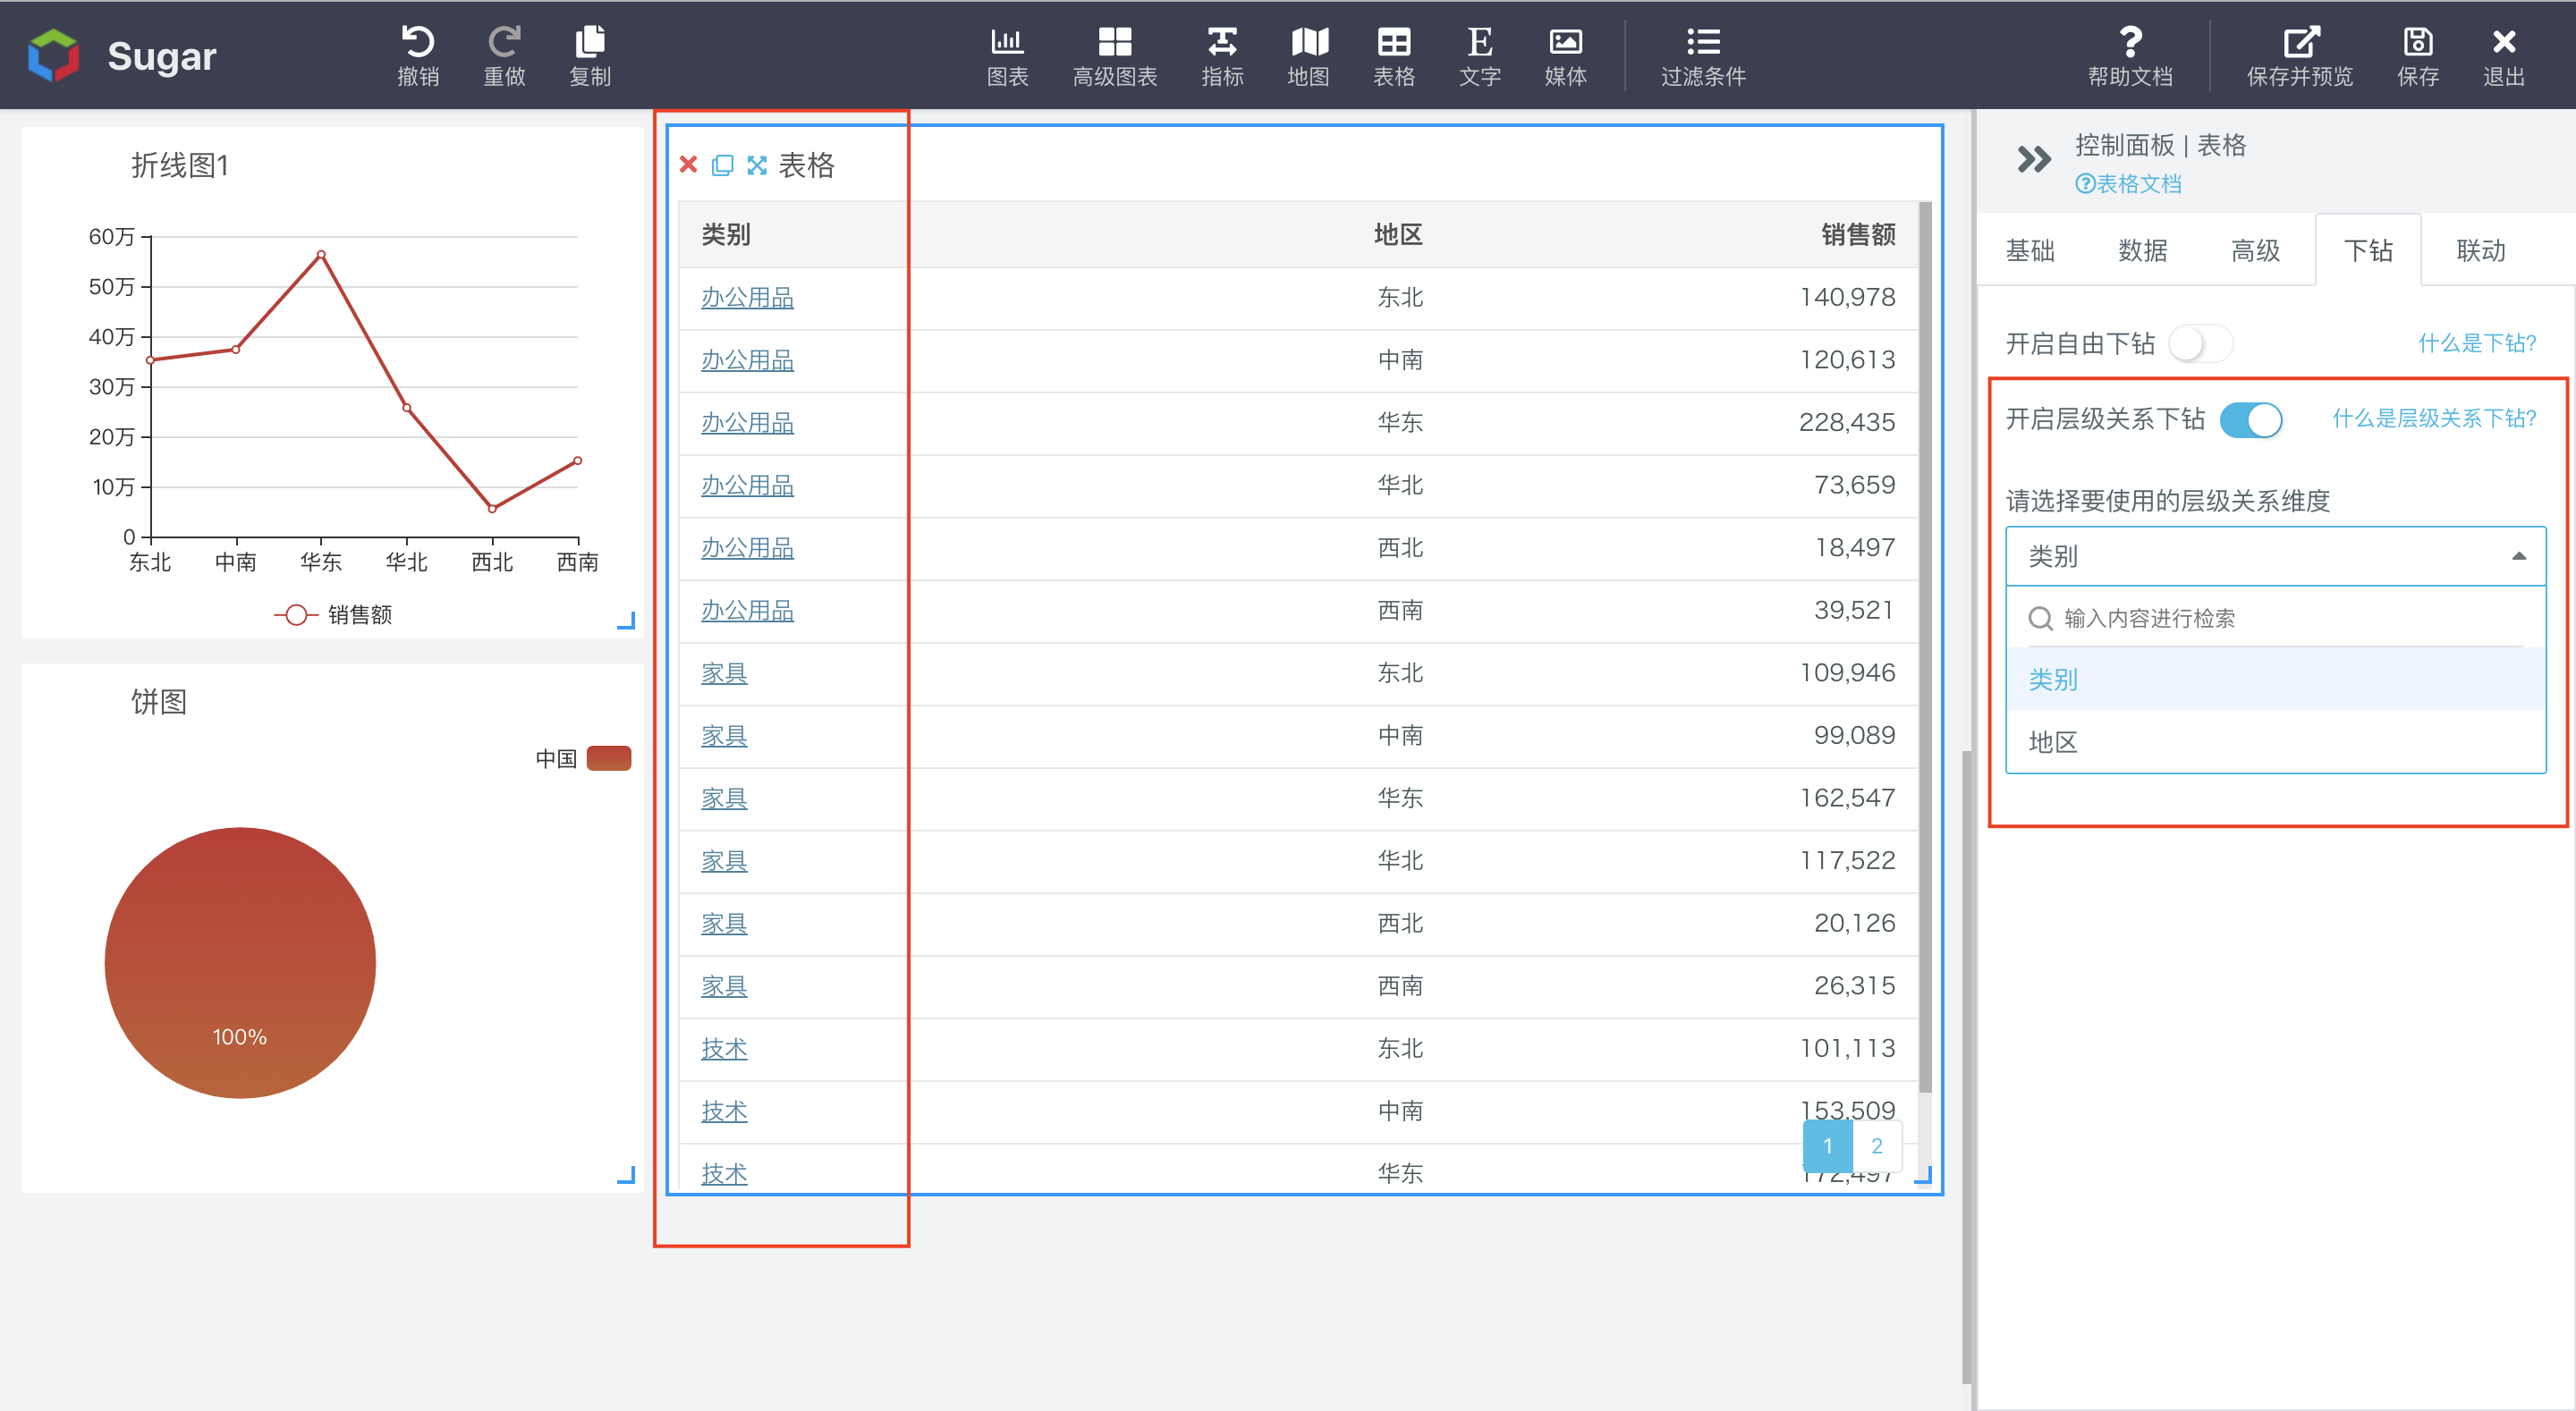
The difference between tabular charts and other charts lies in the fact that multiple columns with hierarchical dimensions can be configured in tabular charts, as shown in the figure below:
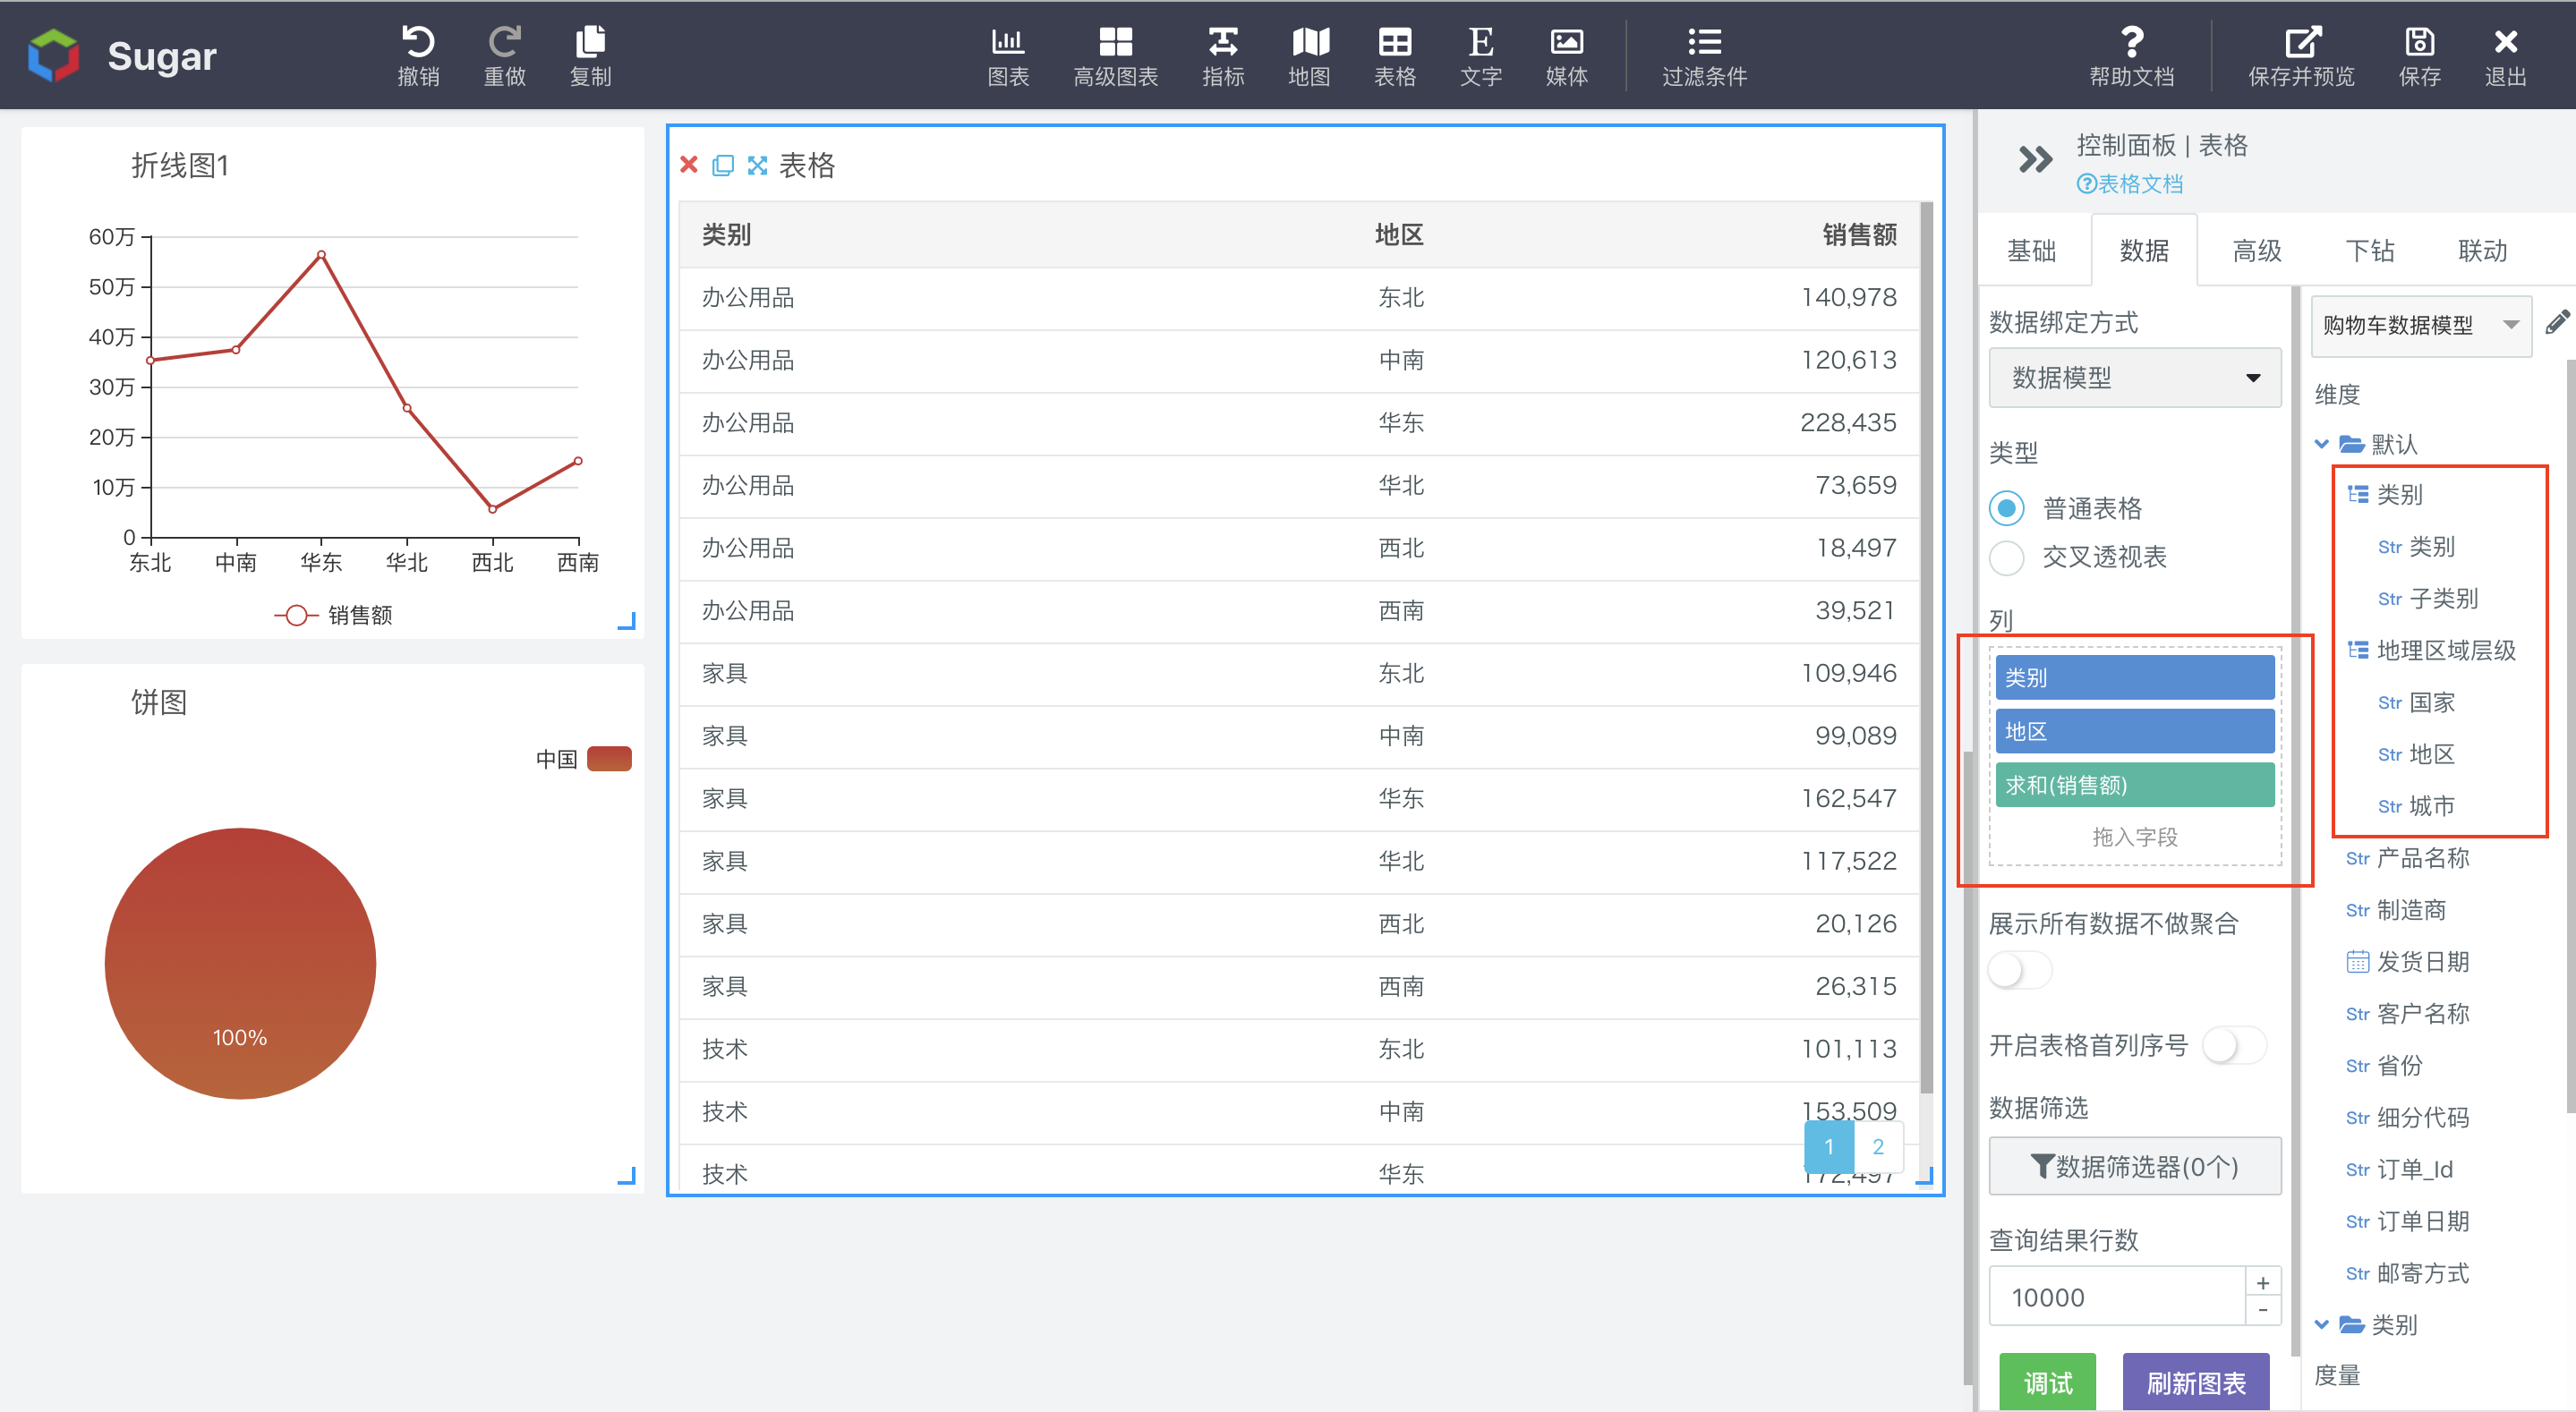
In addition, after category and region dimension columns are configured, you need to, from the configuration summary of hierarchical drill down, select which column you want to drill down. The selected column will show the corresponding drill-down style:
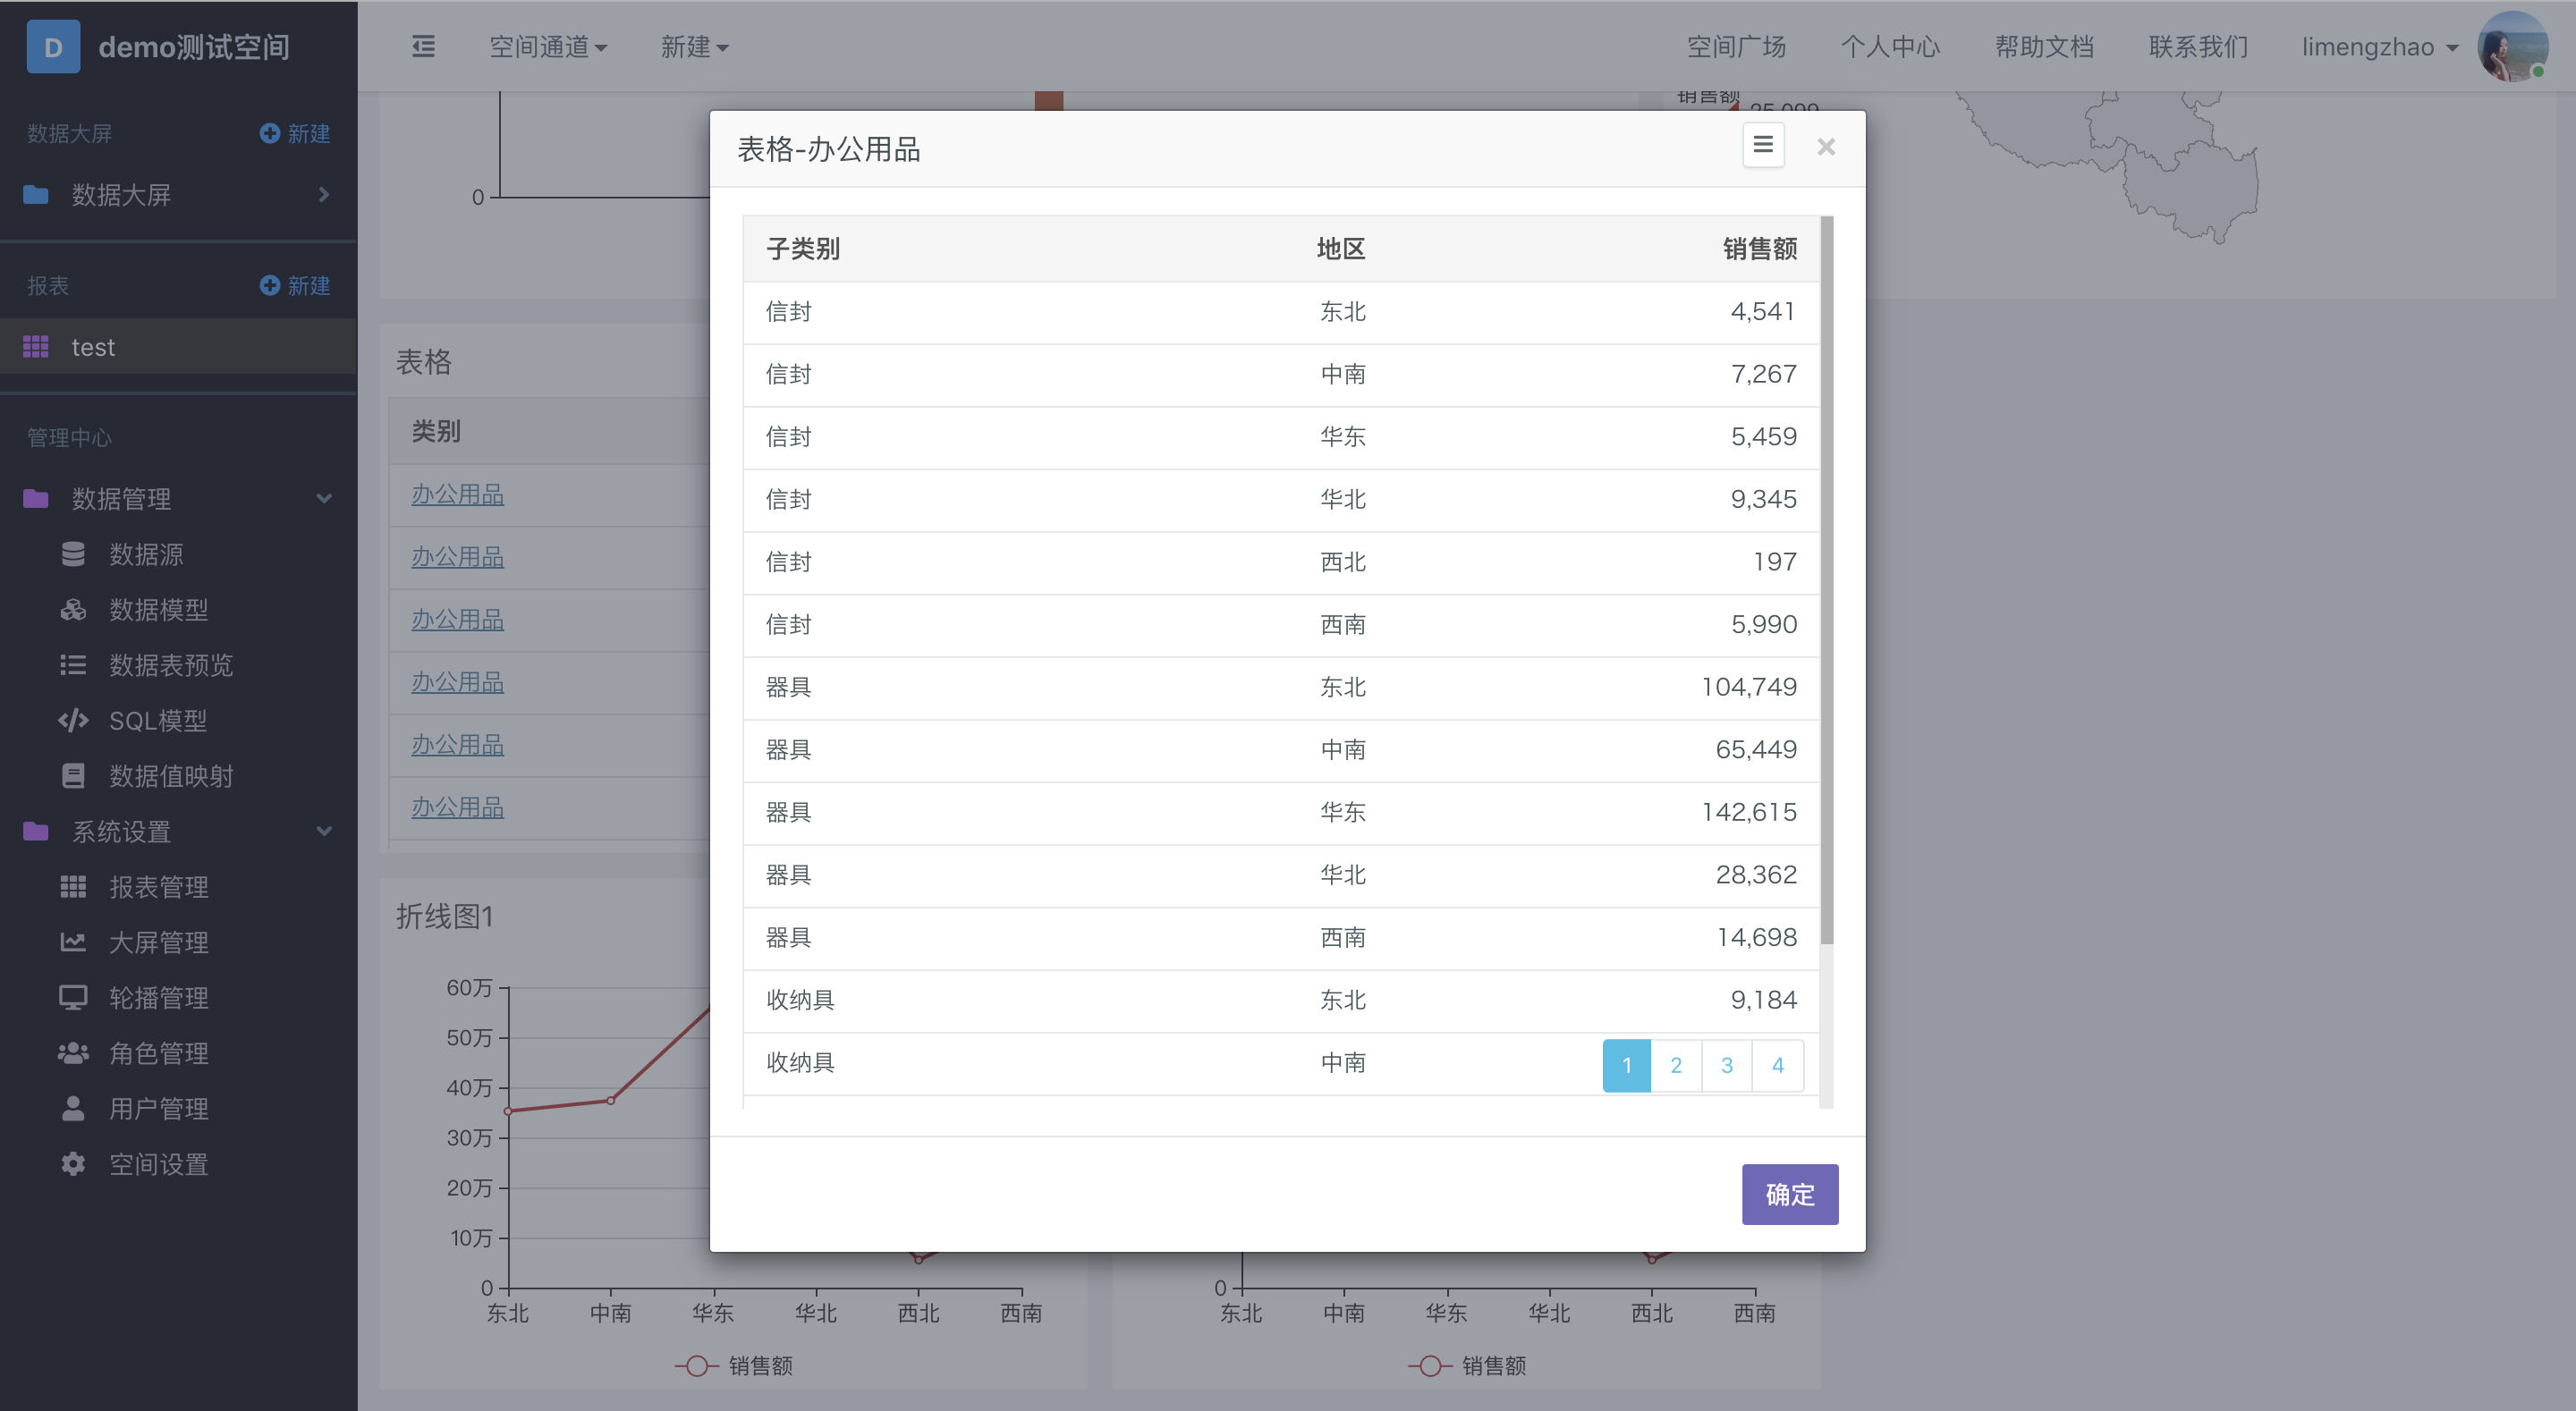
After configuration, click the Category column. An information list of all subcategories under this category column will pop up. The effect is shown in the figure below:
Free Drill-Down
In general, the charts that can be drill down in can be divided into two categories:
- Single type of trip: this type of chart can only trigger one type of drill down. For example, if you click the pie chart and each area to drill down, a histogram will pop up, and the data in the histogram will be different according to the difference of the clicking area. When drill down is triggered, the [drill down parameters](the parameters drill down) of the pie chart transferred to the tripping histogram will be automatically different according to the different clicking positions. The drill downconfiguration of this kind of chart only needs to select the triggered drill down chart type:
-
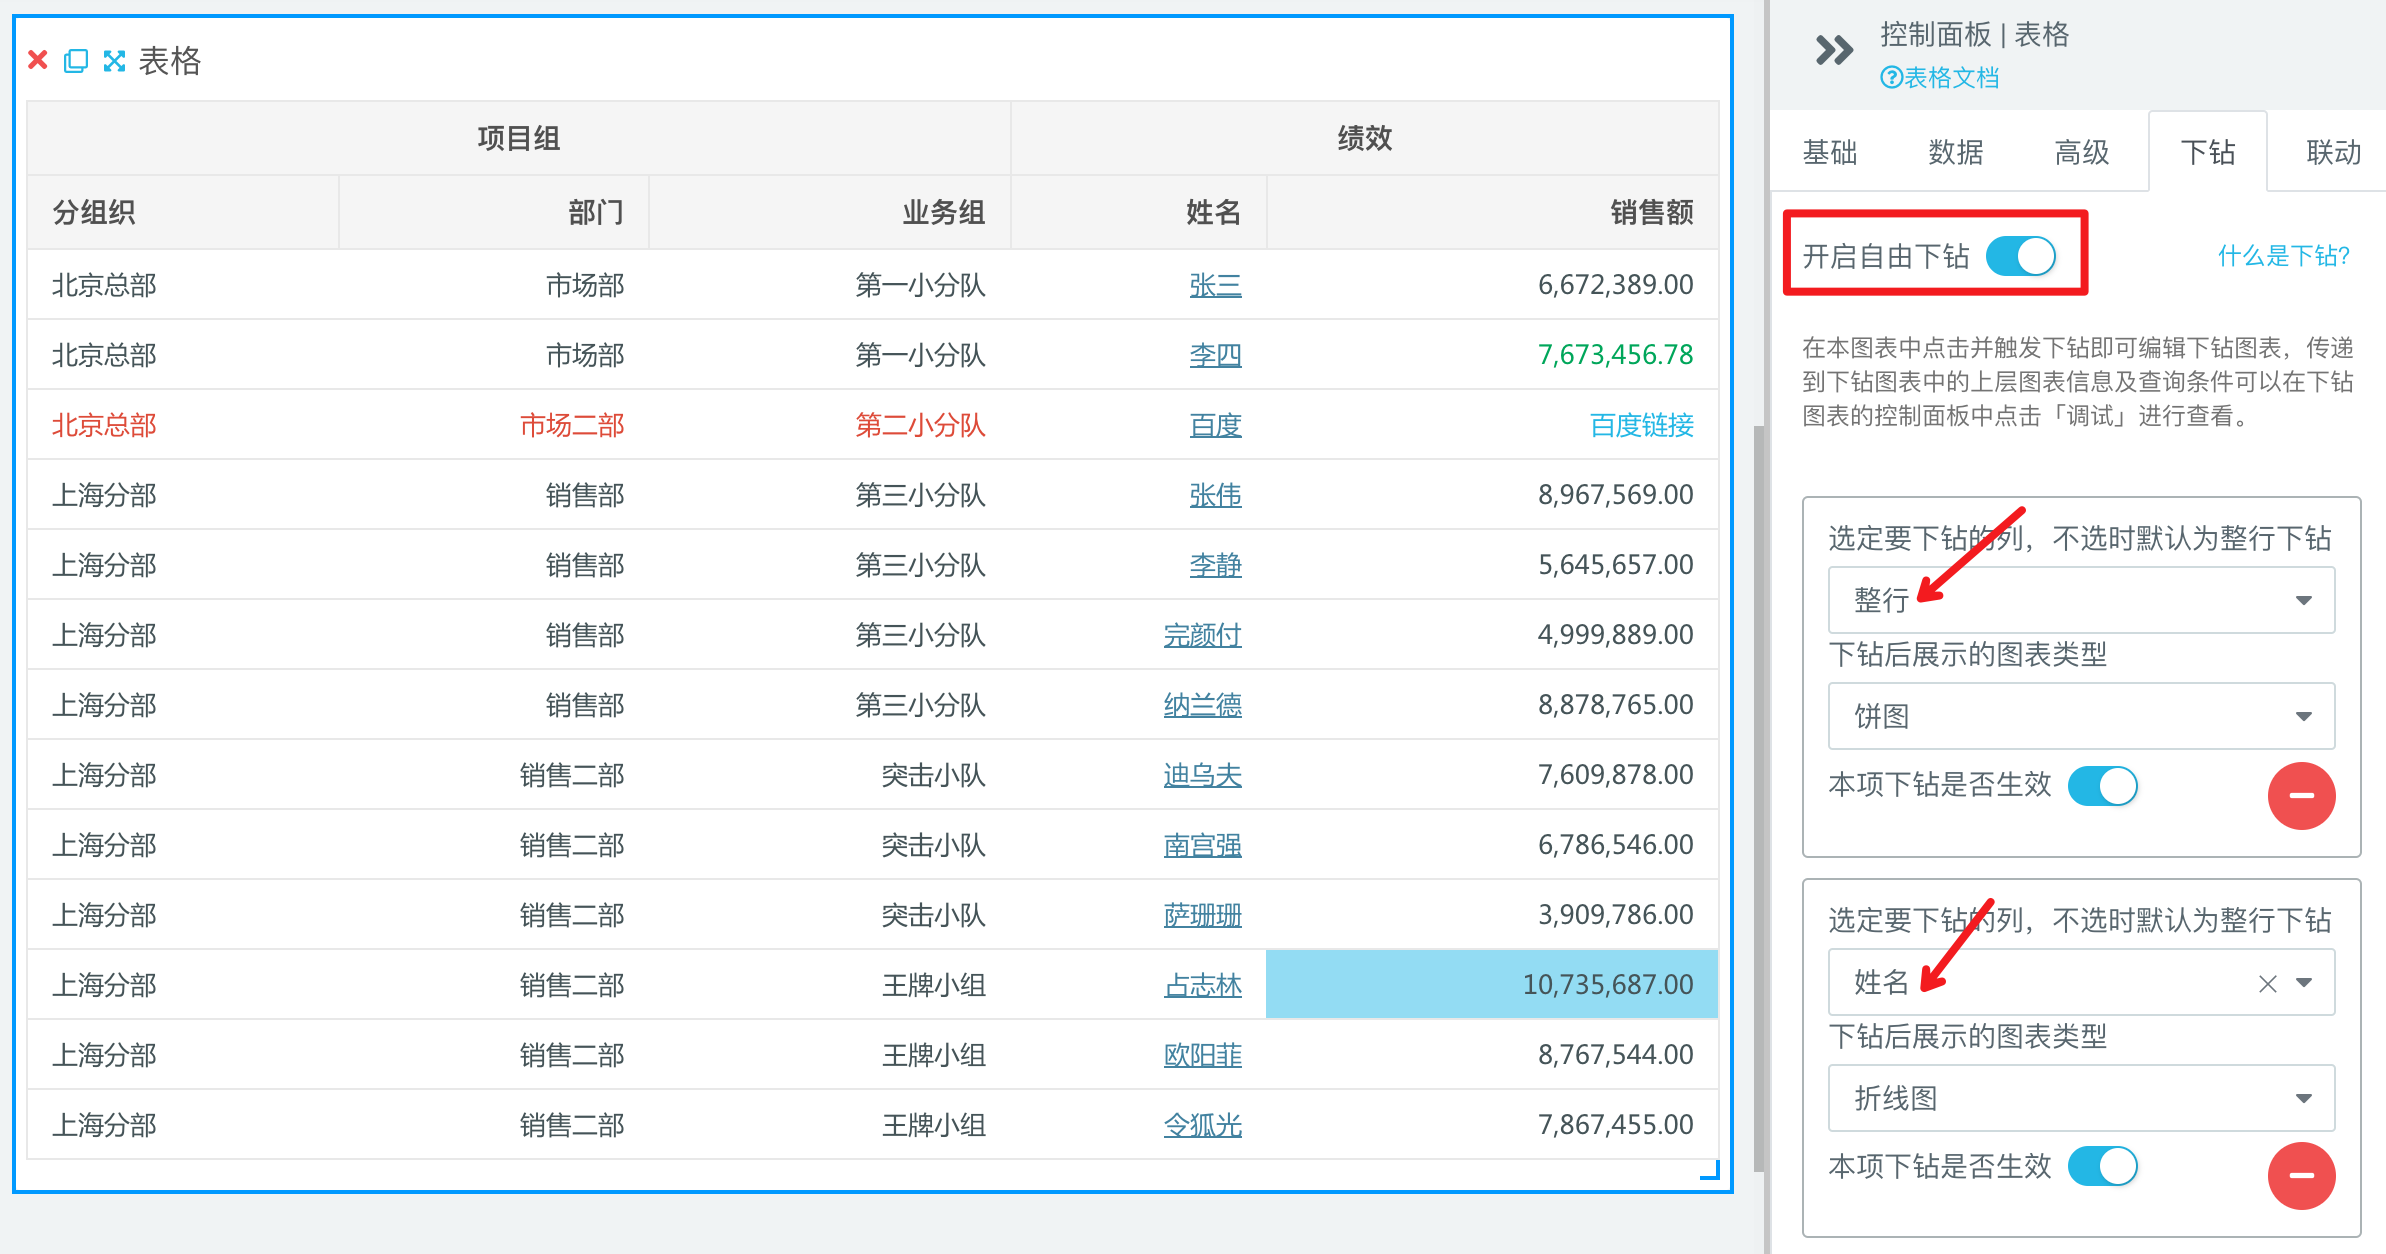
Multiple drill down: this type of chart can trigger multiple drill down operations. For example, for a table, you can set to click each row to trigger the drill down, and click a column in a row to trigger the drill down. In this way, two drill downs are set for the table. When the user clicks on different areas of the table, different drill down behaviors are triggered.
Whether it's a single type of drill down or multiple types of drill down (just triggering multiple drill down behaviors), the configuration required in the pop-up chart of their drill down is similar. The following is a detailed introduction to the configuration in the pop-up pie chart of a histogram's drill down:
Example of drill down in a histogram
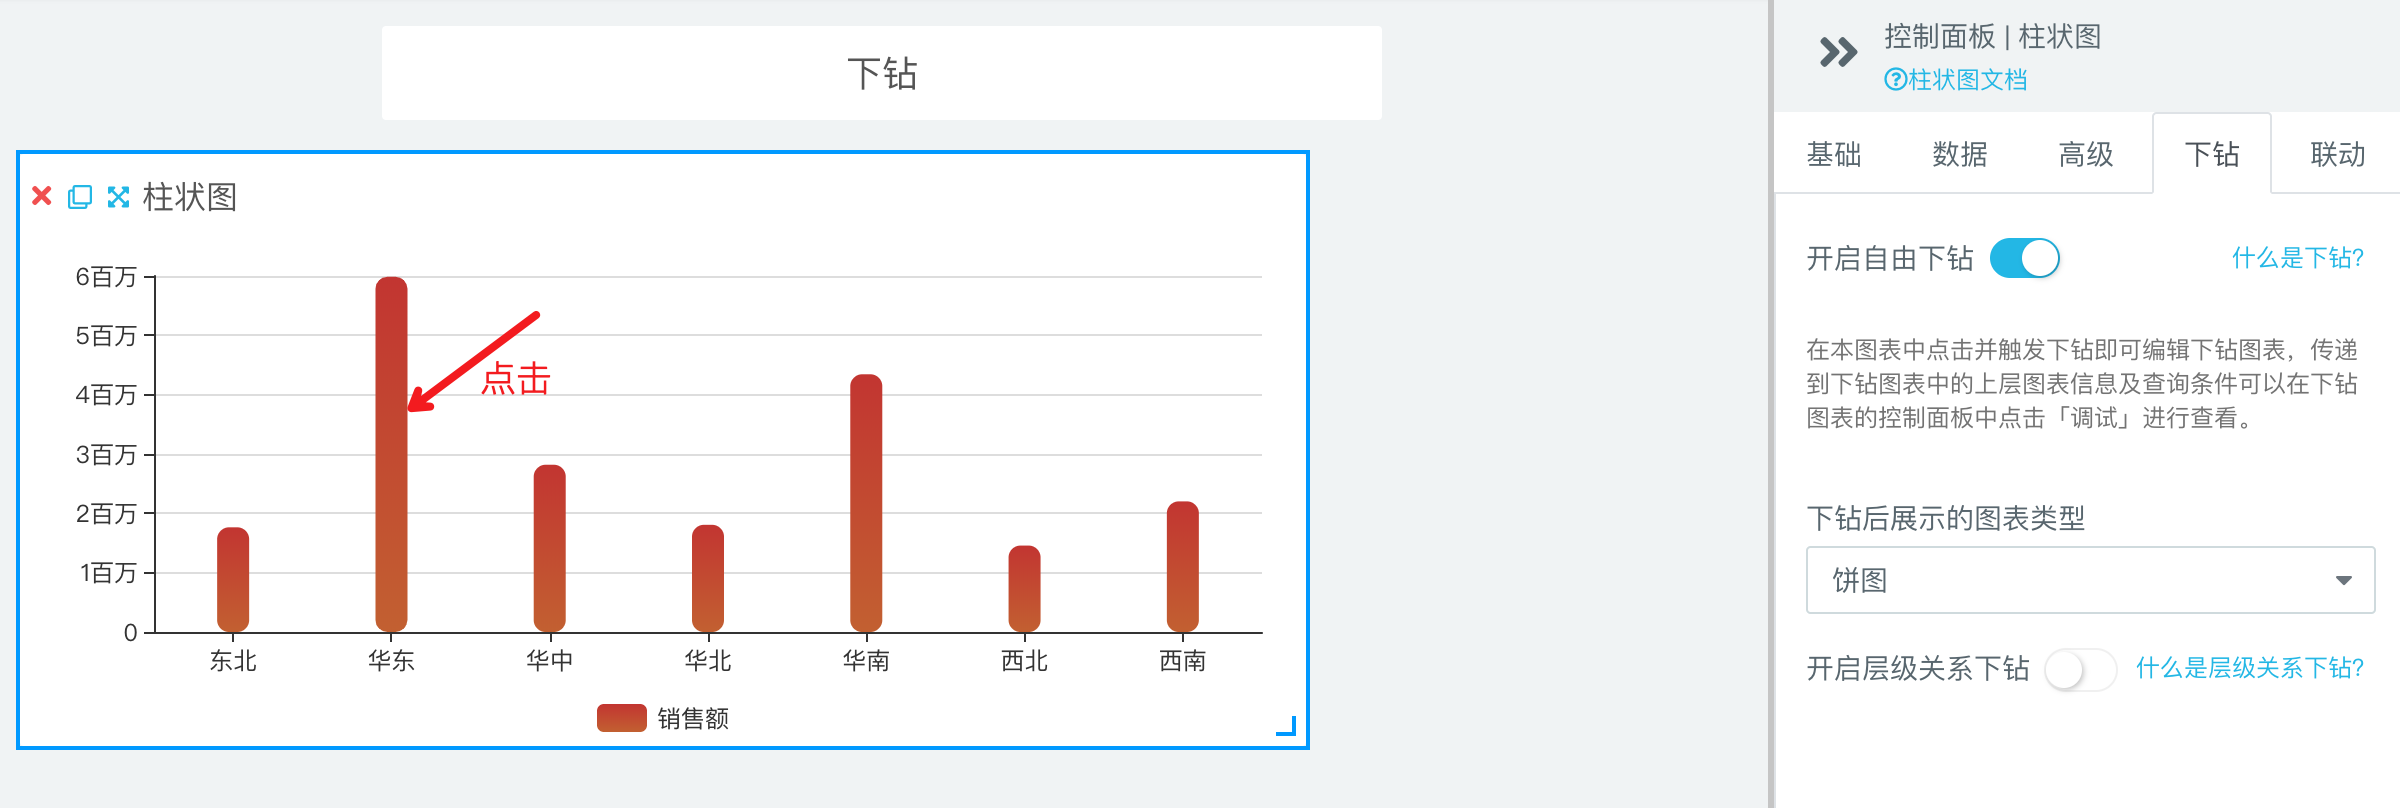
As shown in the column chart below, it shows the total sales price of each region, enables tripping, and configures drill down to show a pie chart, as shown in the figure below, click a column in the column chart (such as East China)
In the pop-up pie chart, the same data model as the histogram is used automatically, and you can see that the "drill down in parameter association configuration" part has been set automatically (only one association setting is added by default, you can add and delete according to the actual situation):
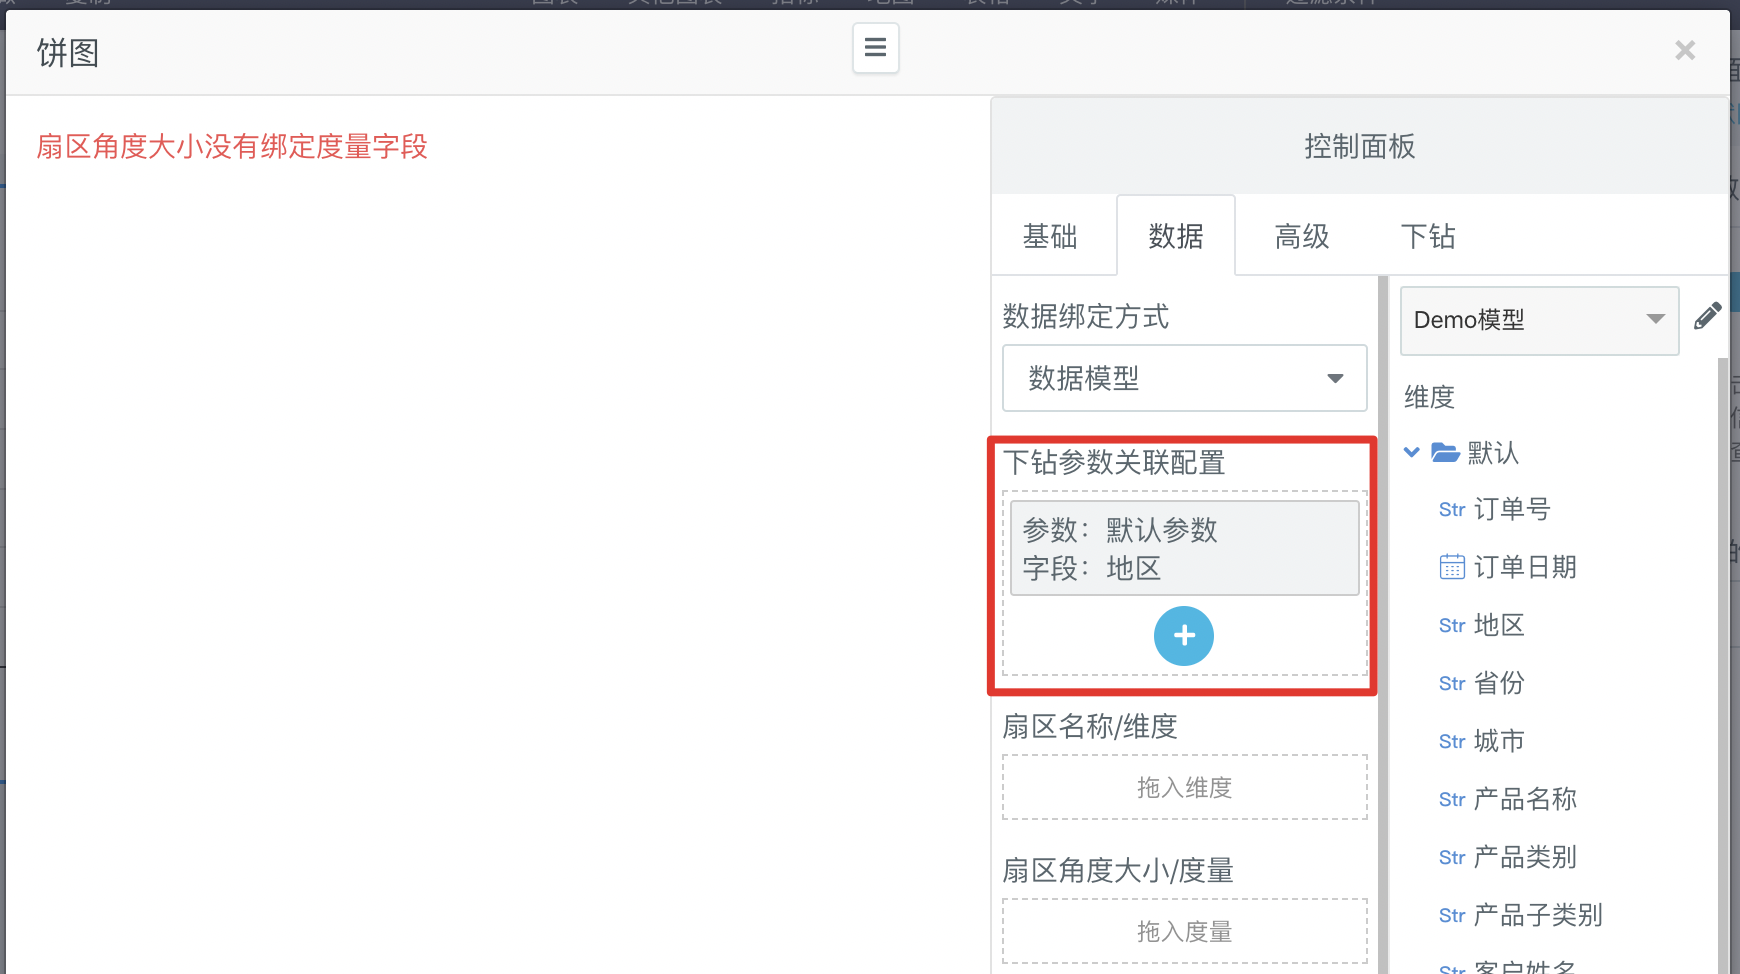
You can click the "configuration of drill down parameter association" section in the figure above to see the detailed configuration of drill down parameters:
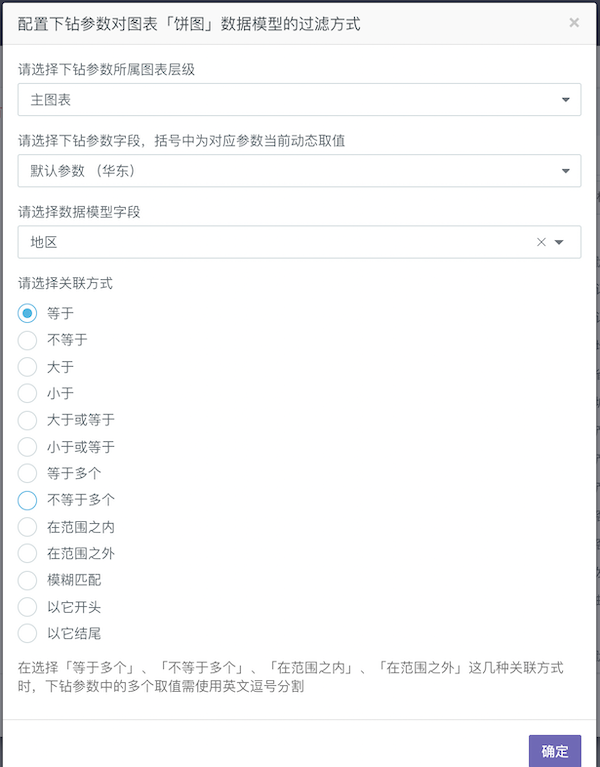
- Chart level of drill down parameters
Because Sugar supports unlimited levels of drill down, such as a fourth level drill down chart, it can bind its previous three-level drill down parameters. The default is the upper level chart of this chart
- Drill down parameter fields
List all available drill down of the selected chart. You can select one or select one by default. You can modify it according to the situation
- Data model fields
Select which field is used in the data model of this drill down chart to associate with the above selected drill down parameters. It will also be selected by default. You can modify it according to the situation
- Association method
Data model fields are associated with drilling down parameters in the following ways: equal to, greater than, fuzzy matching, etc
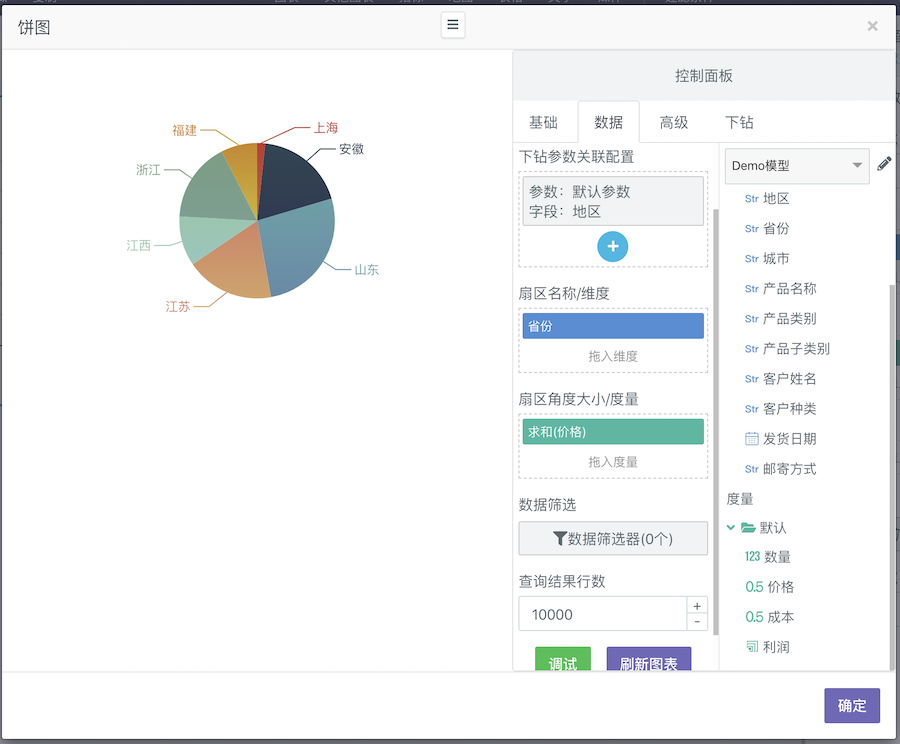
Finally, bind the "province" dimension and "price" measure to the pie chart, and refresh the chart, you can see that the pie chart shows the proportion of "price" summary of each province in "East China" region:
To verify the correctness of the data, you can click the "debug" button in the pie chart control panel in the above figure, and you can see the where part of the executed SQL statement:
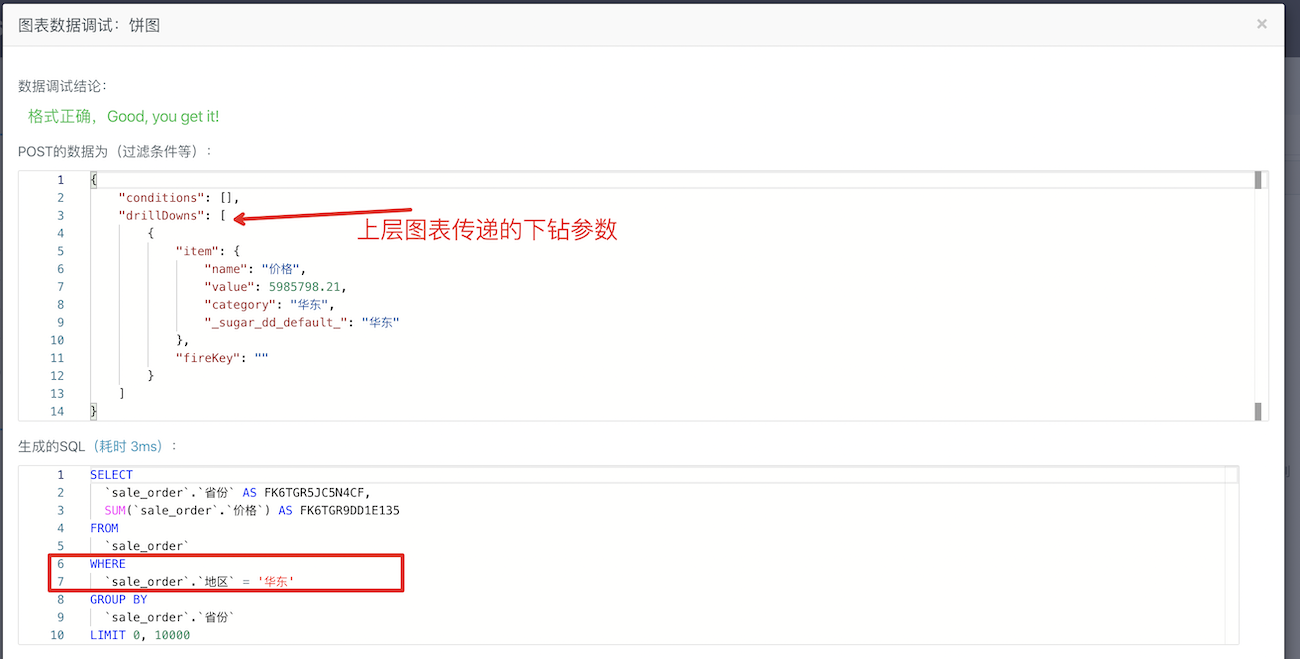
Finally, you can close the drill down in chart, click other columns of the chart, and you can see that the pie chart popped up in the drill down in will correctly display the pie chart distribution data of all provinces under the corresponding "region".
To learn more about the [Drill-Down Parameters], refer to the [Drill-Down Parameters] section later in this document.
Drill-down chart display methods
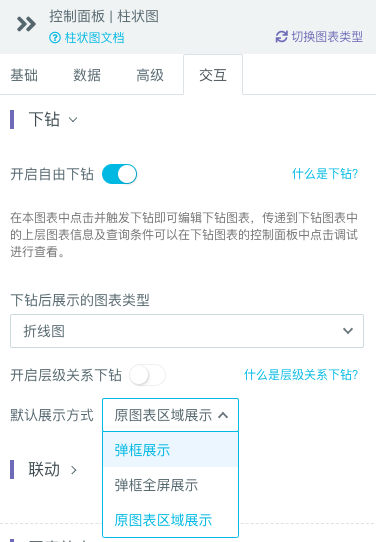
There are three drill-down chart display methods, including pop-up window display, pop-up full-screen window display, and display in the original chart area. The default display method is the pop-up window display.
You can also modify each drill-down Control panel - Basics - Display method. The free drill-down or layer-by-layer drill-down methods are available. The drill-down chart type is ineffective when you open a new page.
The display in the original chart area has the following effect.
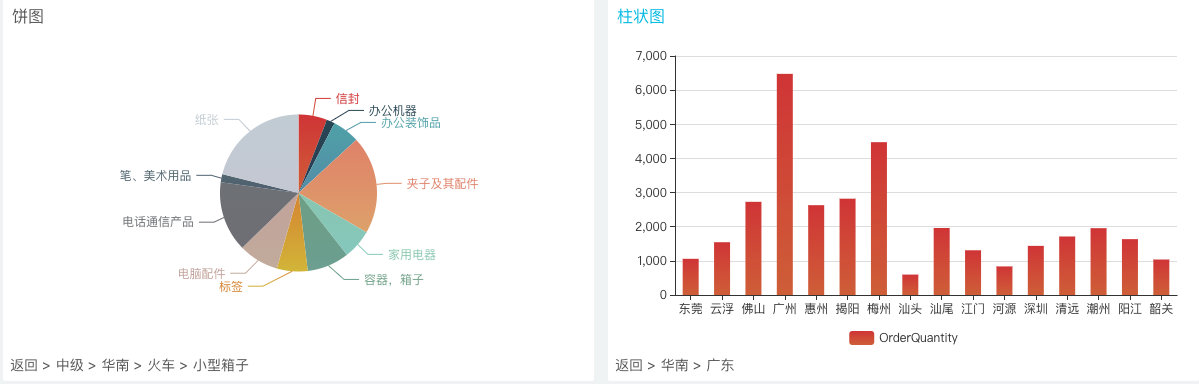
The left side is the free drill-down and the right side is the layer-by-layer drill-down. Click the name in the navigation bar at the bottom to redirect to the corresponding layer. Then, click [Return] to go back to the original chart.
It is recommended not to modify the display method in the drill-down edition after you select the [Display in the original chart area] in the default display method option. Also, it is not recommended to use two display methods in a mixed manner.
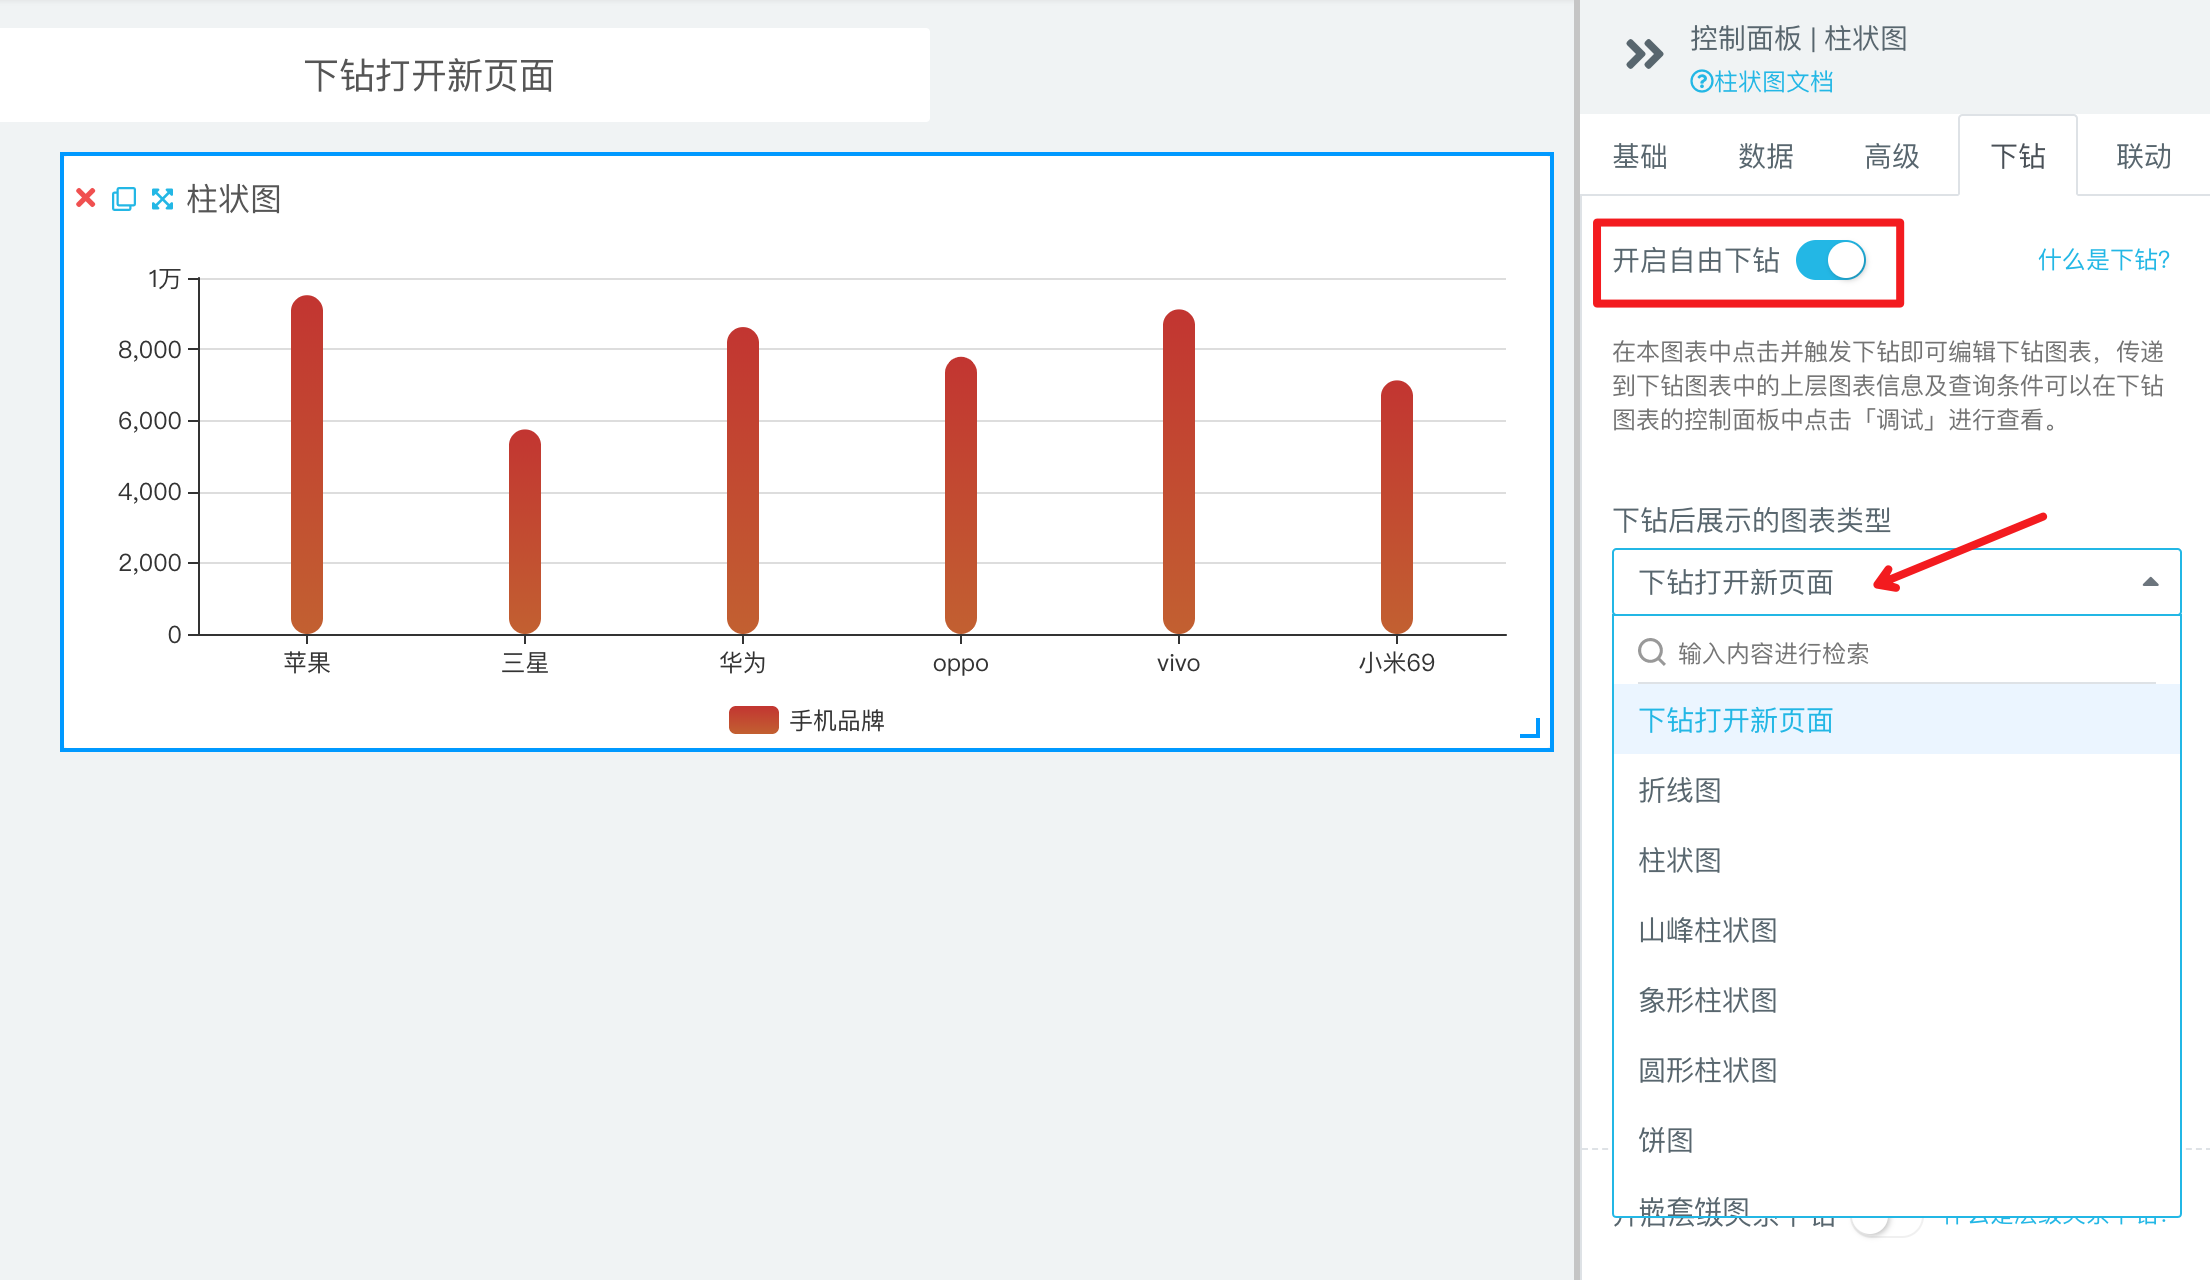
Drill down to open a new page
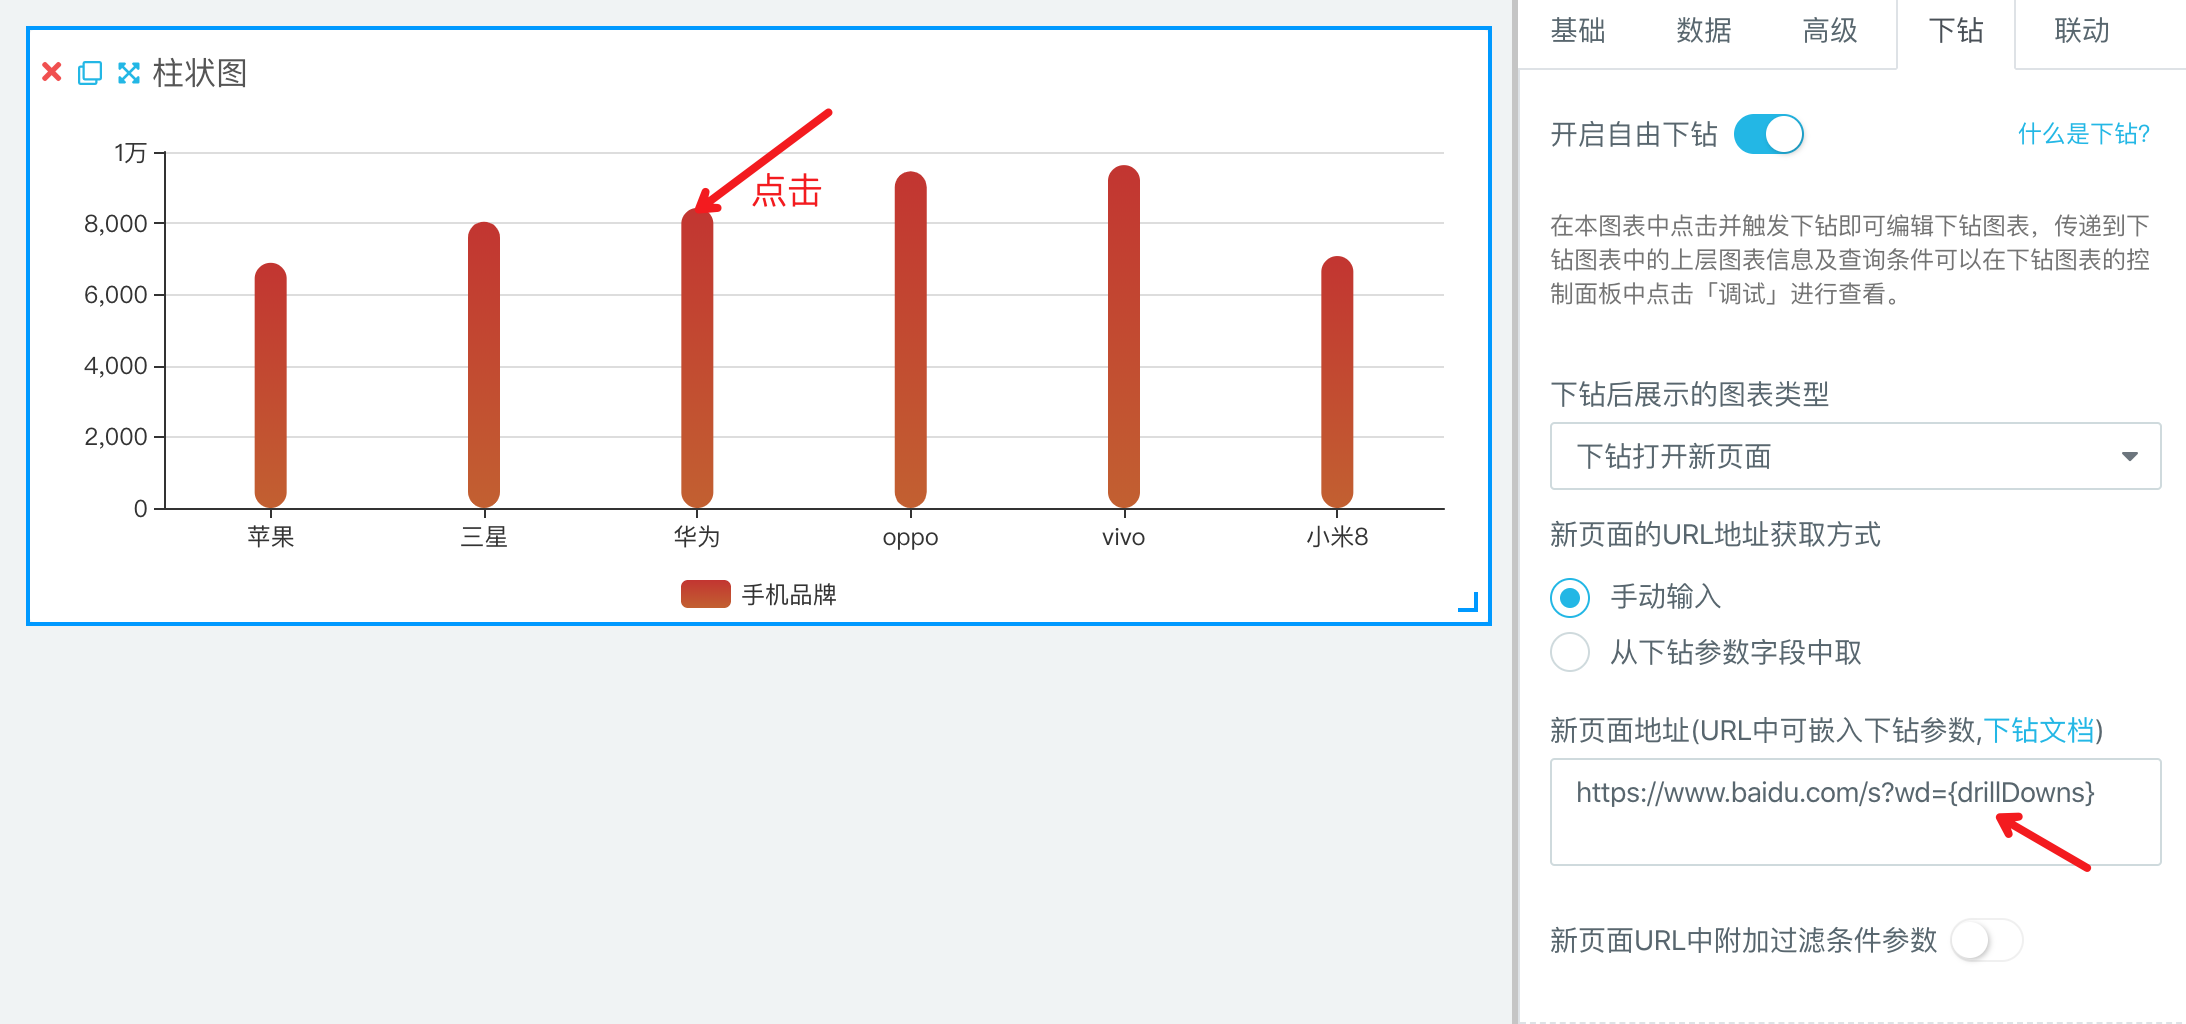
A new page can also be opened when drill down behavior is triggered in charts. For the following column chart, we need to turn free drill-down and select the chart type for drill down as [Open new page when drill down]:
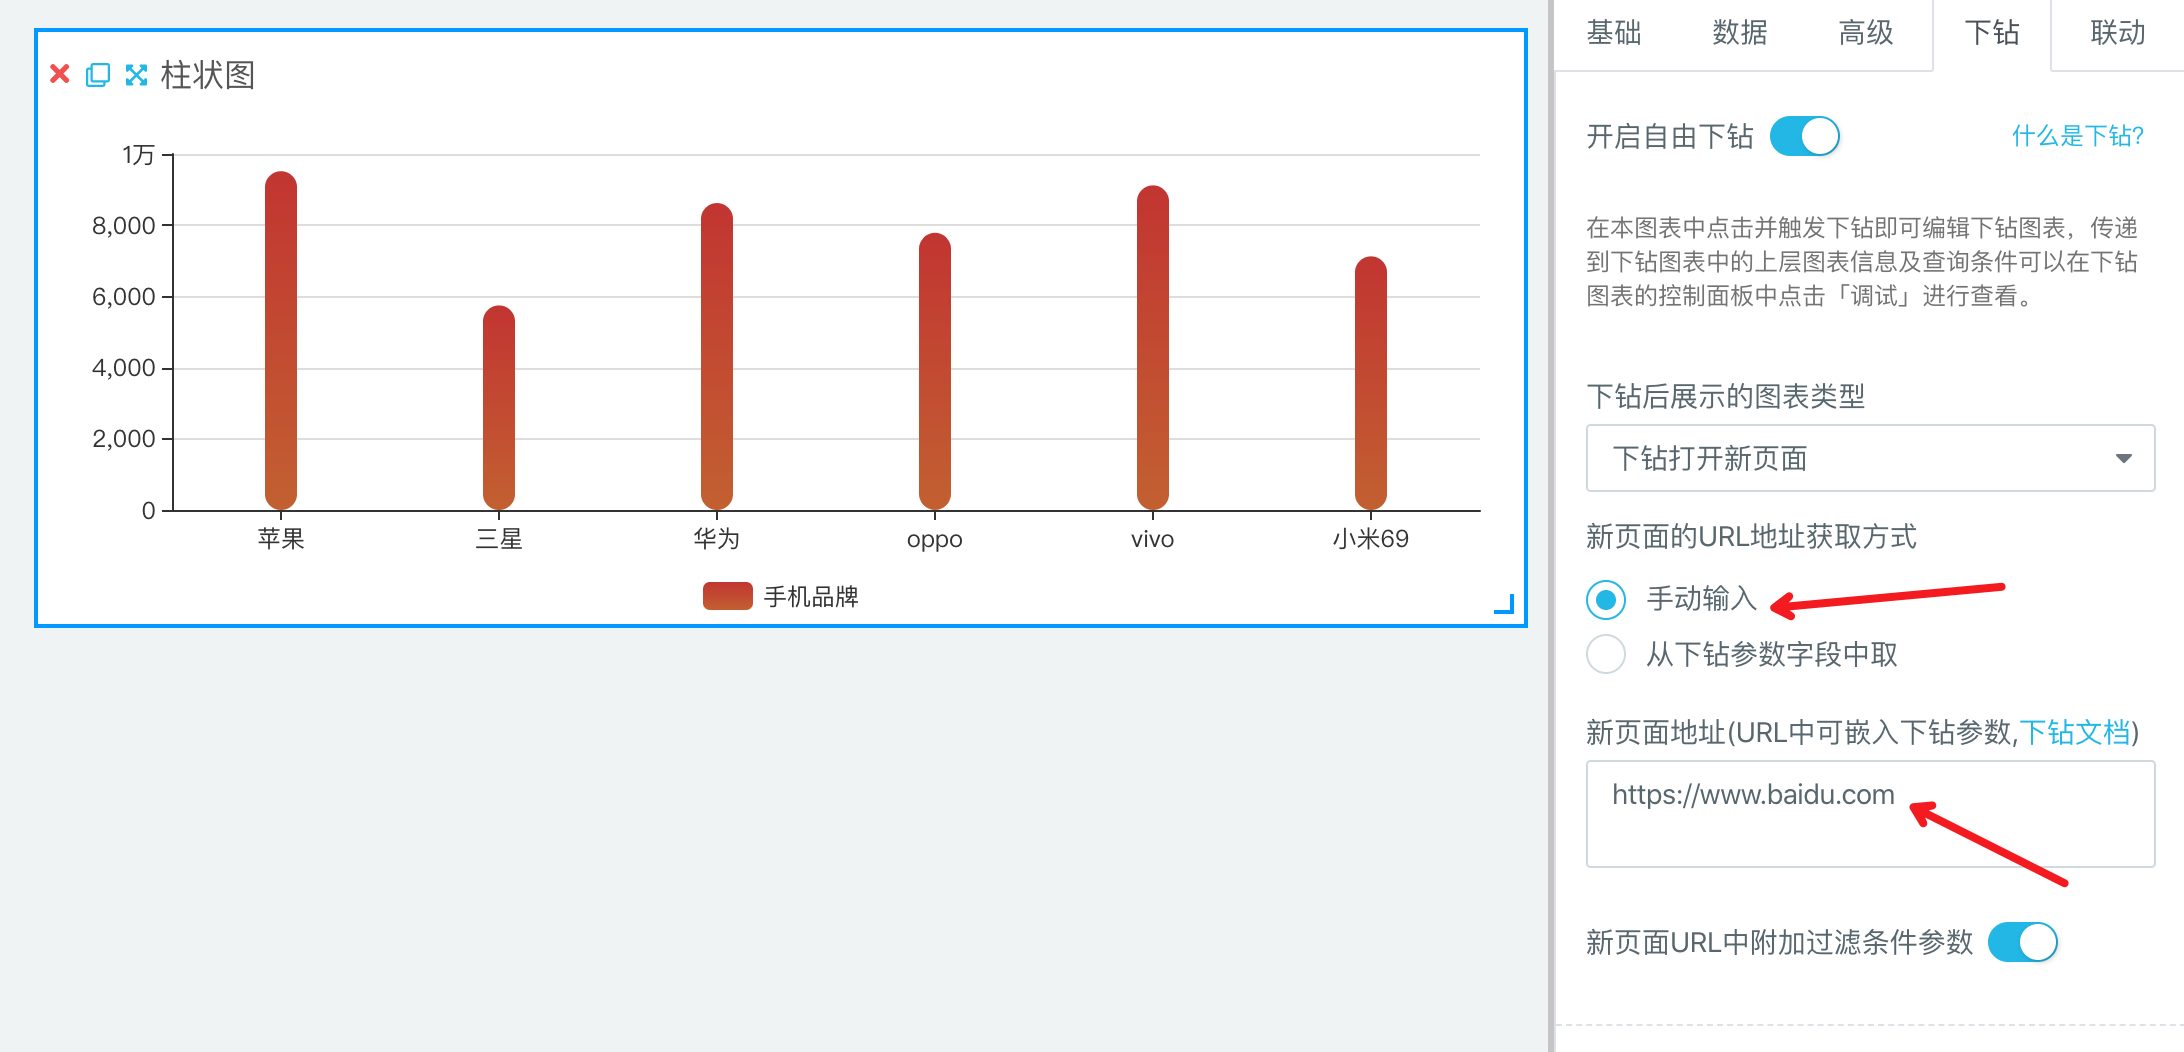
Then use the [Manual Input] mode and input the URL of the new page asthe homepage of Baidu. Finally, clicking any column of the column chart can open the homepage of Baidu.
Of course, in many cases, when we click different columns in the column chart, we expect to add some parameters related to drill-up and drill-down behaviors to the URL of the new page. Here are some modes of embedding parameters supported in Sugar:
Embedding Drill-Down parameters in URL
If your URL already has ? splitted parameters, such as https://www.baidu.com? query=aaa, then use & to continue adding parameters such as drill-down: https://www.baidu.com?query=aaa\&wd={drillDowns}
The syntax for embedding linkage parameter in URL is:
- {drillDowns}
- {drillDowns.key}
- {drillDowns(0).key}
- {drillDowns(first).key}
In most cases, we use{drillDowns}. Where, 0 and first are the drill-down levels. When you drill down in multiple layers, you can get the drill-down parameters of each layer. If you don't write it, the previous level will be taken by default. key is the name of a field in the drill-down parameter item of each layer. The syntax of this block is similar to [Hard-embedded Drill-down Parameters in SQL](SUGAR/Operation Guide/Binding Data in Other Ways/SQL Modeling/Associated Drill-down Parameters in SQL.md#).
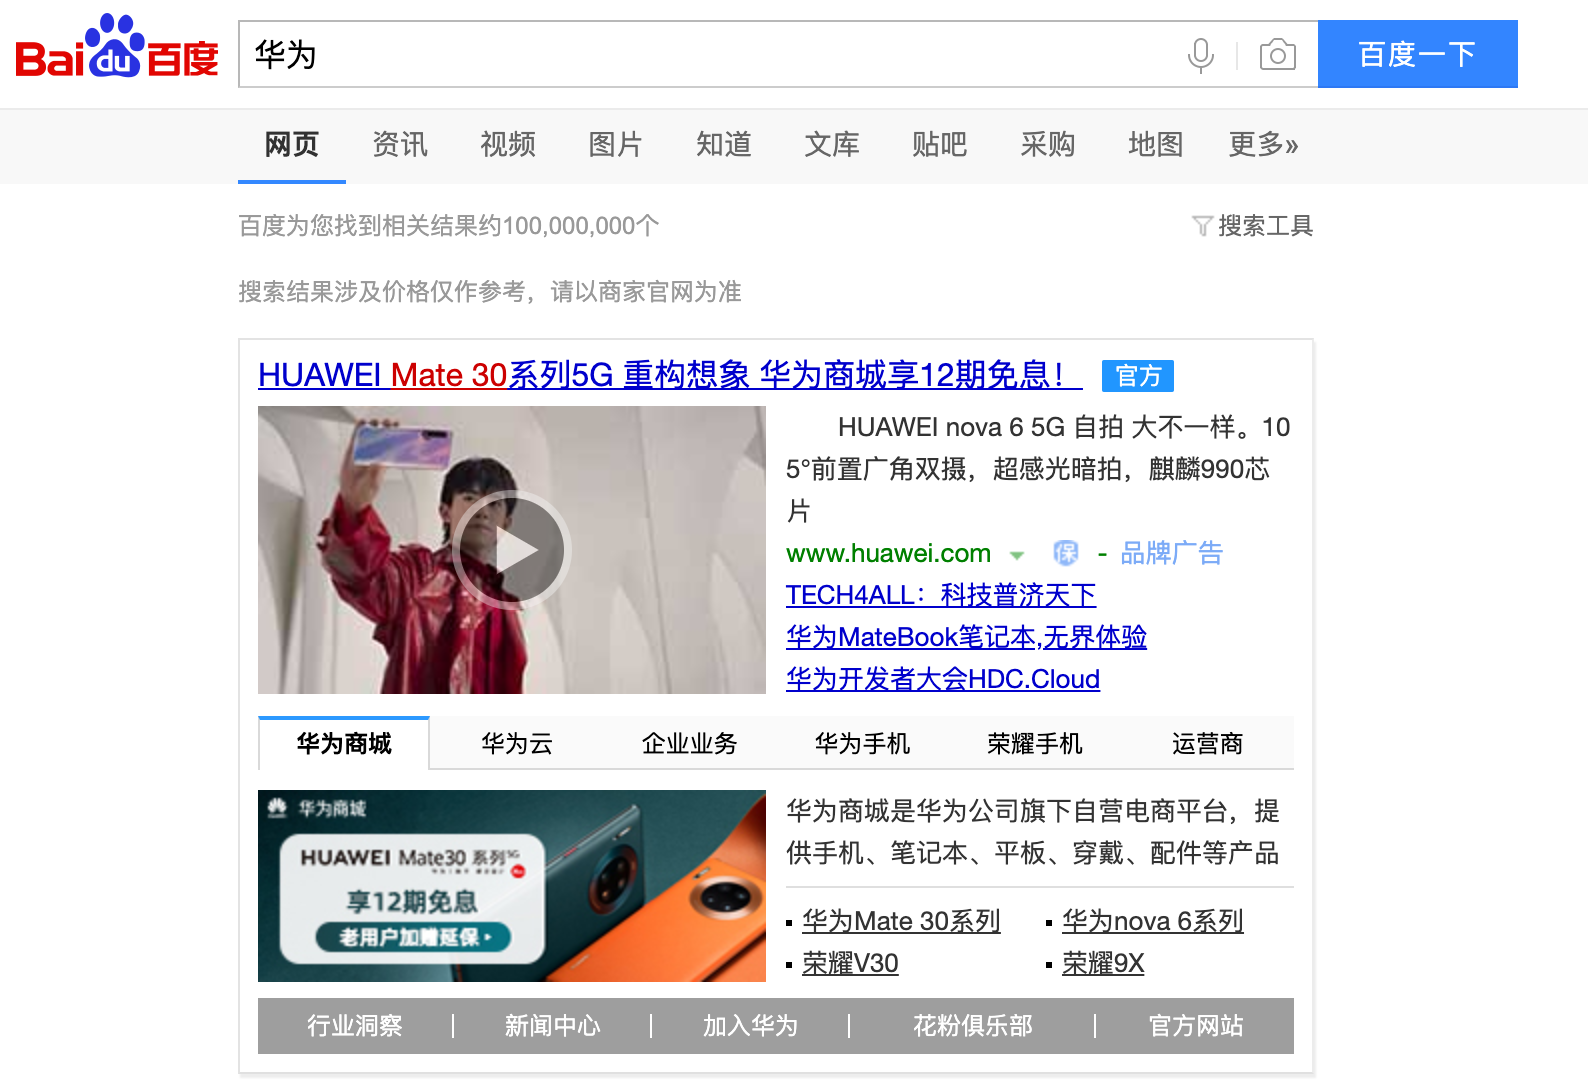
To embed drill-down parameters in the URL as shown in the figure above, click the column [Huawei] to open the page of searching "Huawei" in Baidu:
Embedding filtering parameter in URL:
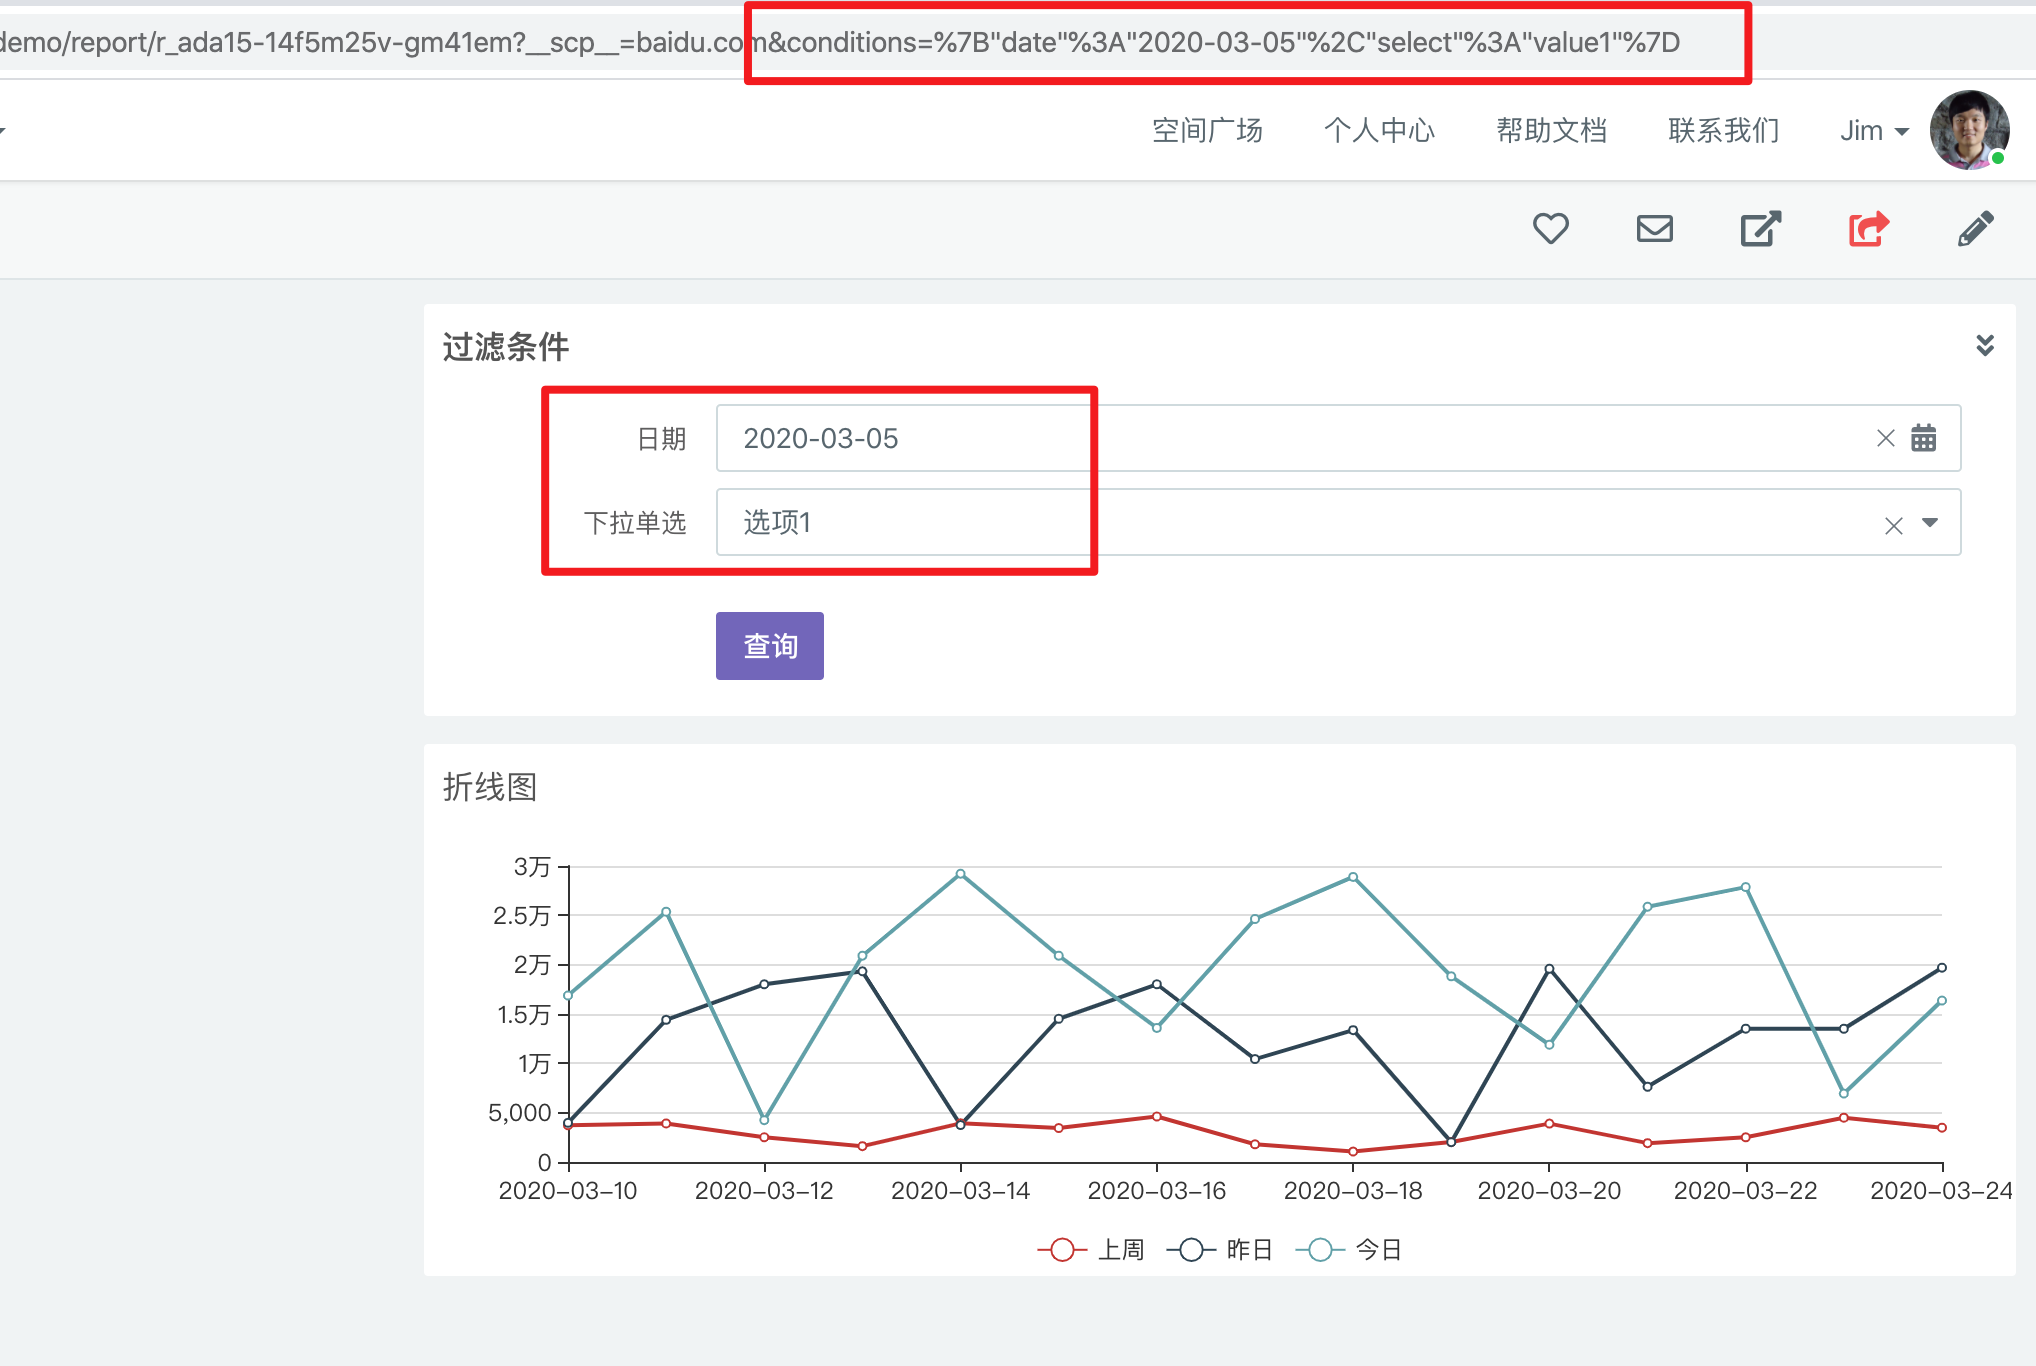
The value of the current page filter conditions can also be embedded into URL, as below, click the column to open a new page, the parameter 'riqi' in the URL will be assigned with 2020-03-05:
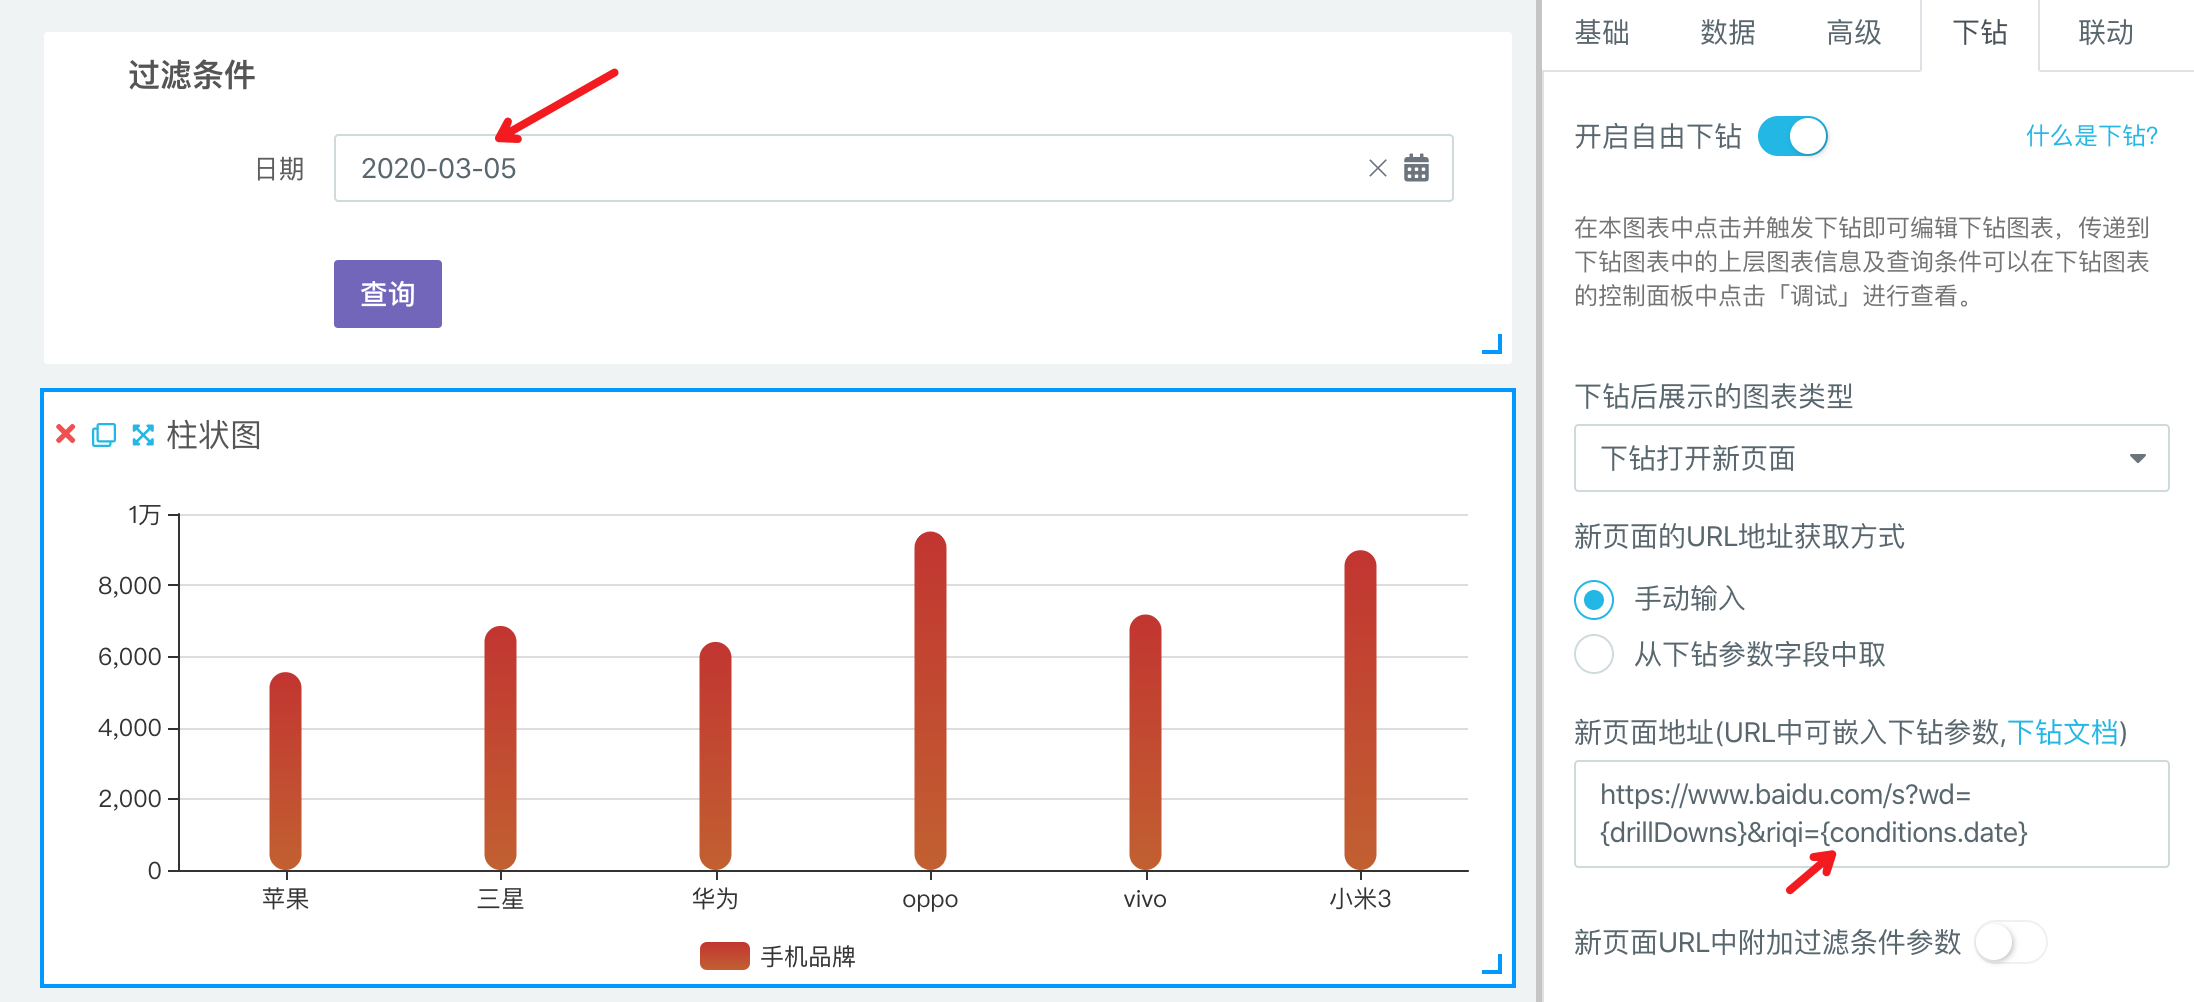
The syntax for embedding filter condition in chart name is: {conditions.key}, where key refers to [Query Key Value](SUGAR/Operation Guide/Visual Analysis/Filter Component/Query Key Value.md#)" of the Filter Condition.
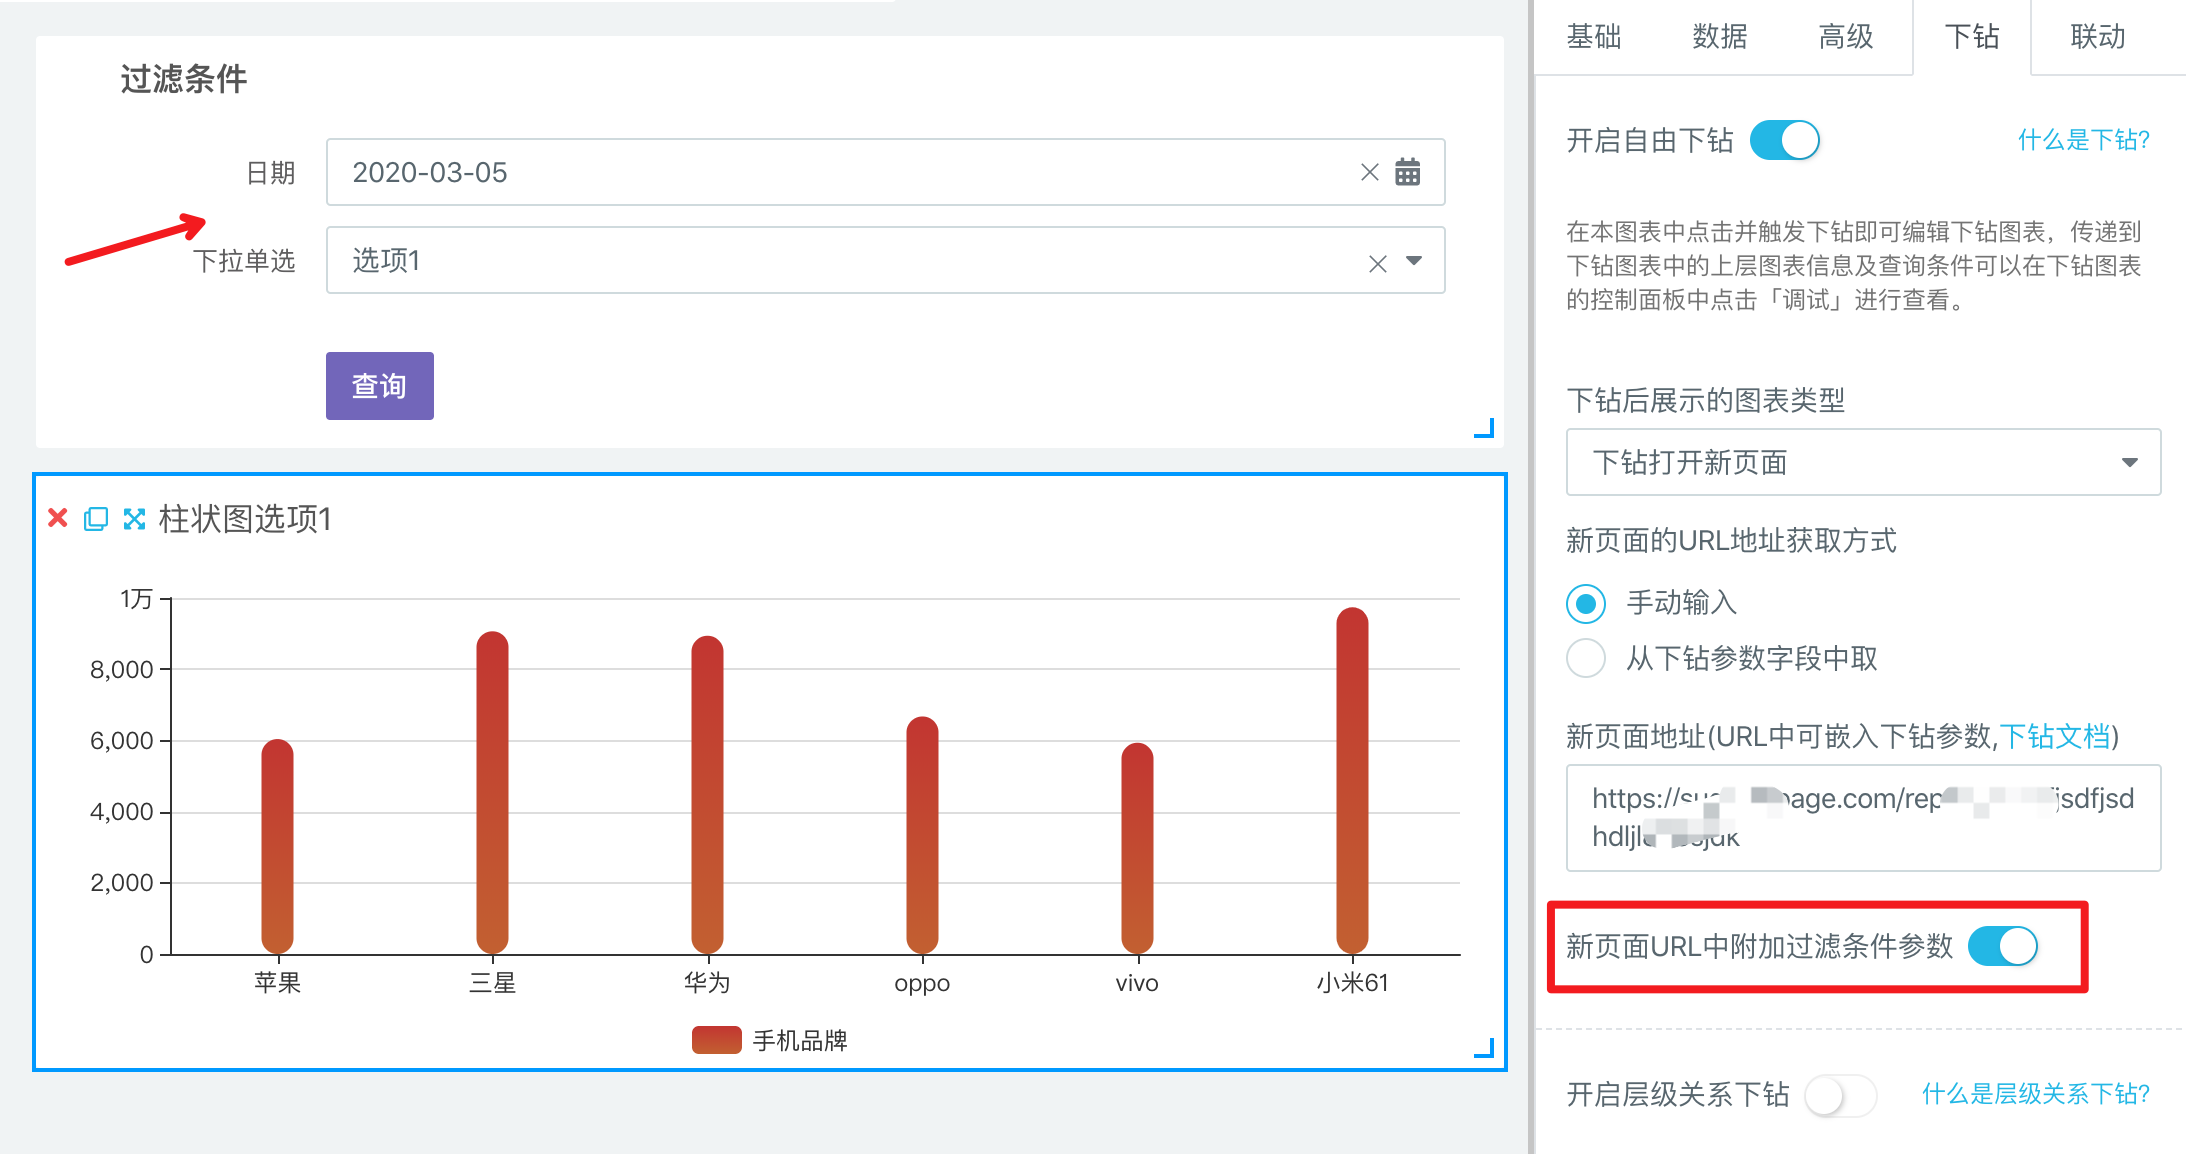
All filter condition parameters are appended to the URL.
Unlike manually embedding filter conditions in the URL as above, we can also allow you transmit the values of multiple filter conditions on the page to the newly opened page just by one click. This feature is often used for redirecting from Page A drill down to page B of Sugar, and synchronize the filter condition values of Page A to Page B. As shown in the figure below, there are two filter conditions in Page A, and drill down of column chart is set as follows:
In the opened new page B, as shown in the figure below, the values of the two filter conditions are brought in. Note To correctly bring over the filter conditions, it is very important to ensure that the [Query 'key' value](SUGAR/Operation Guide/Visual Analysis/Filter Component/Query 'key' value.md#)] of the two filter conditions on page A and page B are exactly the same.
Parameters for drill down
The following are advanced techniques to help you learn more about the principles of drilling down in Sugar. You can browse them selectively.
When the drill down in of the chart is triggered, the open drill down in chart will receive the drill down in parameters related to the click area of the upper chart, and the drill in chart can use this information to dynamically pull data.
There is no need for user to configure the drill down parameters. When each chart triggers drill down, the parameter format passed to the lower chart is fixed. The general format is as follows:
[
{
"Item": {
"Name": "old user",
"value": 11472,
"category": "2018-09-01",
"_Sugar_dd_default_": "2018-09-01"
}
"fireKey": ""
}
{
"Item": {
"Subsys": "Beijing headquarters",
"Module": "marketing department",
"Business": "the first team",
"Name": "Li Si",
"value": 7673456.78,
"value_level": "green",
"url": "http://www.baidu.com",
"Sugar DD default": "Li Si"
}
"fireKey": "name"
}
]- Generally speaking, the drill down parameter is an array. When there are multiple layers of drill down, the array contains the parameters passed from each layer of chart to the lower layer. These parameters can be used in the drill down chart
-
Each
itemandfireKeyitemis an object that contains specific information related to drill down, such as the data in a row of the table triggering drill down.fireKeyis a string, which can be used to distinguish which kind of drill down is triggered when a certain chart can trigger multiple types of drill down. Generally, it is not used.
When drilling down in each chart, the parameters passed to the lower chart are different. You need to debug the data in the chart to see similar parameters.
Using drill down parameters in SQL modeling and API mode
If the drill down chart uses the API method to pull data, the drill down parameters will be automatically placed in the body of the API request and sent to the user's API back end. The user can use these parameters to pull data in the API. For details, see "[Drill Down Parameters in the Chart API Request](Sugar/Operation Guide/Other Methods to Bind Data/API/API Back End to Get the Drill Down Parameters.md#)"
If the drill down chart uses SQL modeling to pull data, the drill down parameters can be embedded in the SQL statements of the SQL model bound to the drill down chart. For specific syntax, please see "[Insert Drill Down Parameters in SQL Statements](Sugar/OperationGuide/BindDatabyOtherMethods/SQLModeling/AssociateDrillDownParametersinSQL.md#)"