
Make a dashboard
Create a dashboard and enter editing
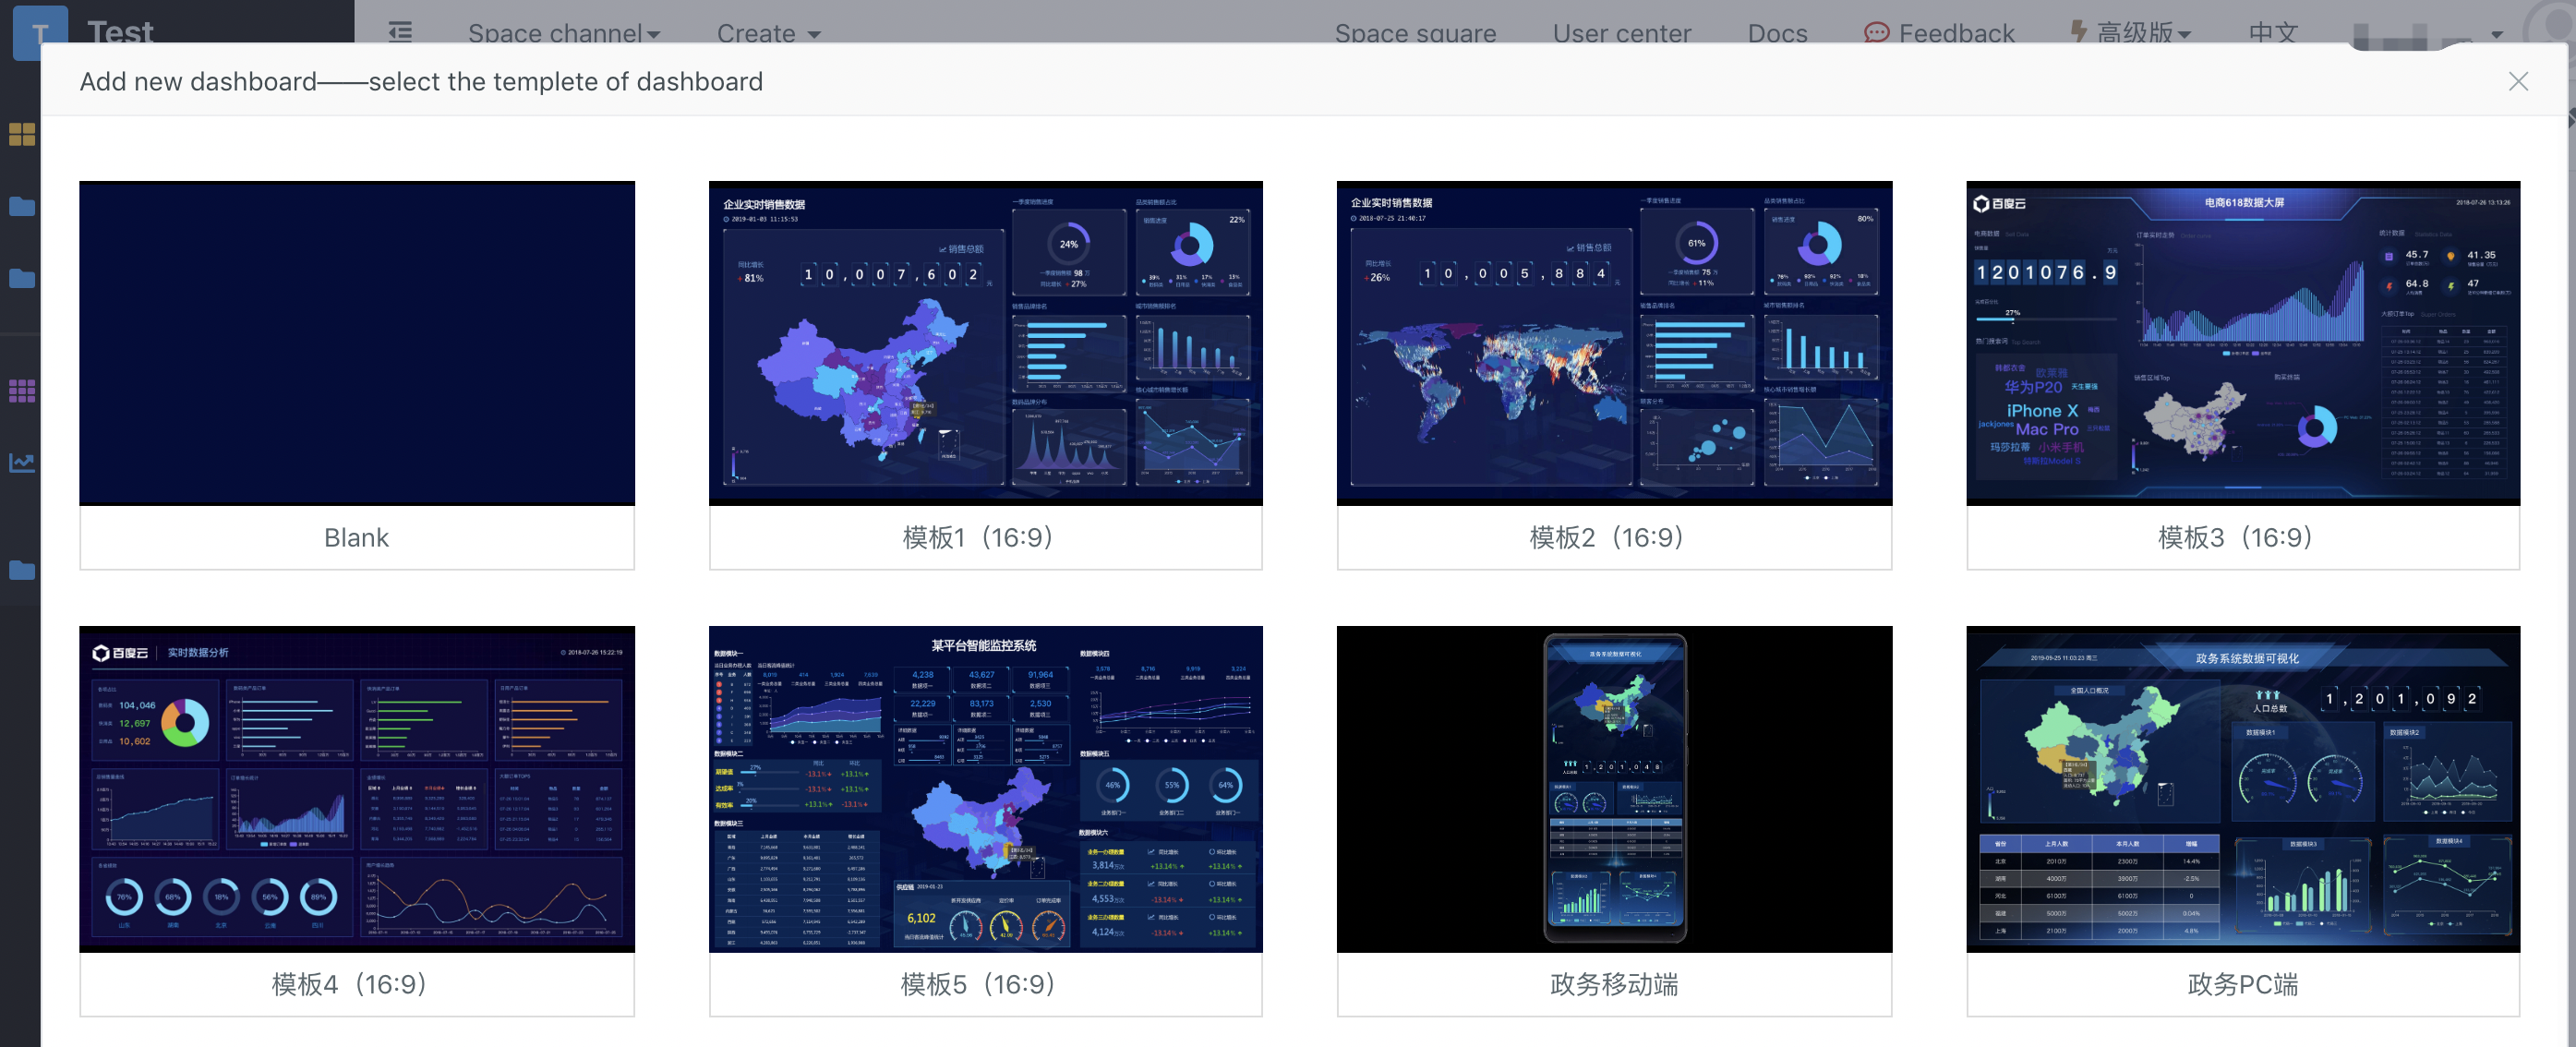
Dashboard can be created quickly in the navigation on the left side of the space. Dozens of large screen templates are available for you to choose from:
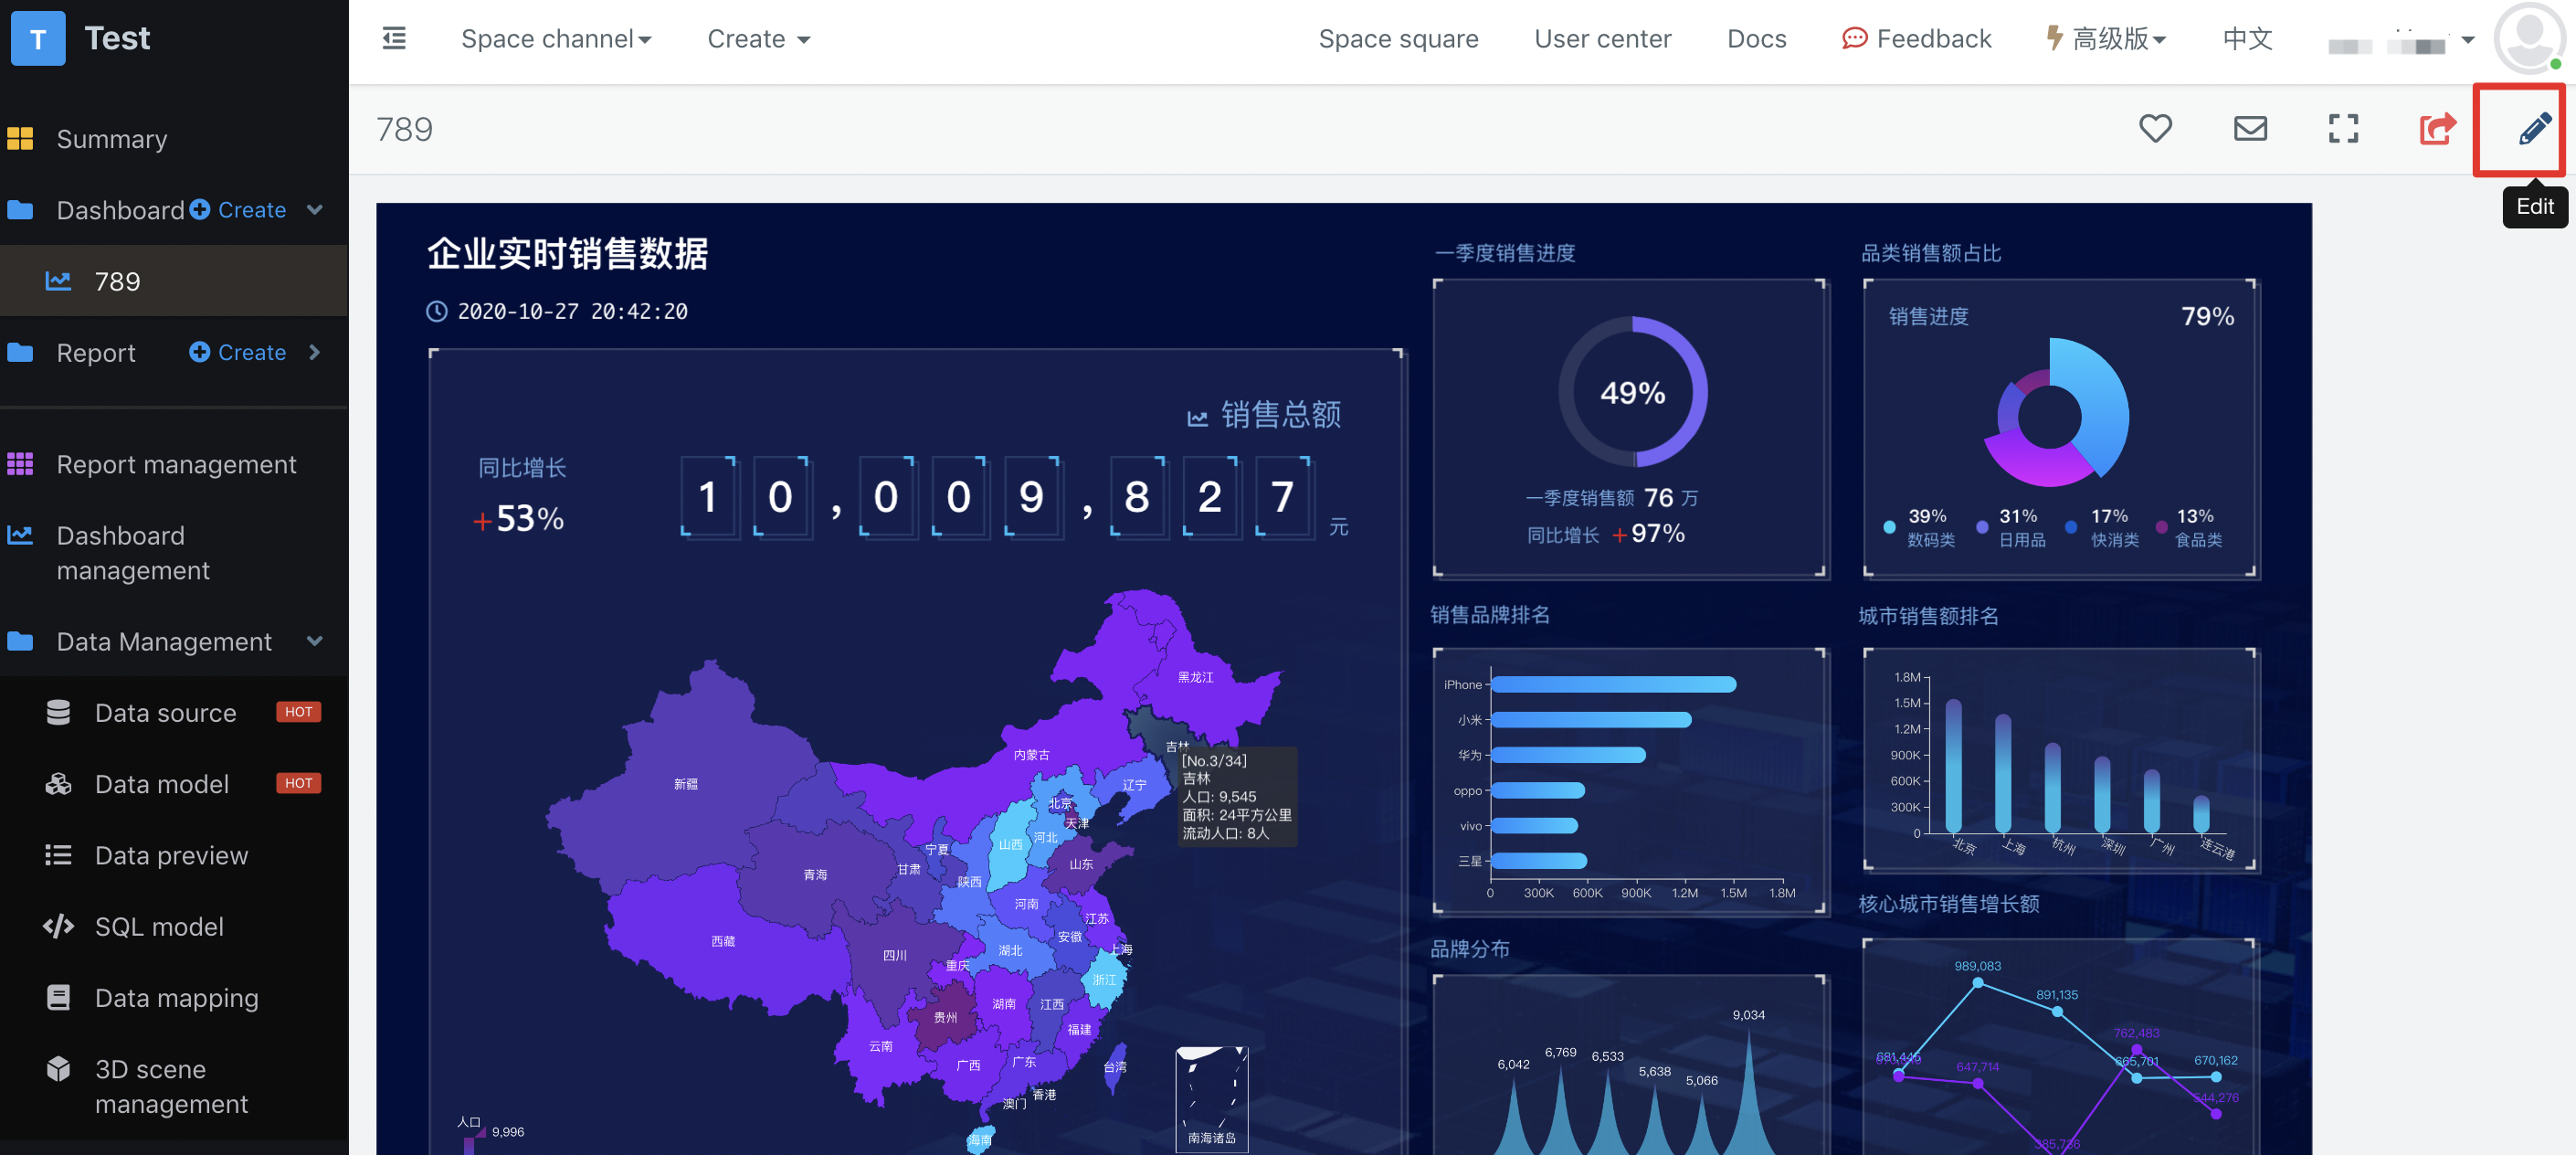
After choosing one template and creation, it will automatically enter the new dashboard page, and click the "Edit" button on the upper right side of the page to modify the dashboard:
Replace data in the template
In the dashboard editor, you can do the following:
- Add various charts through the toolbar at the top
- Click to select the chart, drag to change the position and size of the chart, and delete the chart,
- There is layer management on the left sides of the page. You can adjust the layer of the chart to change the coverage relationship between charts
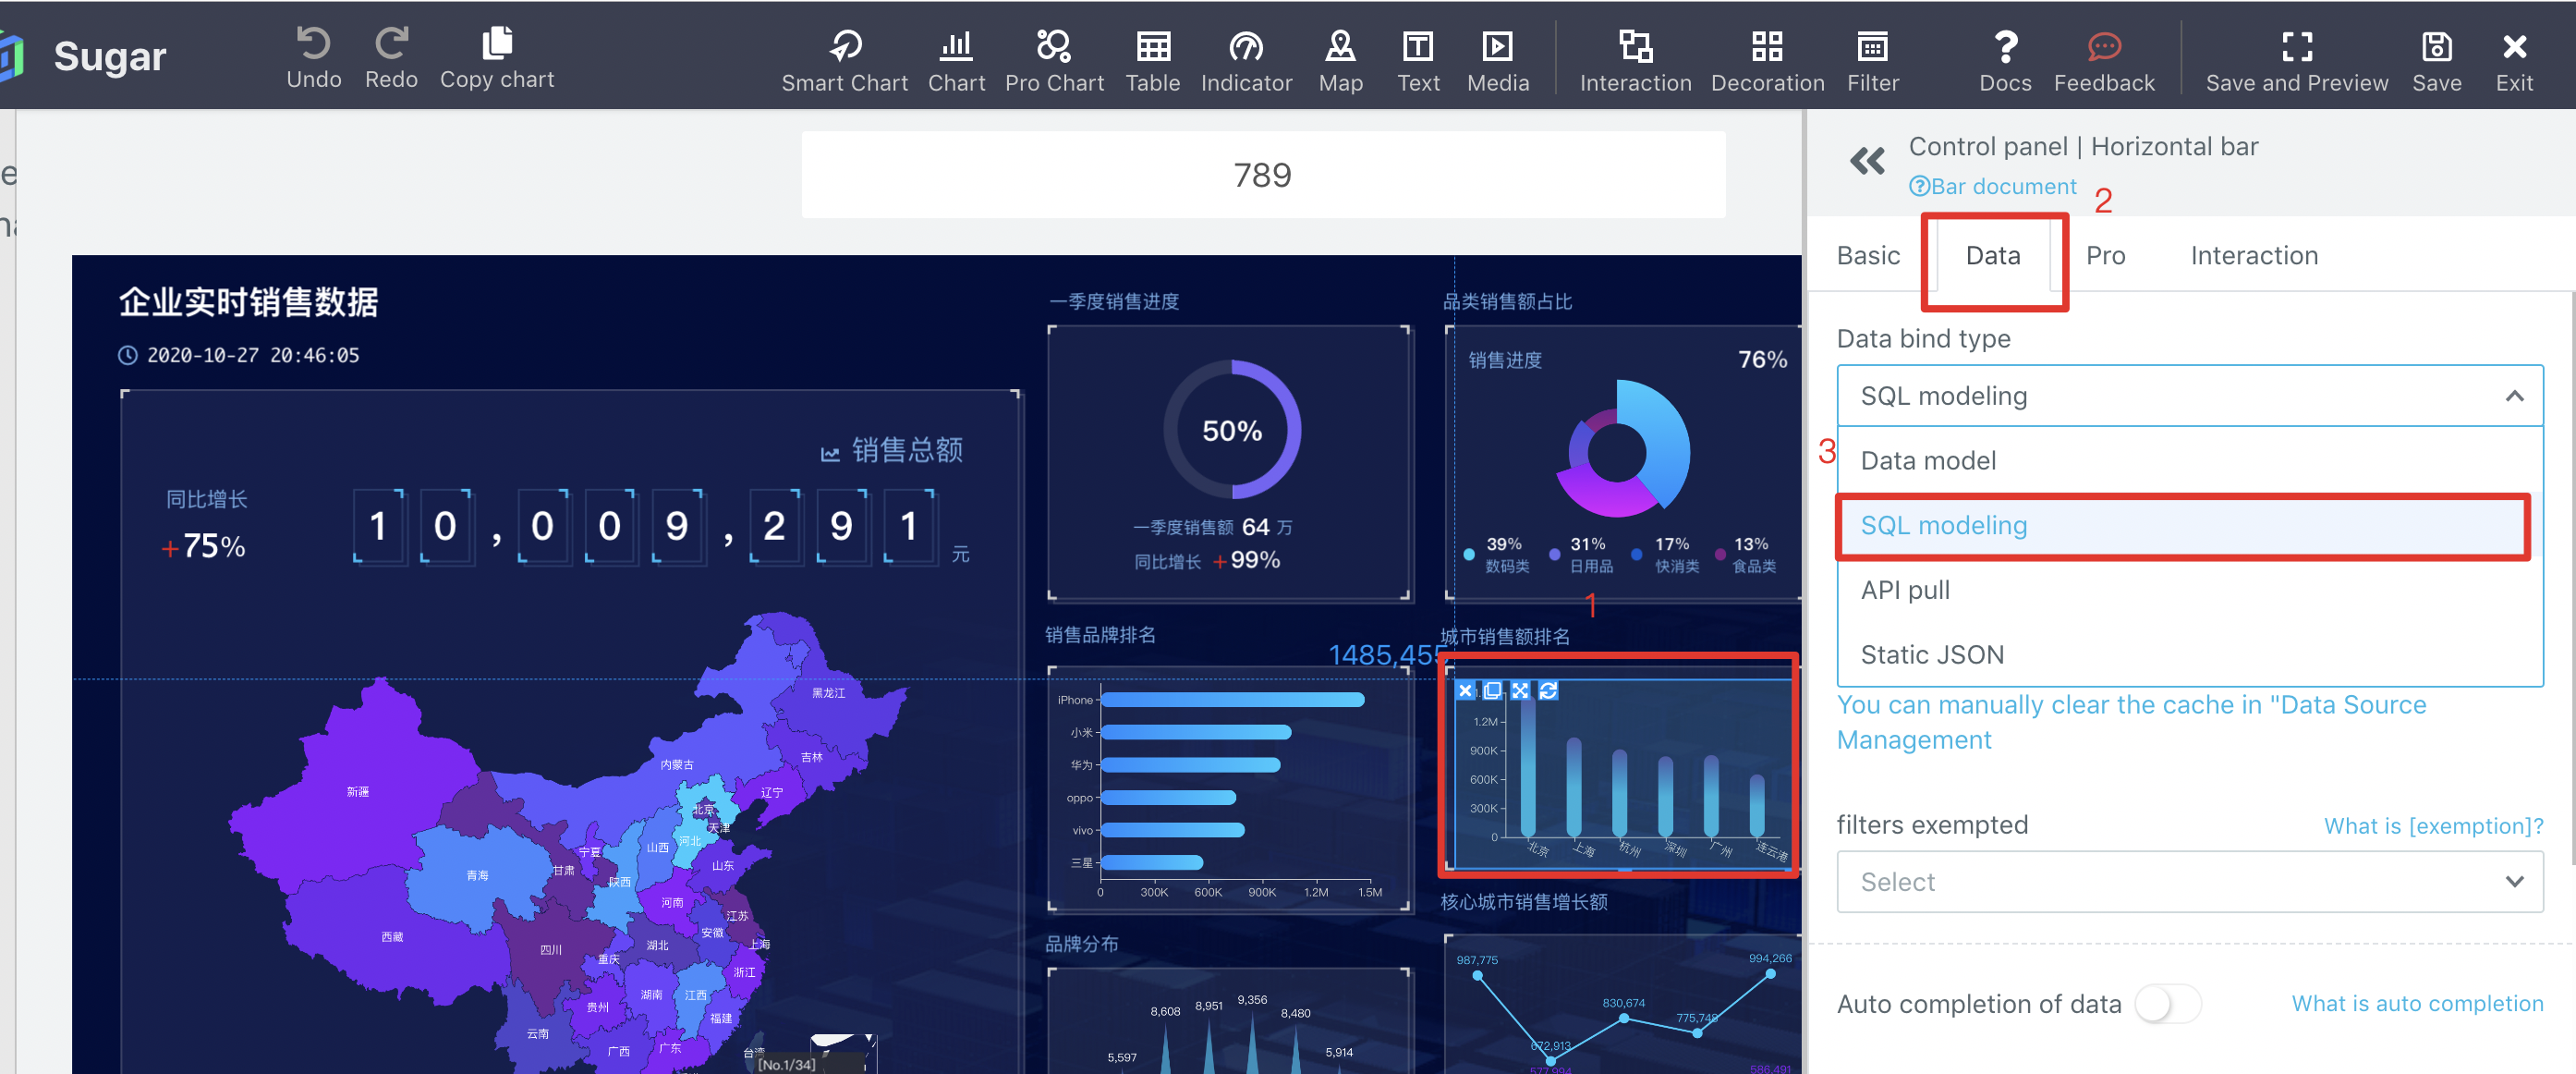
- After selecting the chart, you can change the data binding of the chart and replace it with your real data. Here is how to change the data of the chart:
Click to select a column chart. In the control panel, change data binding method to Data model:
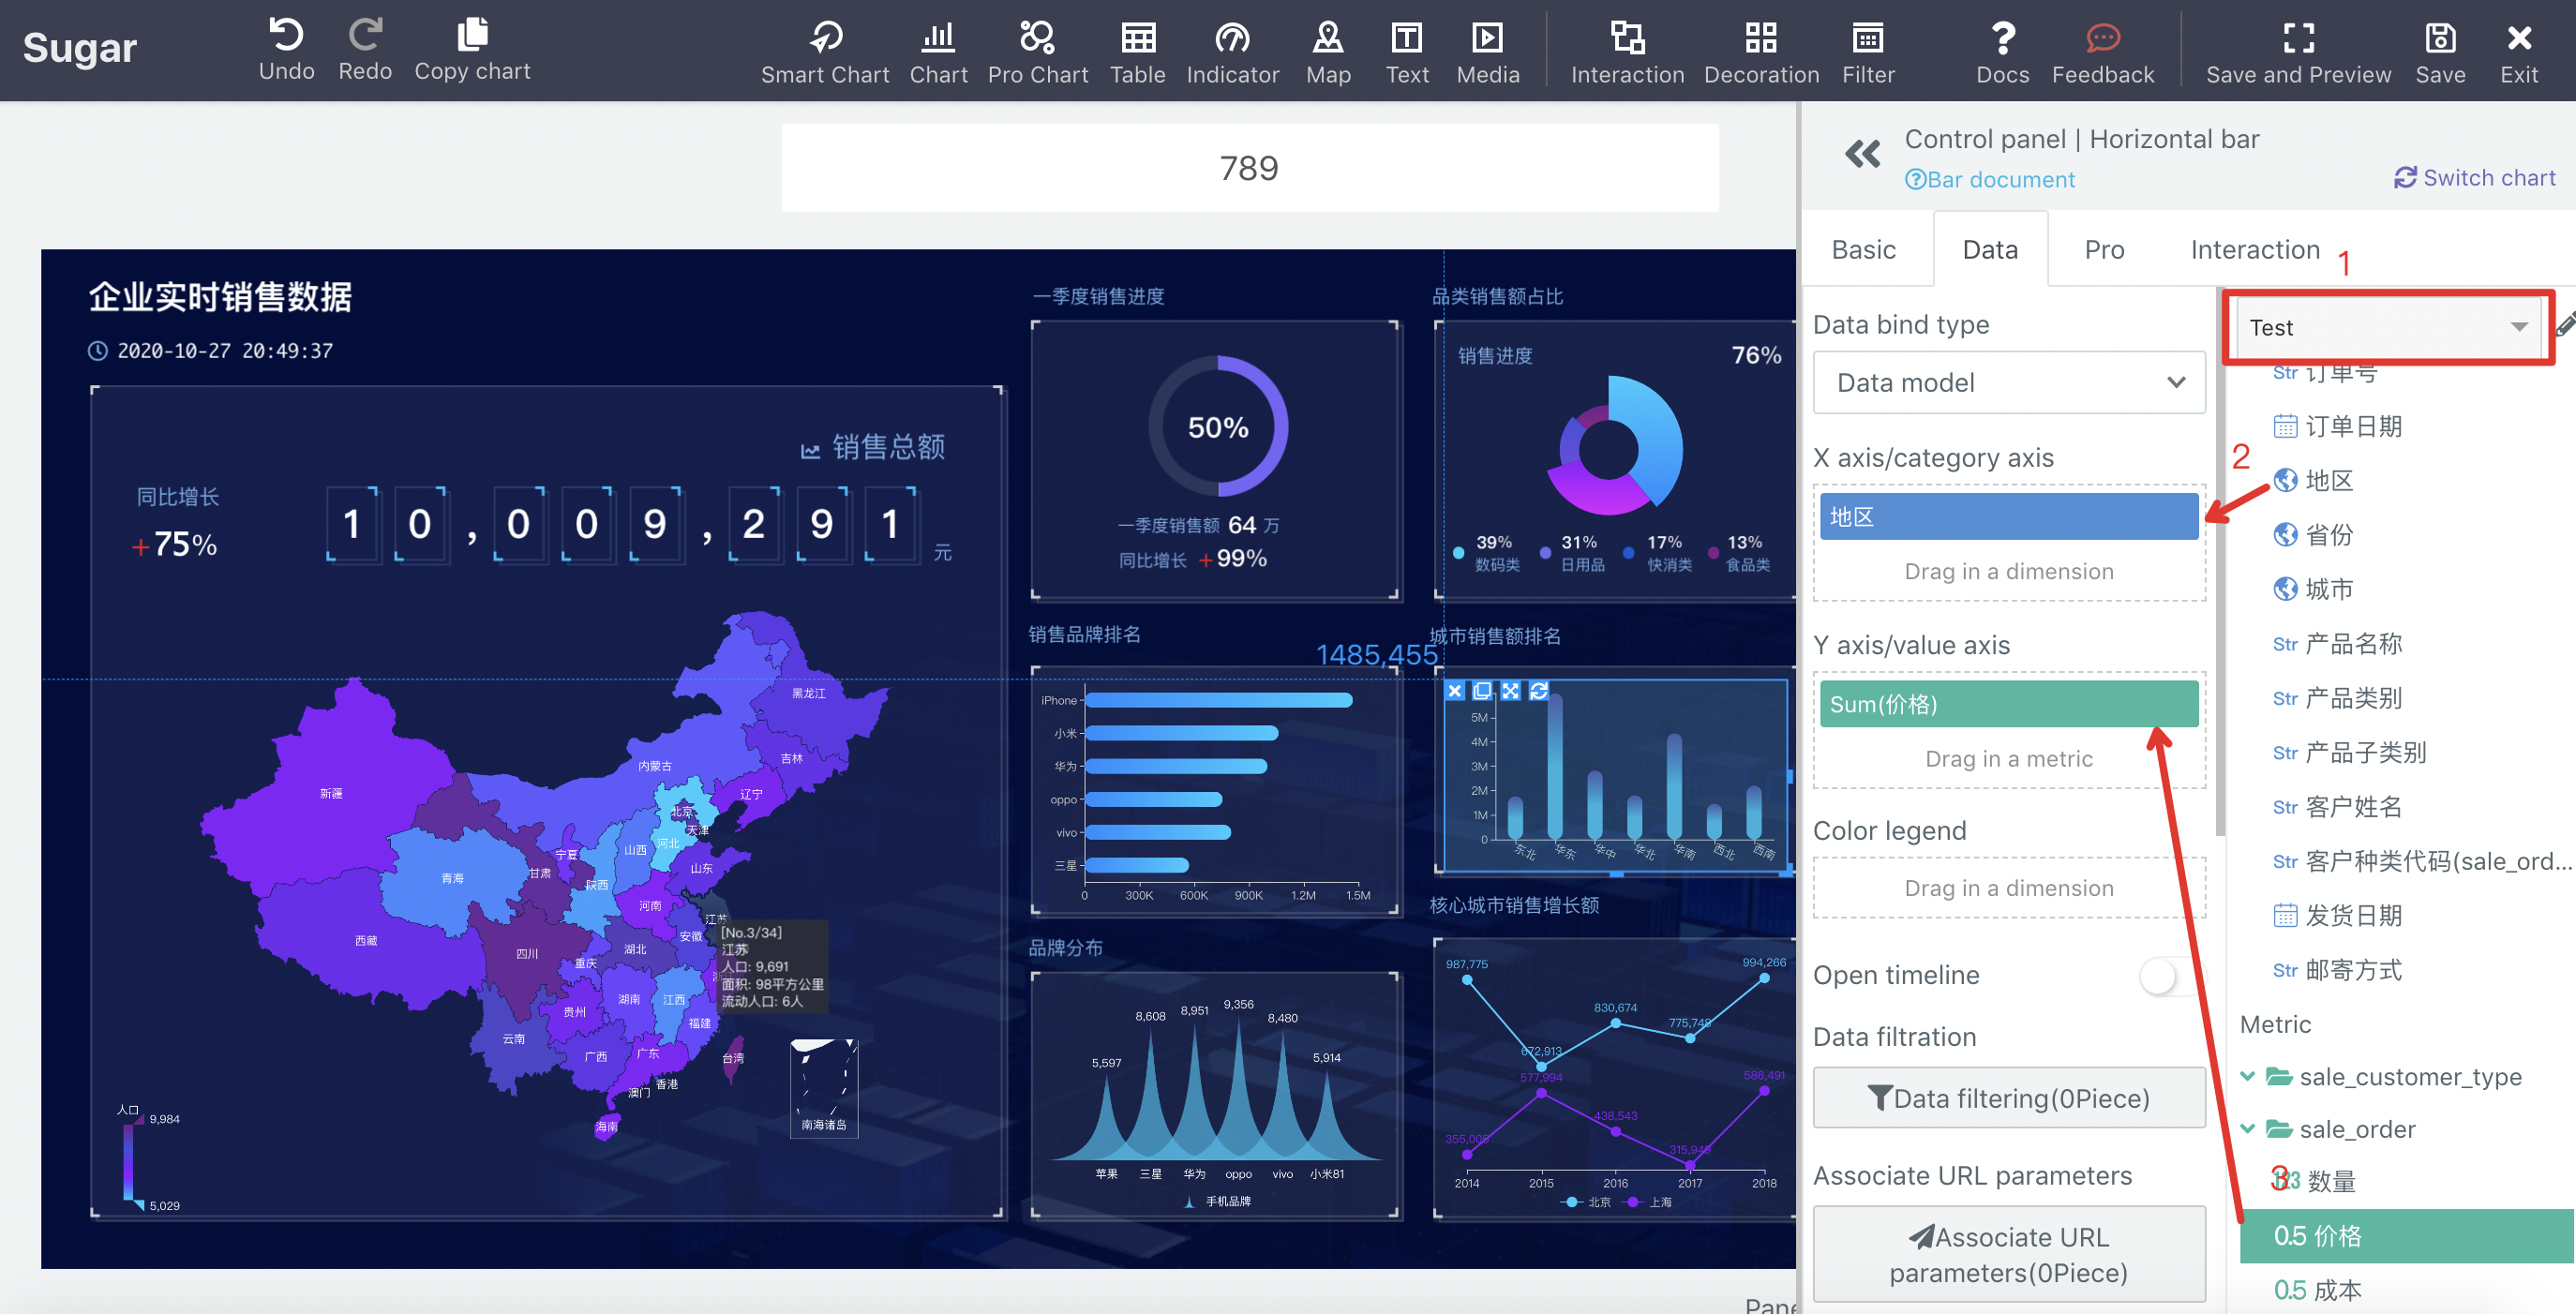
Select one data model, then drag area to the x-axis, drag price to the y-axis, the chart will refresh automatically:
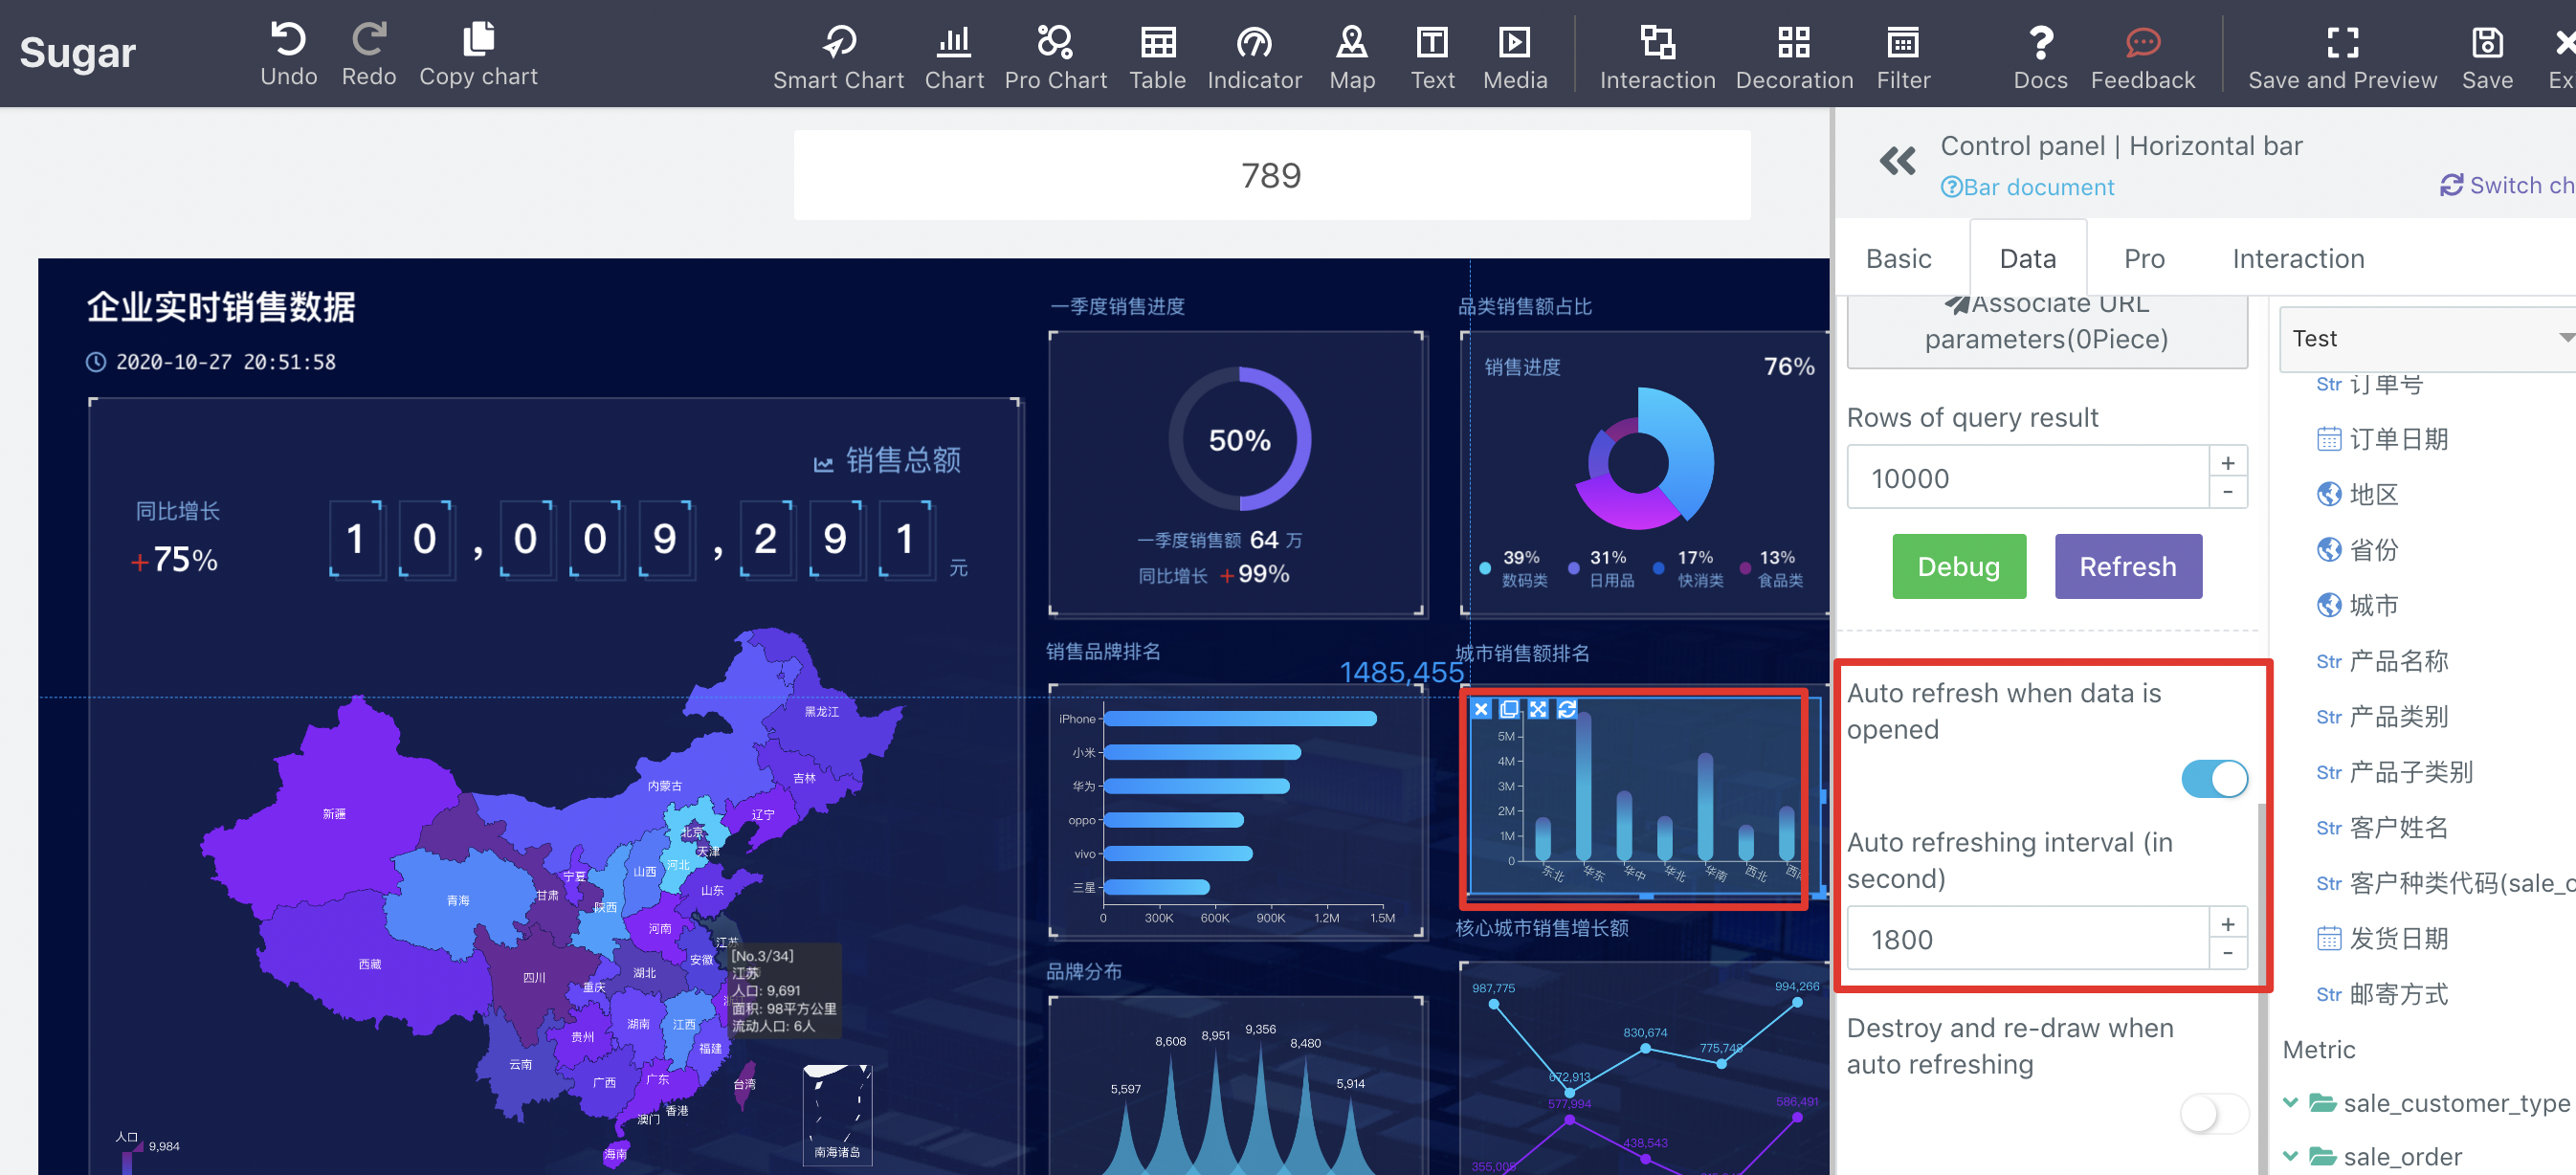
Set scheduled refresh of chart
The data in the dashboard can be automatically refreshed for each period of time to achieve real-time effect:
Use the same method to change the data of all components in the template. Finally, you need to click save and exit in the upper right corner of the page.