
Get Started in 5 Minutes
In this tutorial document, we will introduce how to use Palo UI to have a quick experience and how to use Palo to query.
Before reading this tutorial ducment, please refer to Create Cluster document to create a PALO cluster.
Palo UI is a Web UI environment that Palo provides to quickly execute query requests provided by Palo, which can quickly execute query requests and perform some management operations.
The demo data and query examples used in this document are all from Star Schema Benchmark, user can click Download to get sample data and SQL statements.
Enter into Palo UI
In the details page of Palo cluster, a quick entry for Palo UI is provided.
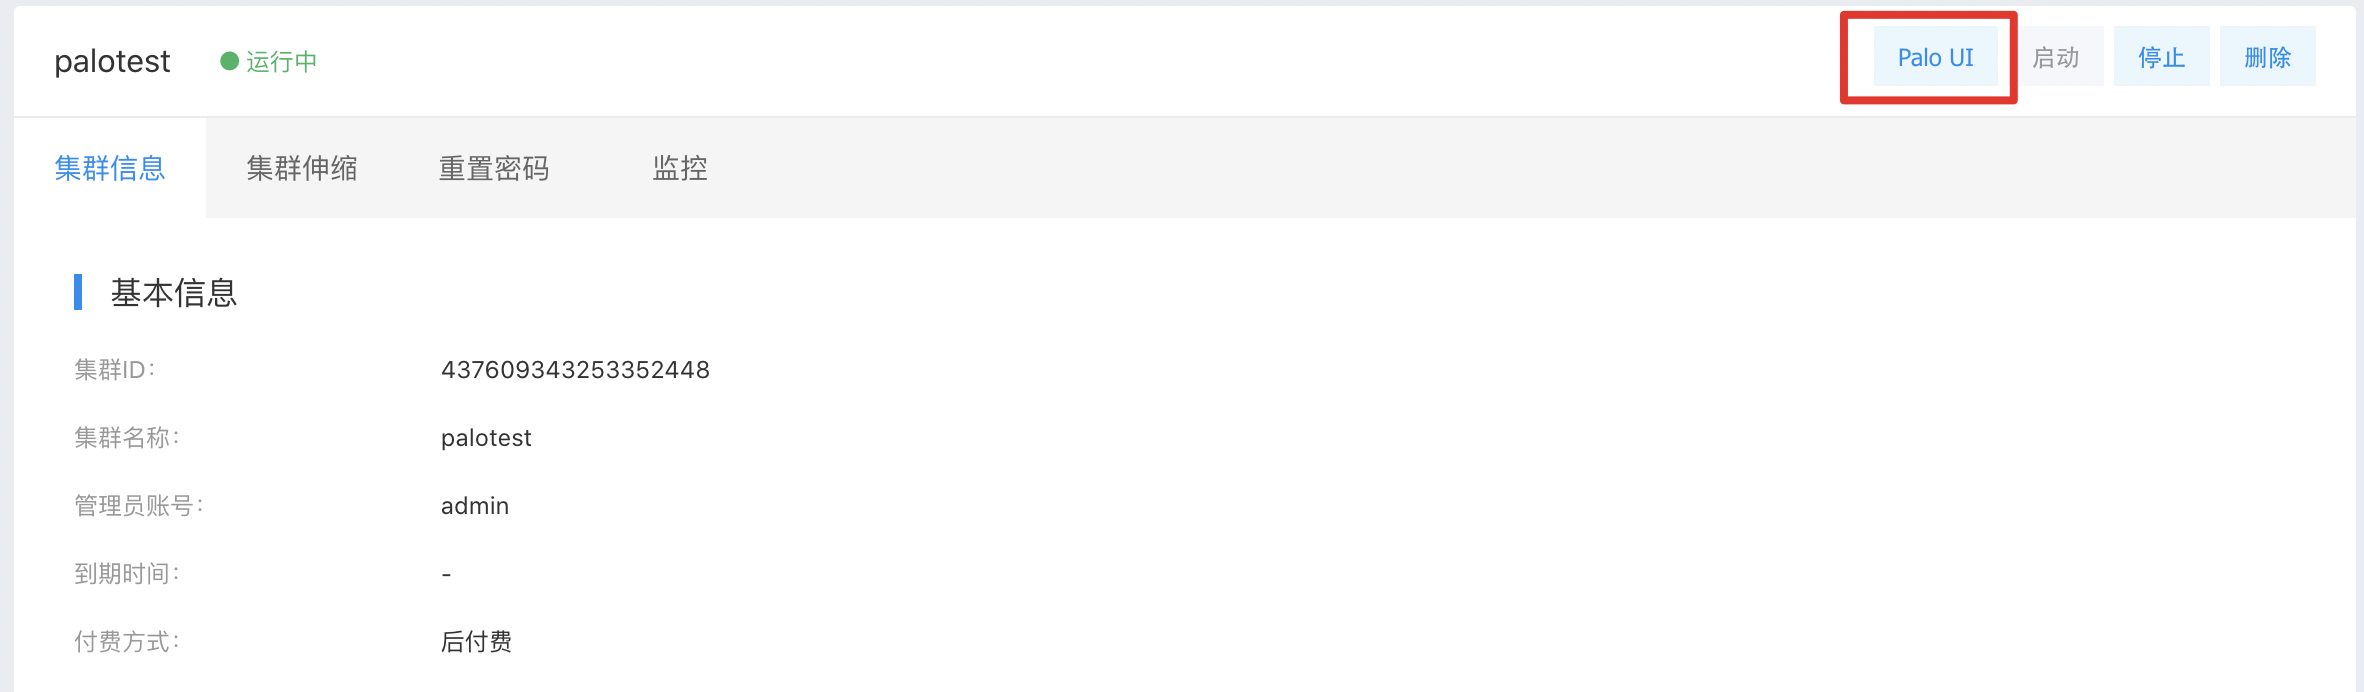
Click the Palo UI button to enter the Web UI environment. Enter the user name and password on the login page, the user name is "admin" and the password is the password filled in when the cluster is created.

Click login to enter the main page of Palo UI, the default page is Palo query page (Playground).
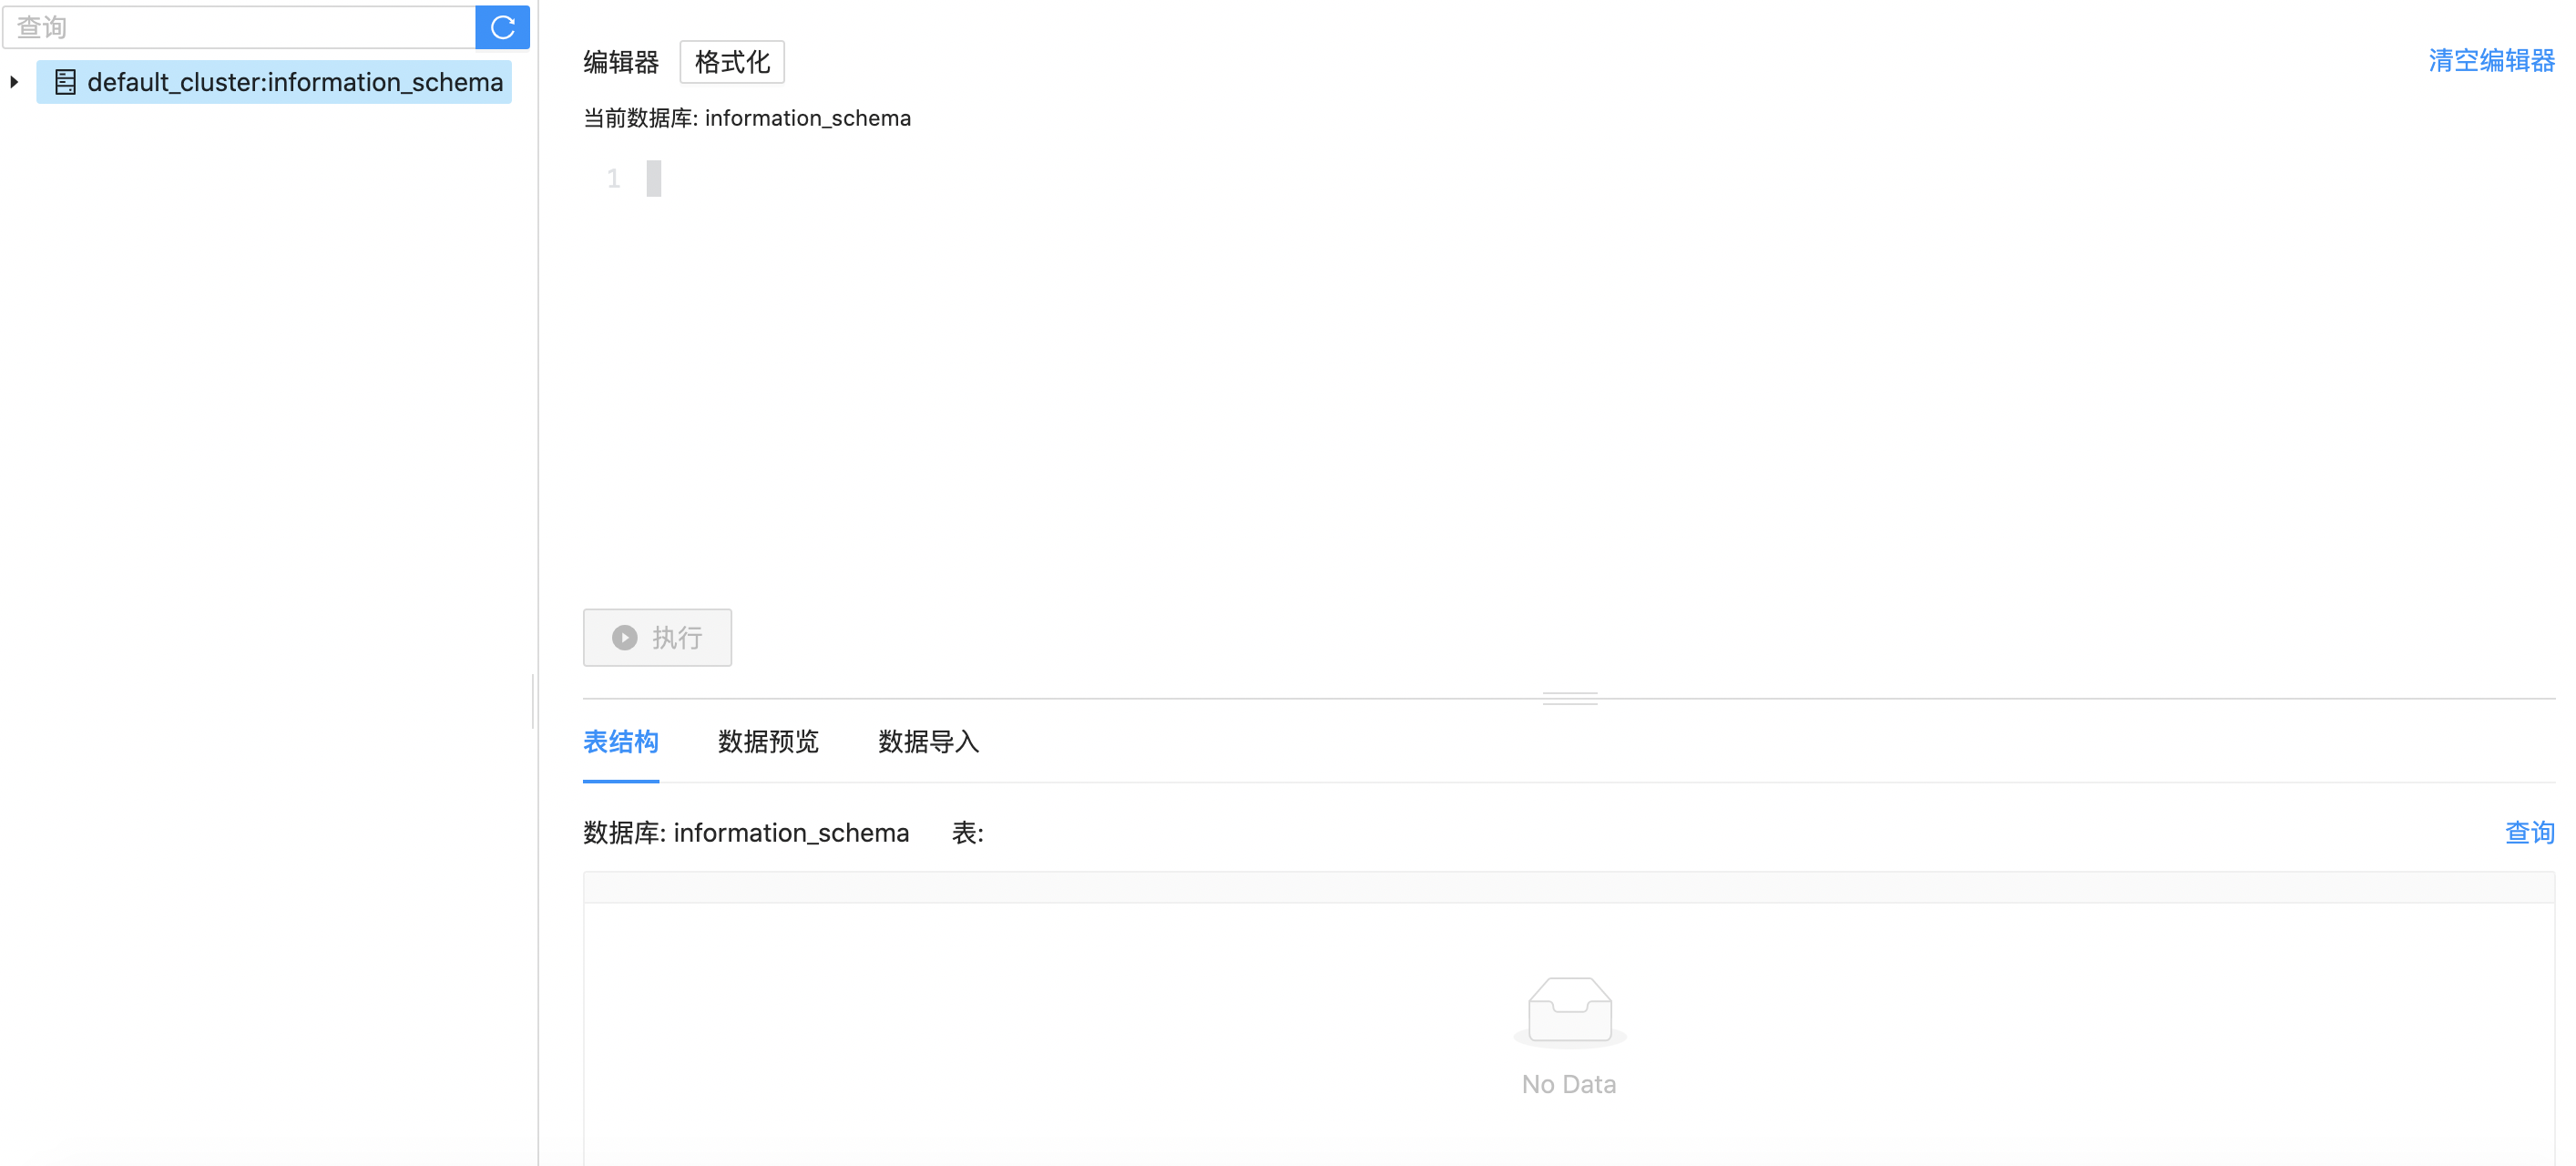
Palo quick query page is mainly divided into three areas, and the left side is the table management area, including system library tables and tables created by users themselves. The upper right area is the SQL execution area, and the lower right area is the table preview, data import and execution result area. Next, we show the main steps from database building, table building, data importing, query, etc. on this page to help users who use Palo for the first time experience a complete use process.
Database building and table building
In the editor area, enter SQL statements to create a library of example_db. After clicking the Execute, an execution result will be displayed at the bottom. After successful execution, refresh the left table area, the newly created example_dblibrary will be displayed in the table management area.
CREATE DATABASE example_db;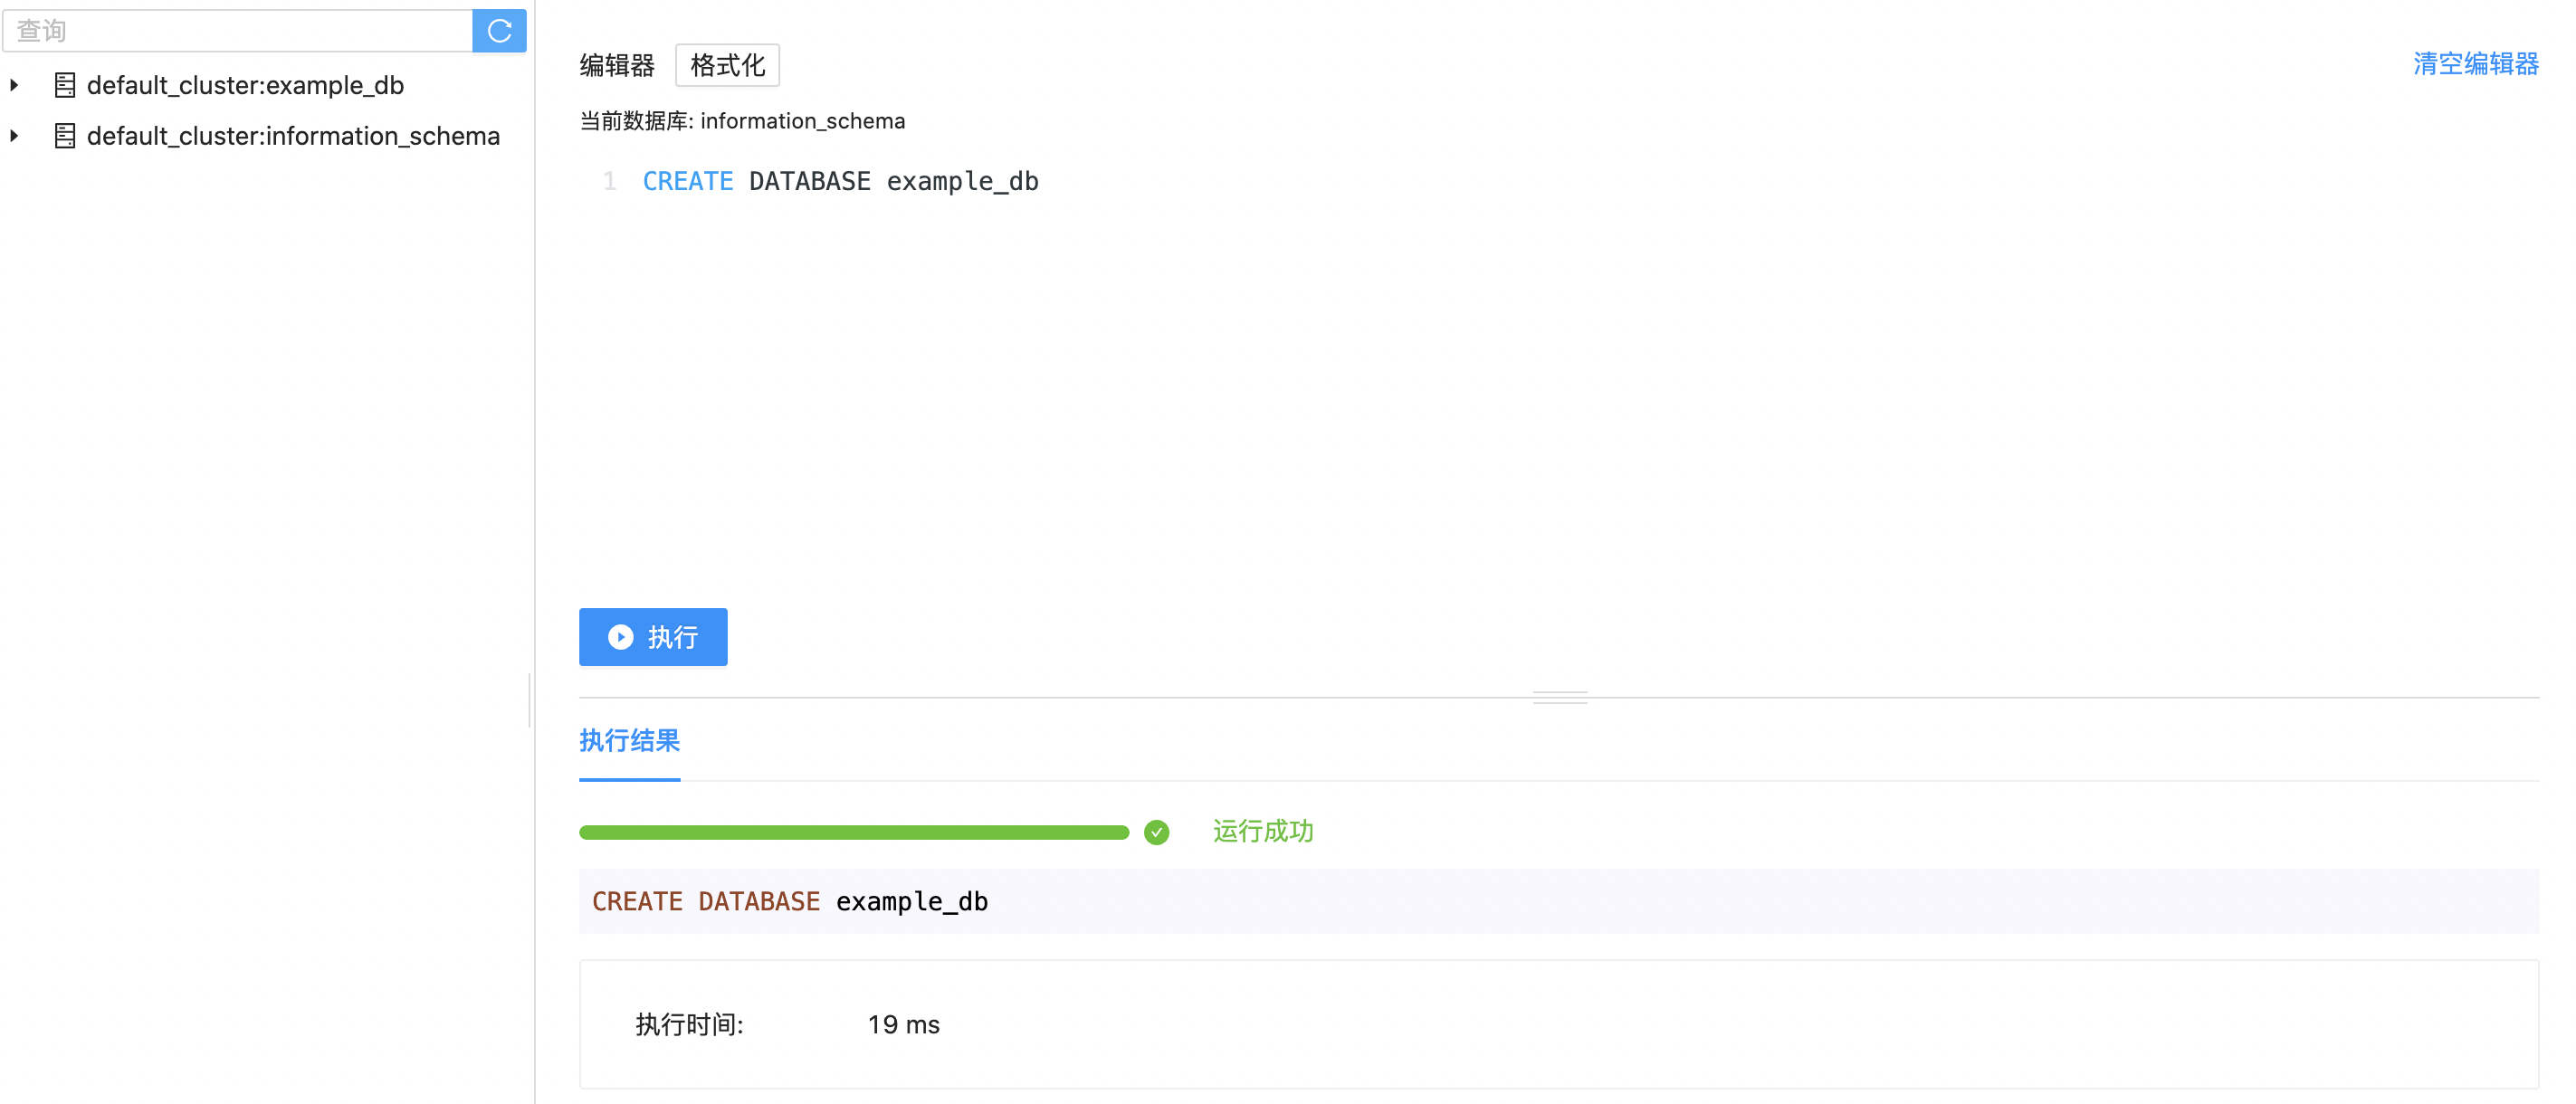
The demo data contain a total of 5 sales-related orders, dates, customer information and other data samples, so we need to create 5 corresponding tables.
Firstly, in the example_db library, create a table namedlineorder. Palo uses the key wordDISTRIBUTED keyword to set the bucketing column used to divide the data horizontally. Generally, we choose a column that can help data to be evenly divided as the bucketing column. Here we use lo_orderkey as the bucketing column. Here we also set the copy number as 1, as the default copy number in Palo is three, if we buy one Compute Node in the cluster, we need to set the copy number as 1.
This table mainly defines the order number, order time, profit, taxes and other order main information.
CREATE TABLE lineorder (
    lo_orderkey BIGINT,
    lo_linenumber BIGINT,
    lo_custkey INT,
    lo_partkey INT,
    lo_suppkey INT,
    lo_orderdate INT,
    lo_orderpriotity VARCHAR(16),
    lo_shippriotity INT,
    lo_quantity BIGINT,
    lo_extendedprice BIGINT,
    lo_ordtotalprice BIGINT,
    lo_discount BIGINT,
    lo_revenue BIGINT,
    lo_supplycost BIGINT,
    lo_tax BIGINT,
    lo_commitdate BIGINT,
    lo_shipmode VARCHAR(11)
)
DISTRIBUTED BY HASH(lo_orderkey)
PROPERTIES ("replication_num"="1");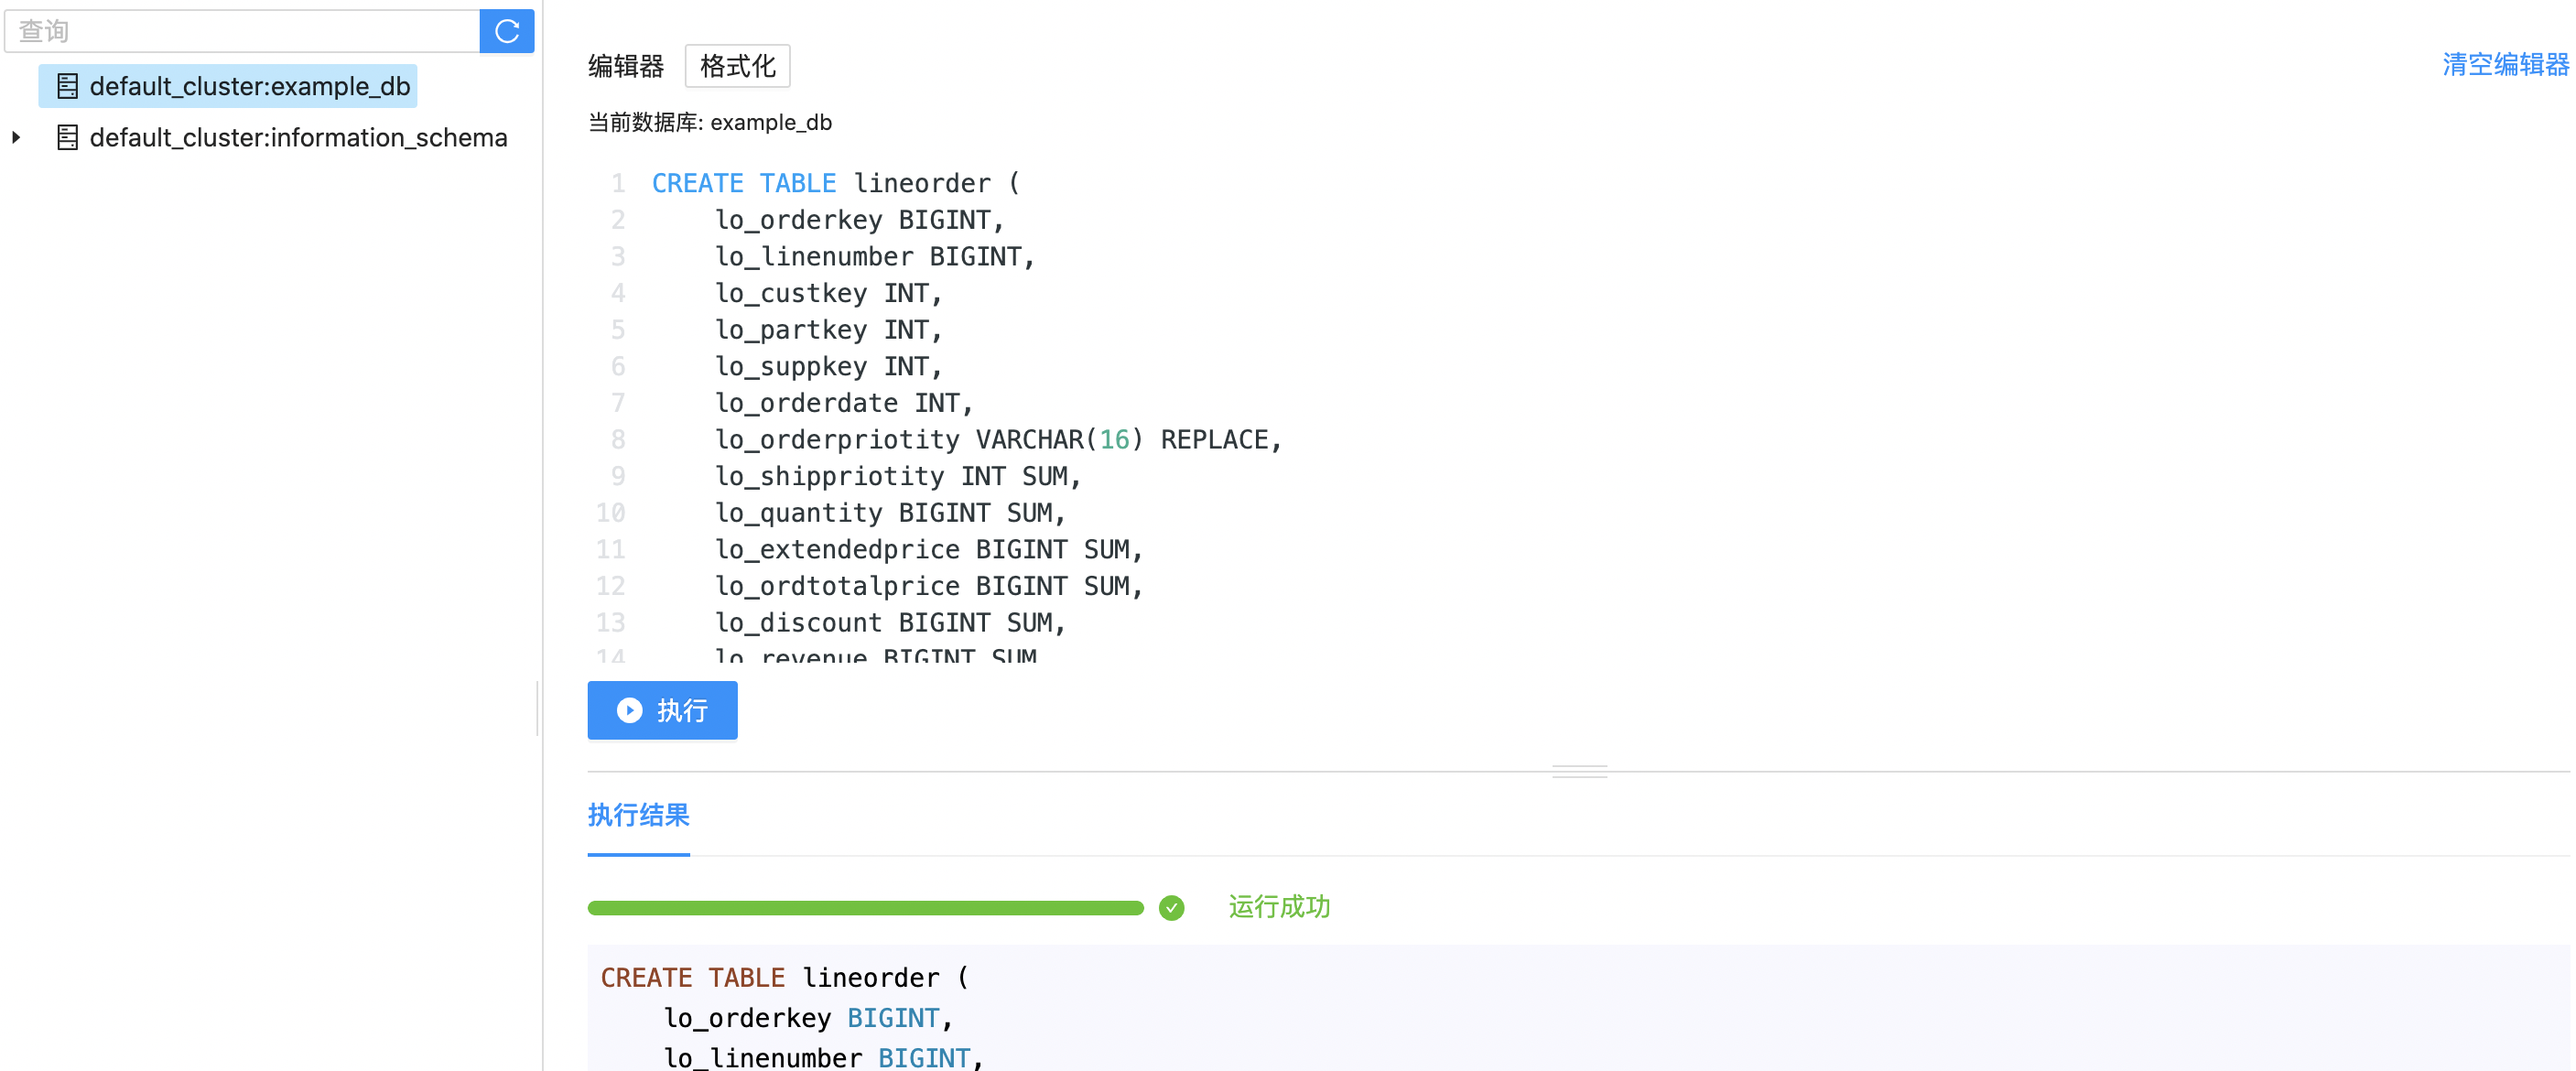
Then we create a date table. Using d_datekey as bucketing column, and set the copy number as 1. This table defines more detailed order date information.
CREATE TABLE date (
    d_datekey INT,
    d_date VARCHAR(20),
    d_dayofweek VARCHAR(10),
    d_month VARCHAR(11),
    d_year INT,
    d_yearmonthnum INT,
    d_yearmonth VARCHAR(9),
    d_daynuminweek INT,
    d_daynuminmonth INT,
    d_daynuminyear INT,
    d_monthnuminyear INT,
    d_weeknuminyear INT,
    d_sellingseason VARCHAR(14),
    d_lastdayinweekfl INT,
    d_lastdayinmonthfl INT,
    d_holidayfl INT,
    d_weekdayfl INT
) DISTRIBUTED BY hash(d_datekey) PROPERTIES (
  "storage_type"="column",
  "replication_num"="1");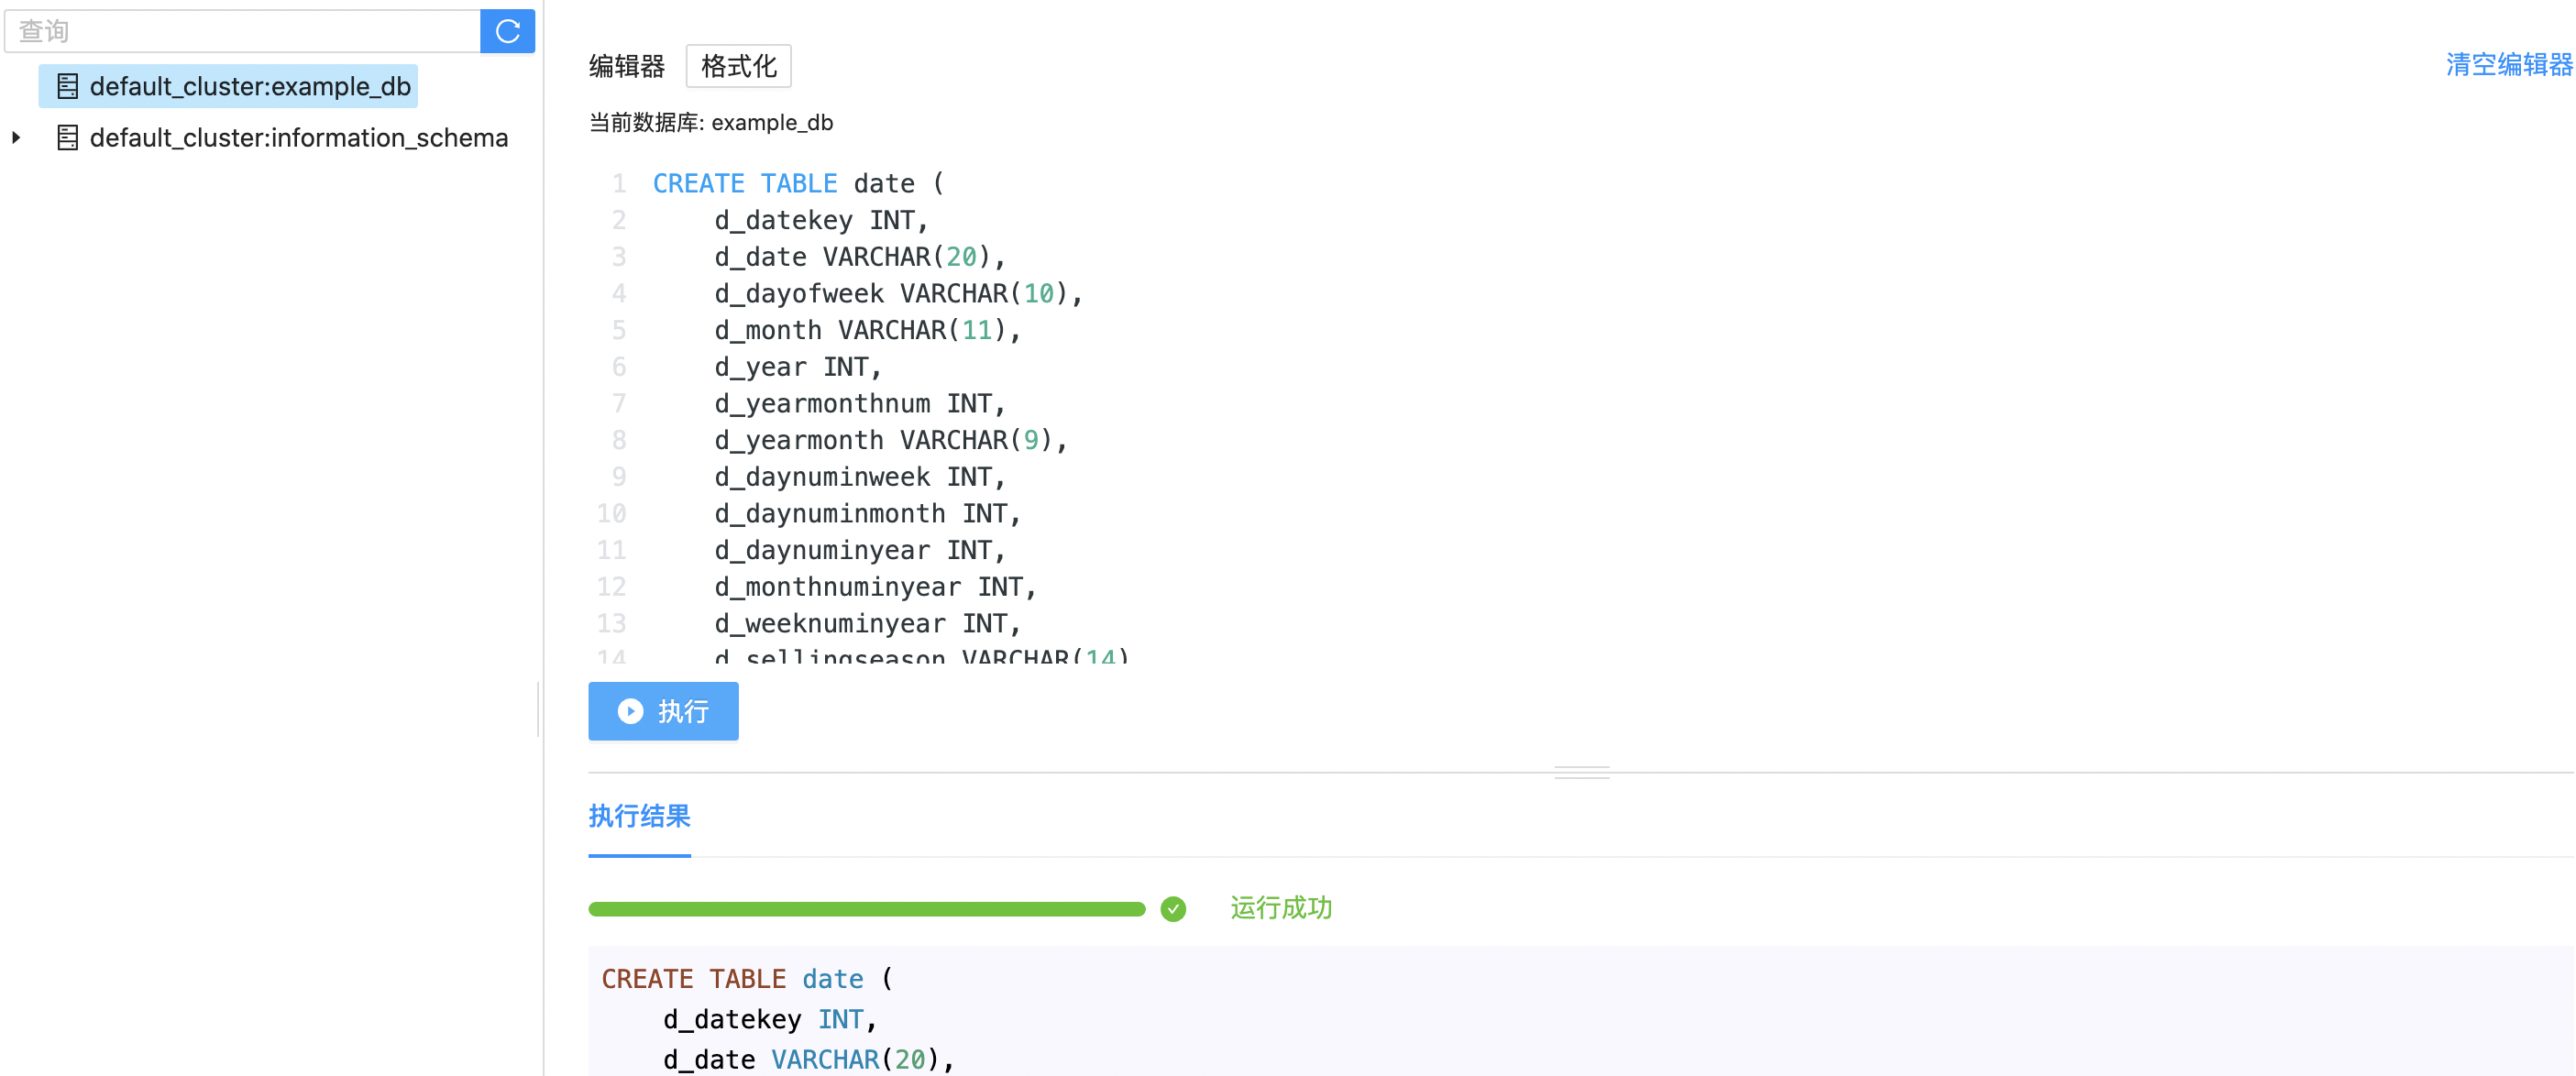
Next, we create the remaining three tables, customer,part,supplier which record the detailed information of customers, goods and suppliers respectively.
CREATE TABLE customer (
c_custkey INT,
c_name VARCHAR(26),
c_address VARCHAR(41),
c_city VARCHAR(11),
c_nation VARCHAR(16),
c_region VARCHAR(13),
c_phone VARCHAR(16),
c_mktsegment VARCHAR(11) )
DISTRIBUTED BY hash(c_custkey)
PROPERTIES (
"storage_type"="column",
"replication_num"="1");
CREATE TABLE part (
p_partkey INT,
p_name VARCHAR(23),
p_mfgr VARCHAR(7),
p_category VARCHAR(8),
p_brand VARCHAR(10),
p_color VARCHAR(12),
p_type VARCHAR(26),
p_size INT,
p_container VARCHAR(11) )
DISTRIBUTED BY hash(p_partkey)
PROPERTIES (
"storage_type"="column",
"replication_num"="1");
CREATE TABLE supplier (
s_suppkey INT,
s_name VARCHAR(26),
s_address VARCHAR(26),
s_city VARCHAR(11),
s_nation VARCHAR(16),
s_region VARCHAR(13),
s_phone VARCHAR(16) )
DISTRIBUTED BY hash(s_suppkey)
PROPERTIES (
"storage_type"="column",
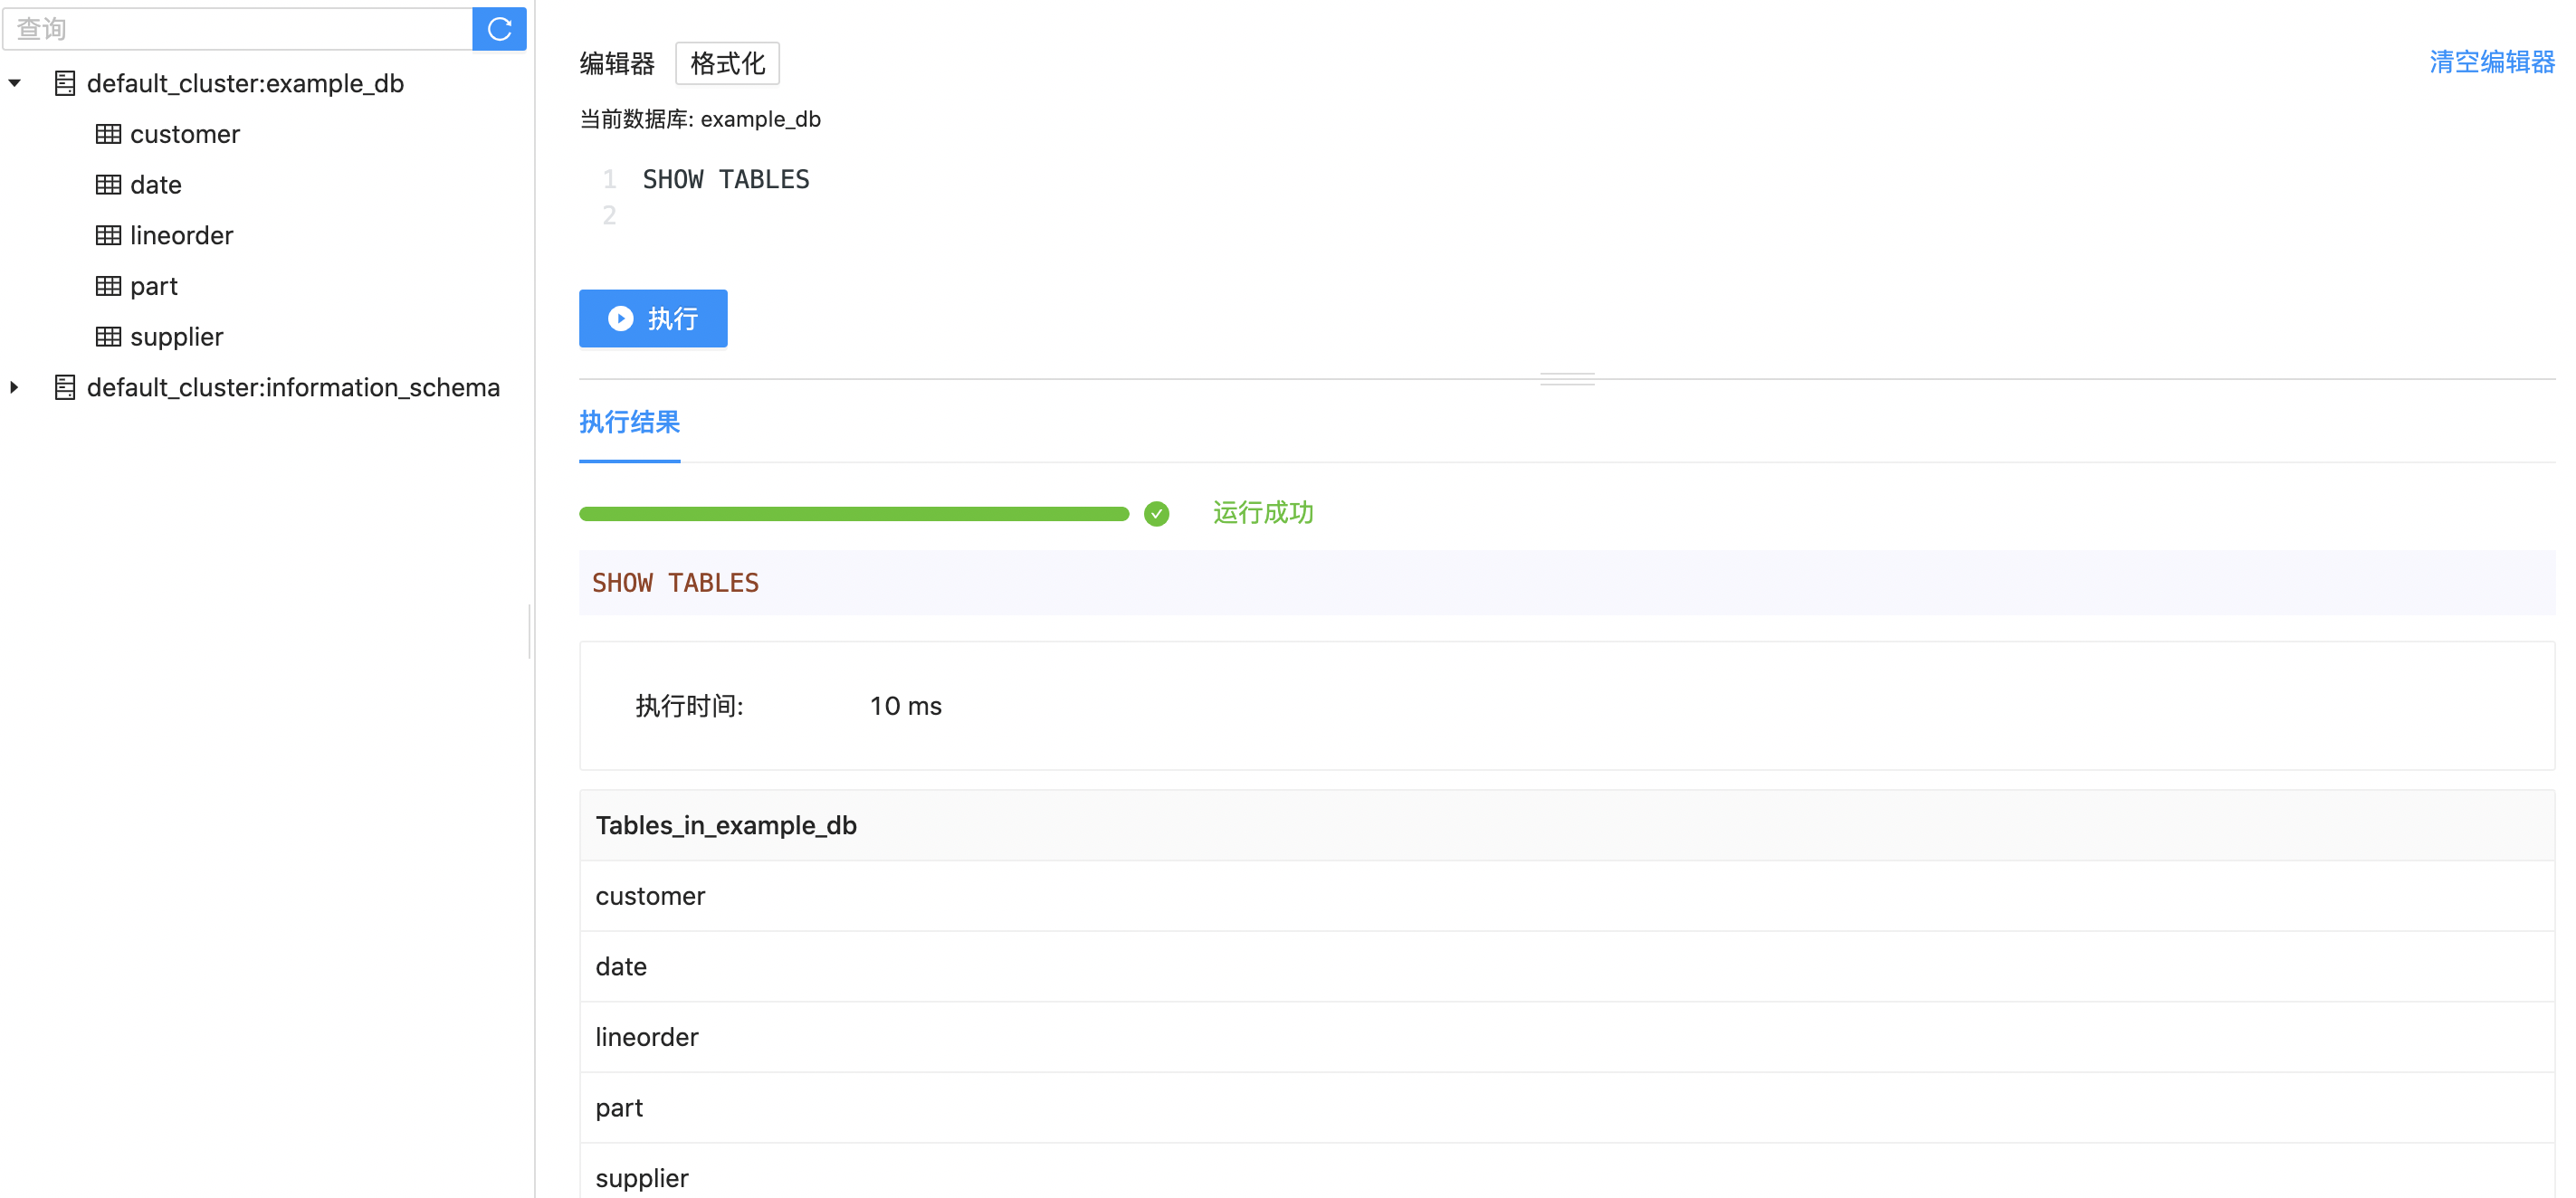
"replication_num"="1");After the table is built, you can view the information of the table in example_db:
Import data
Palo supports multiple data import methods. For details, refer to data import document. Here, we use Web to import data conveniently as an example.
First, click to Select the table to import data
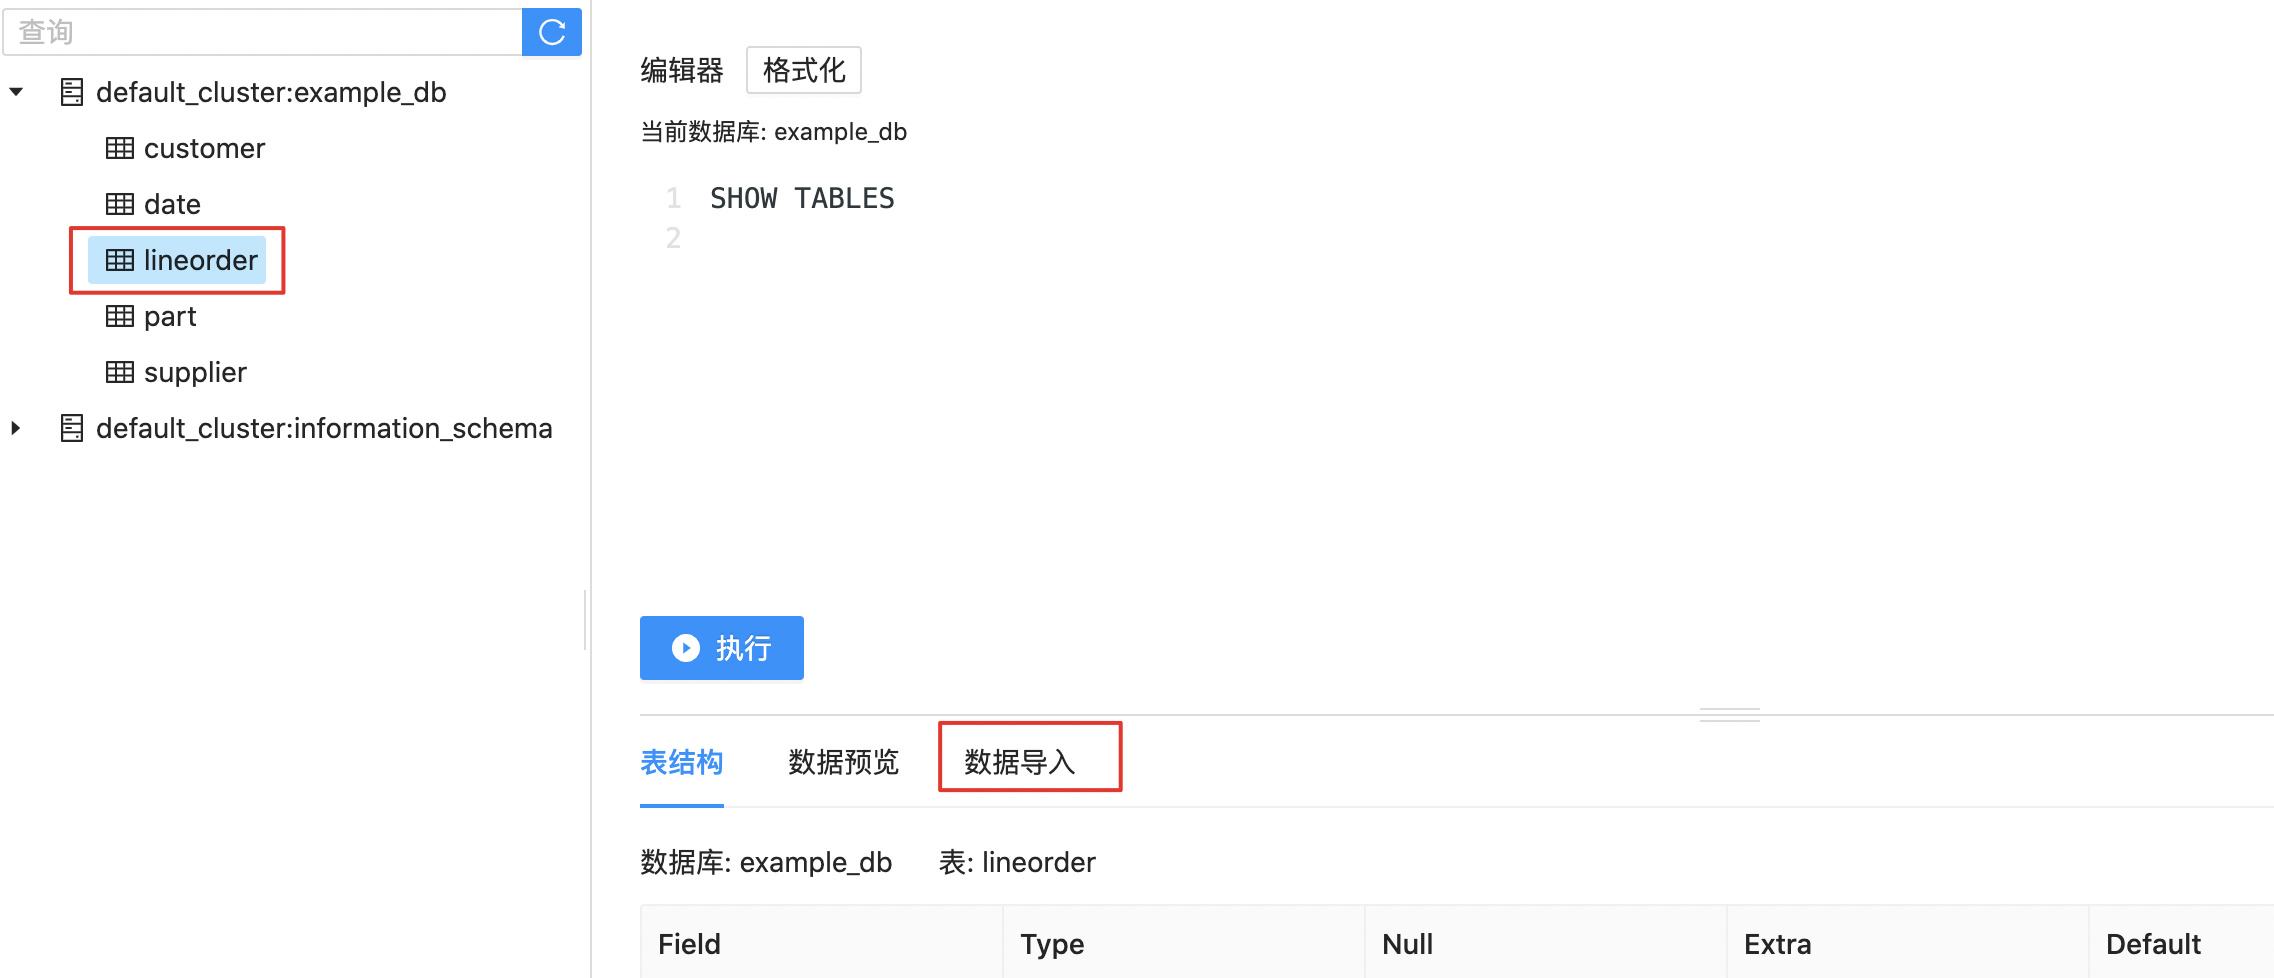
Then click Data Import to enter the data import page
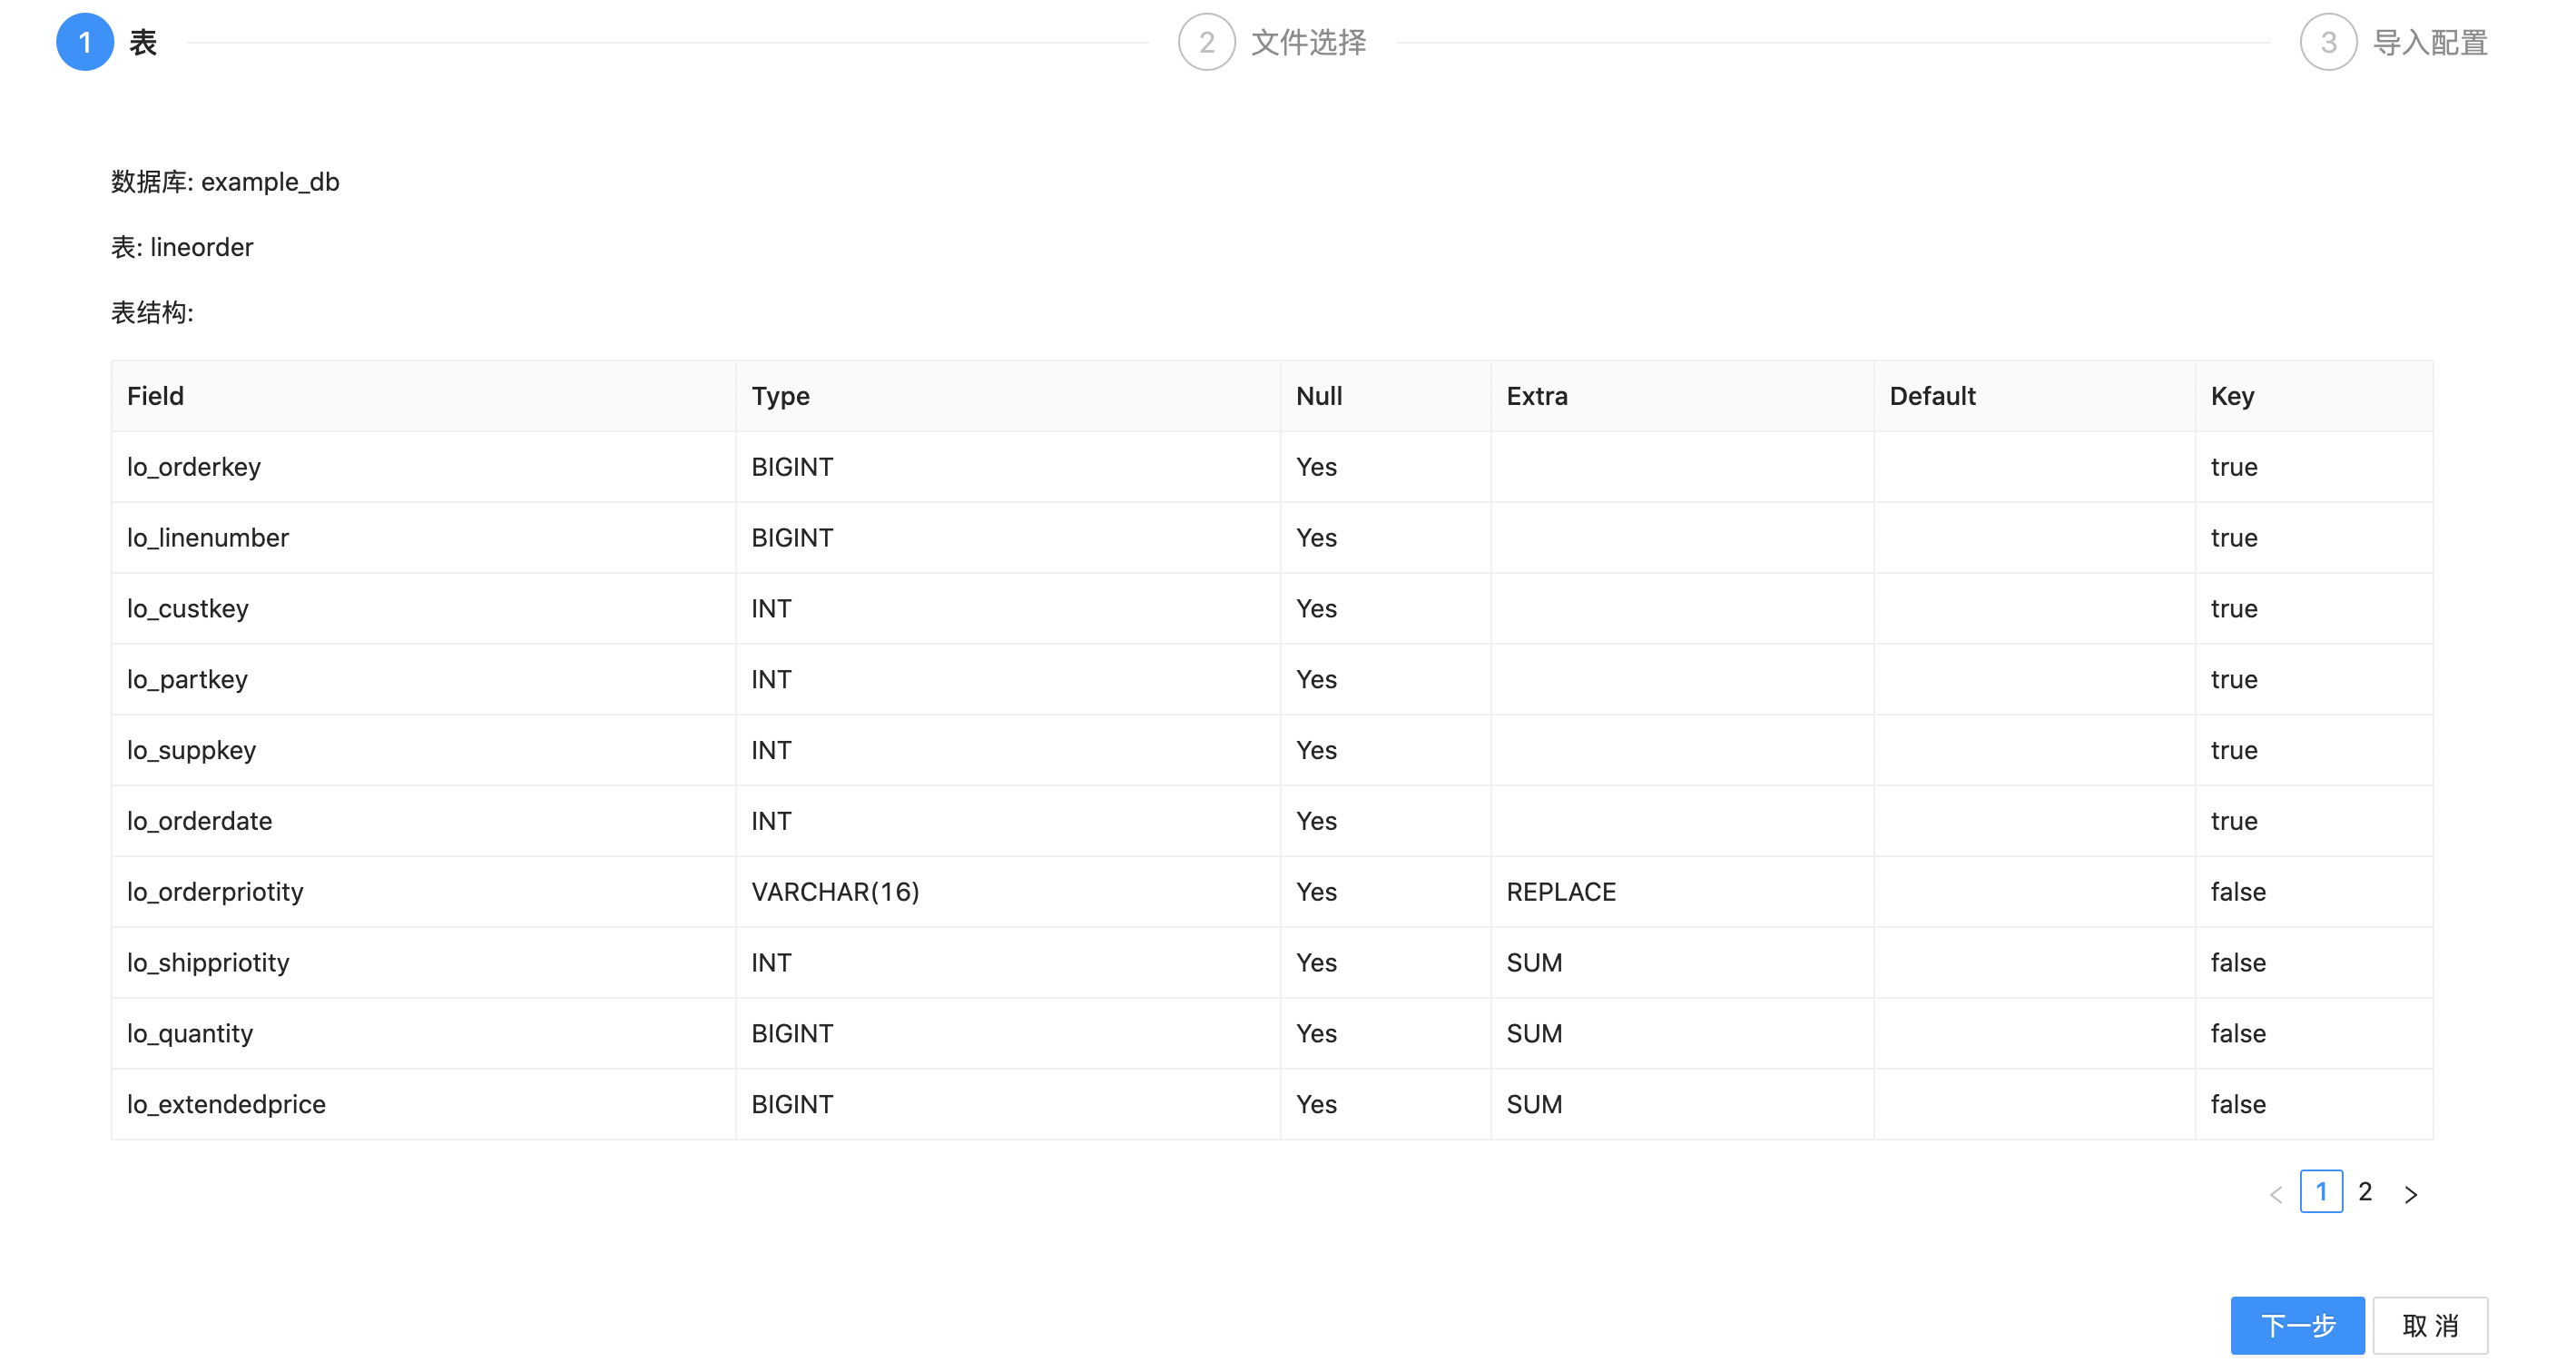
Click "Next". Select the column separator of the imported file, here we use \t . Then select the data file to import
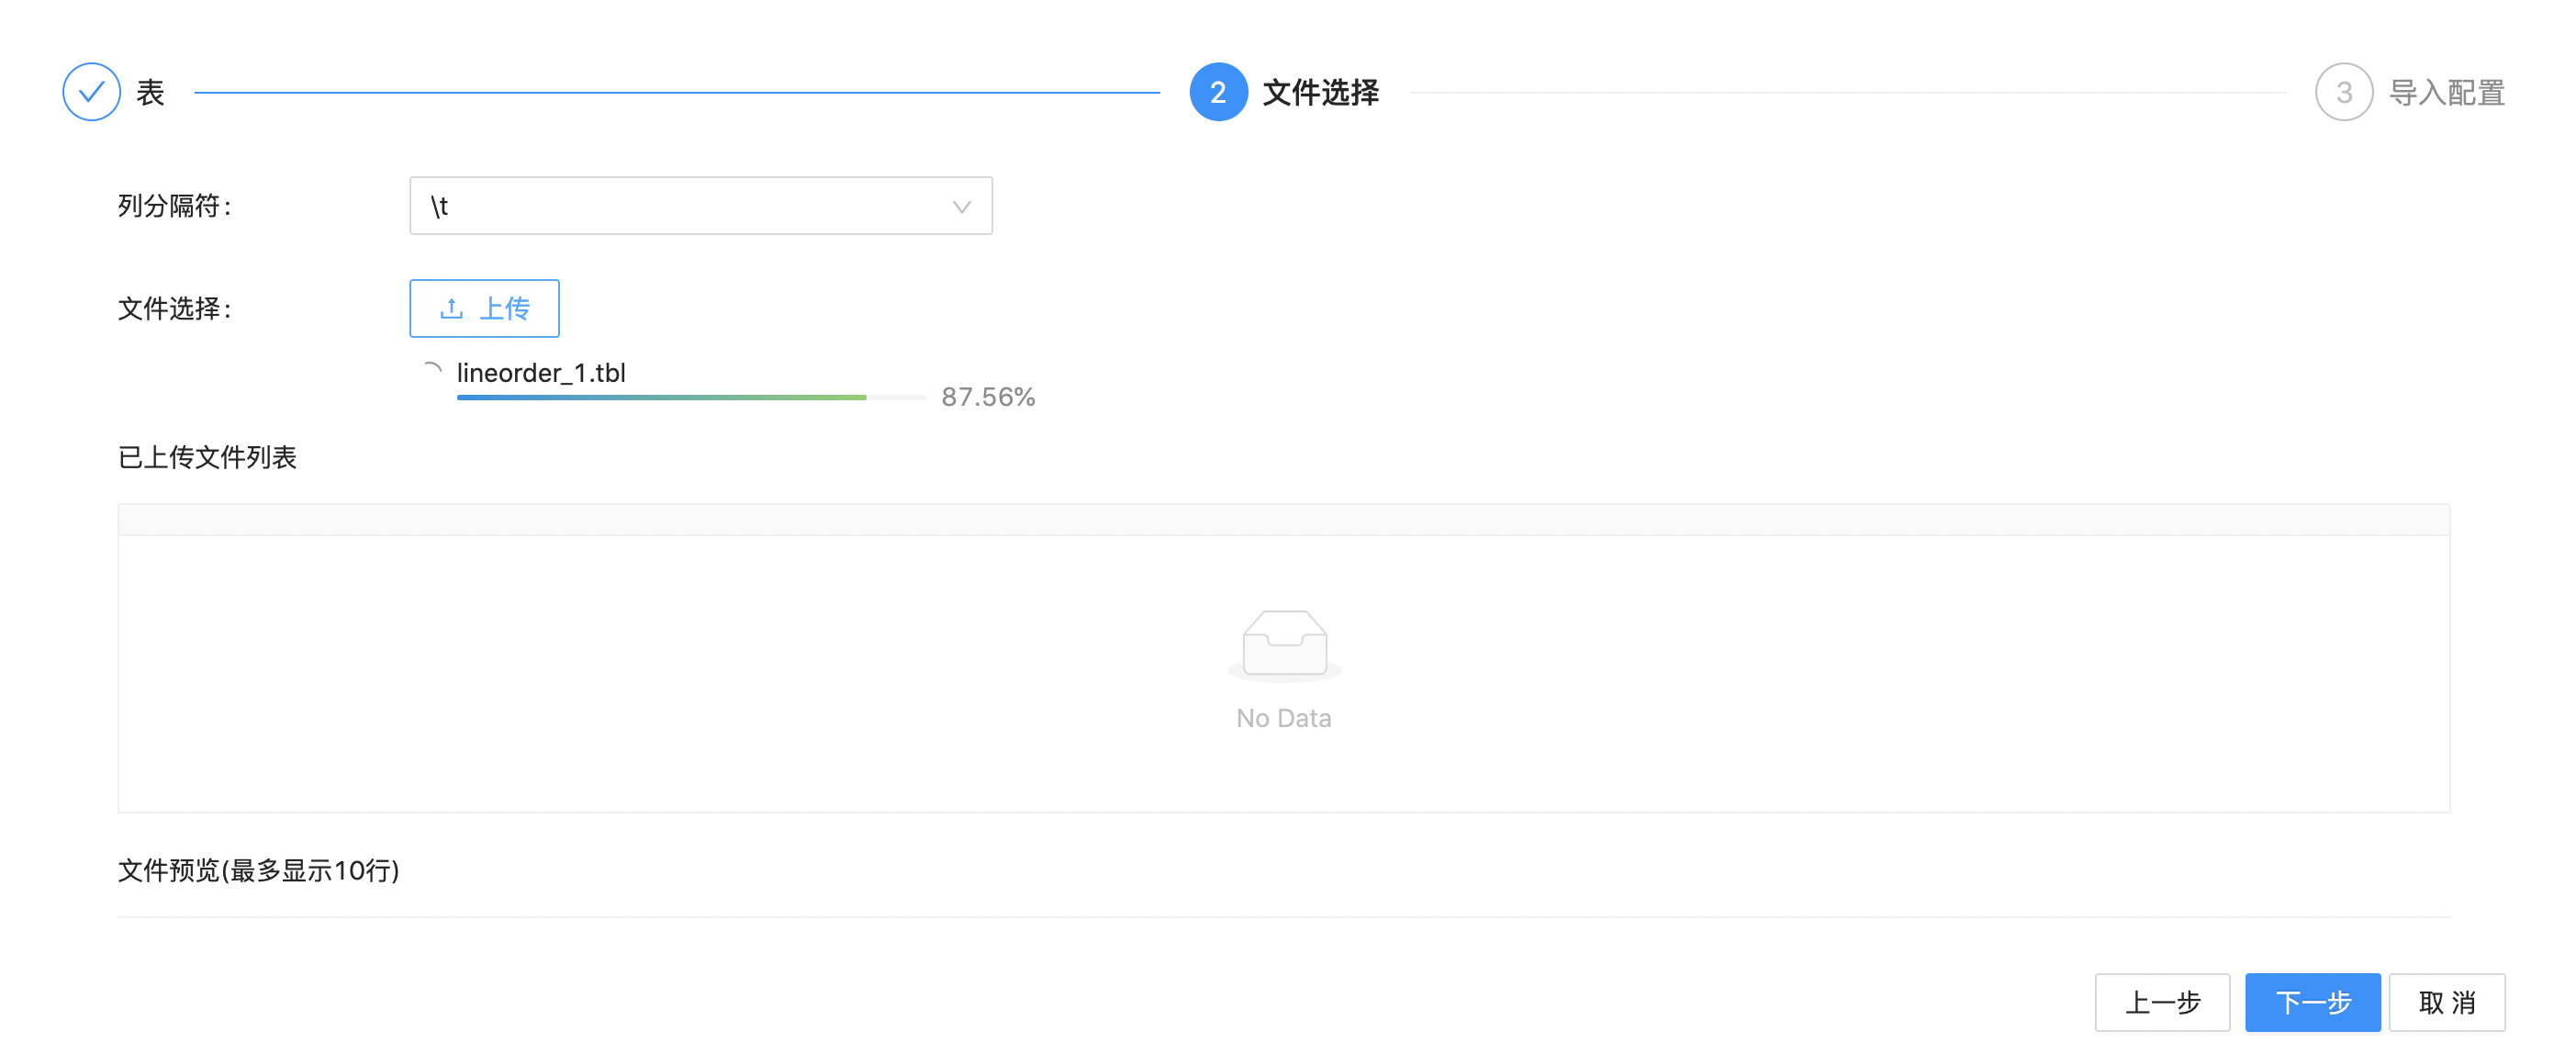
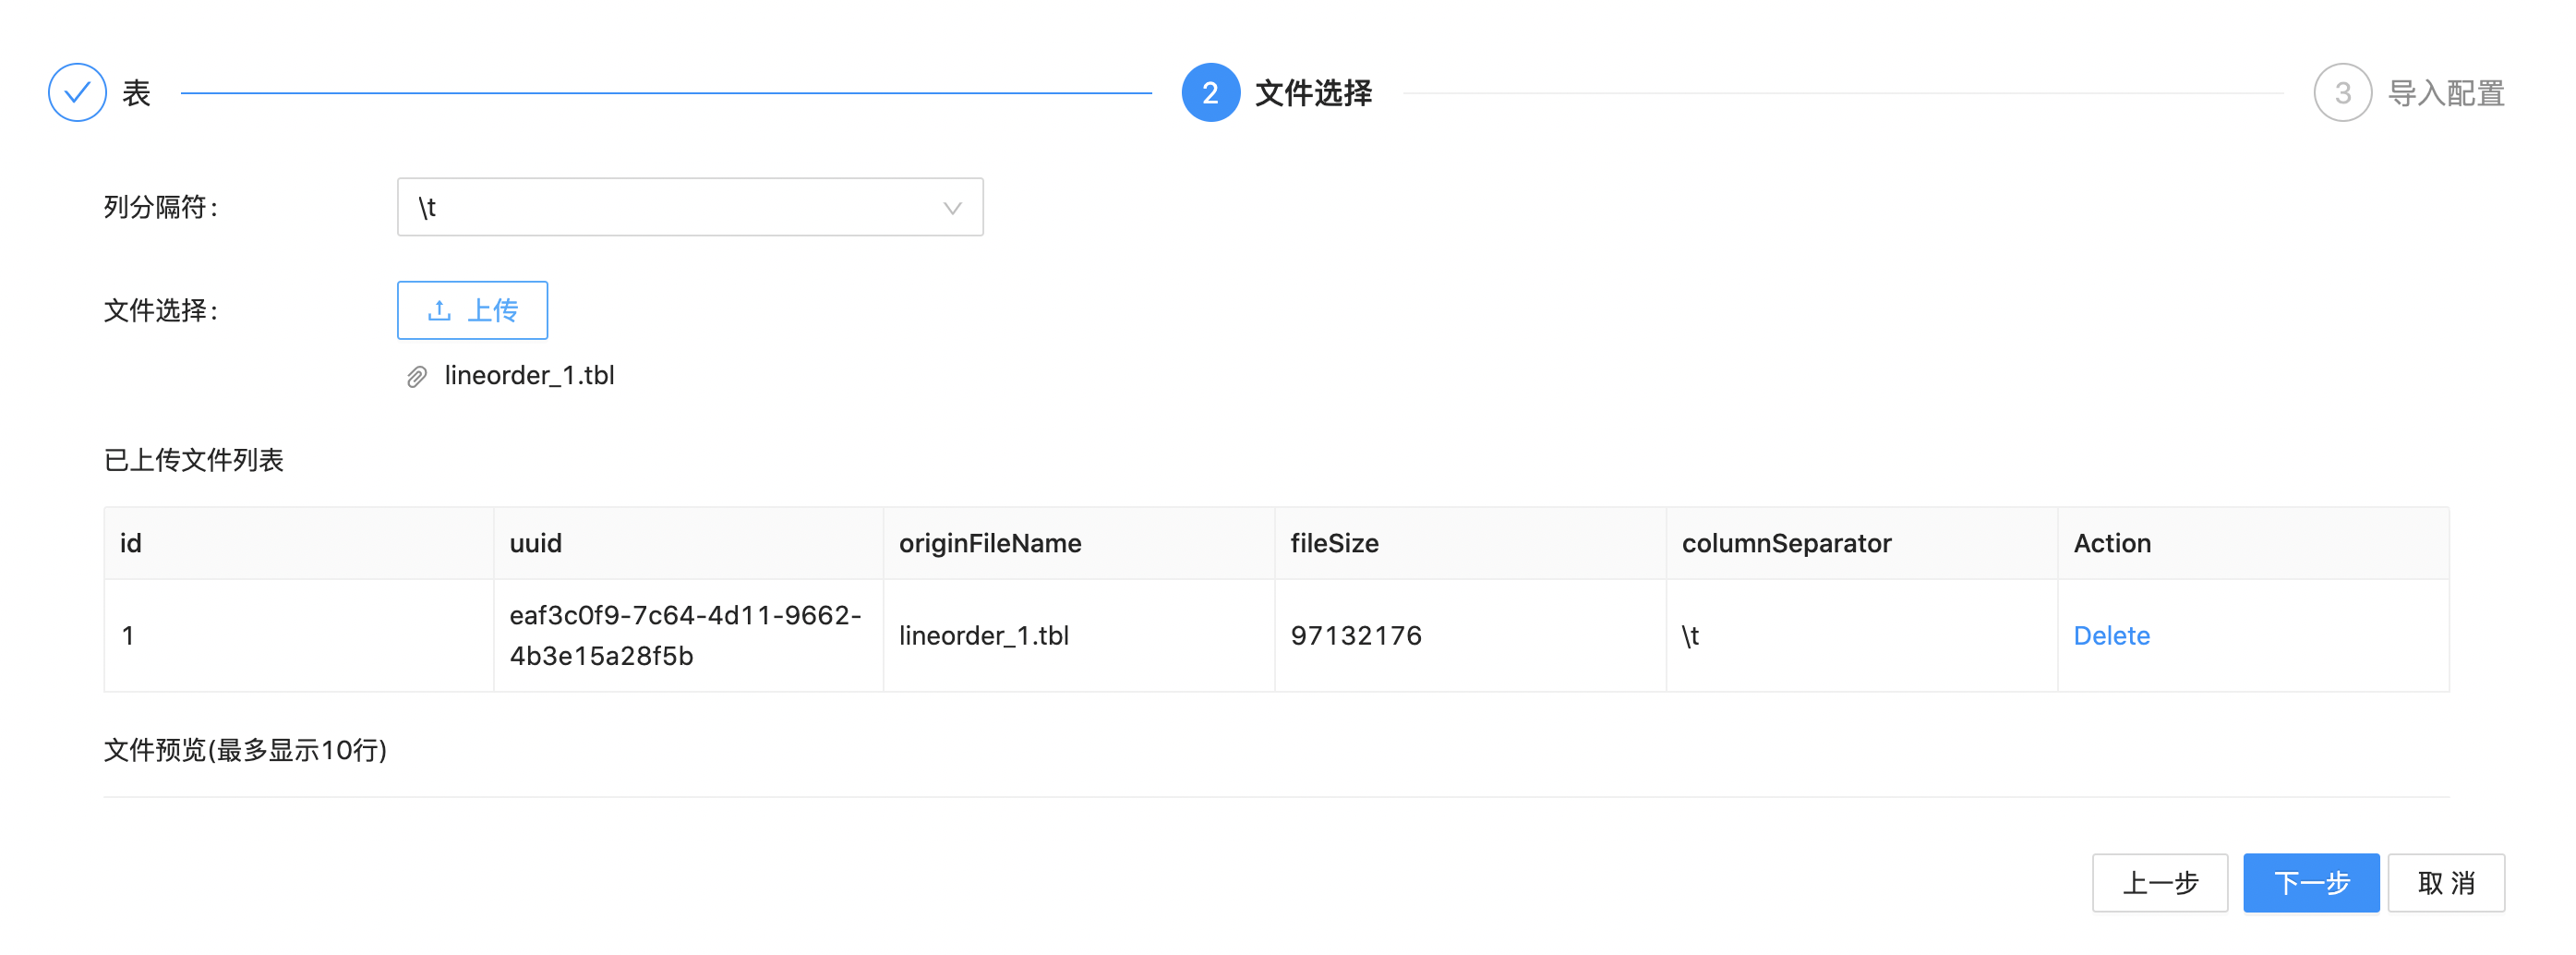
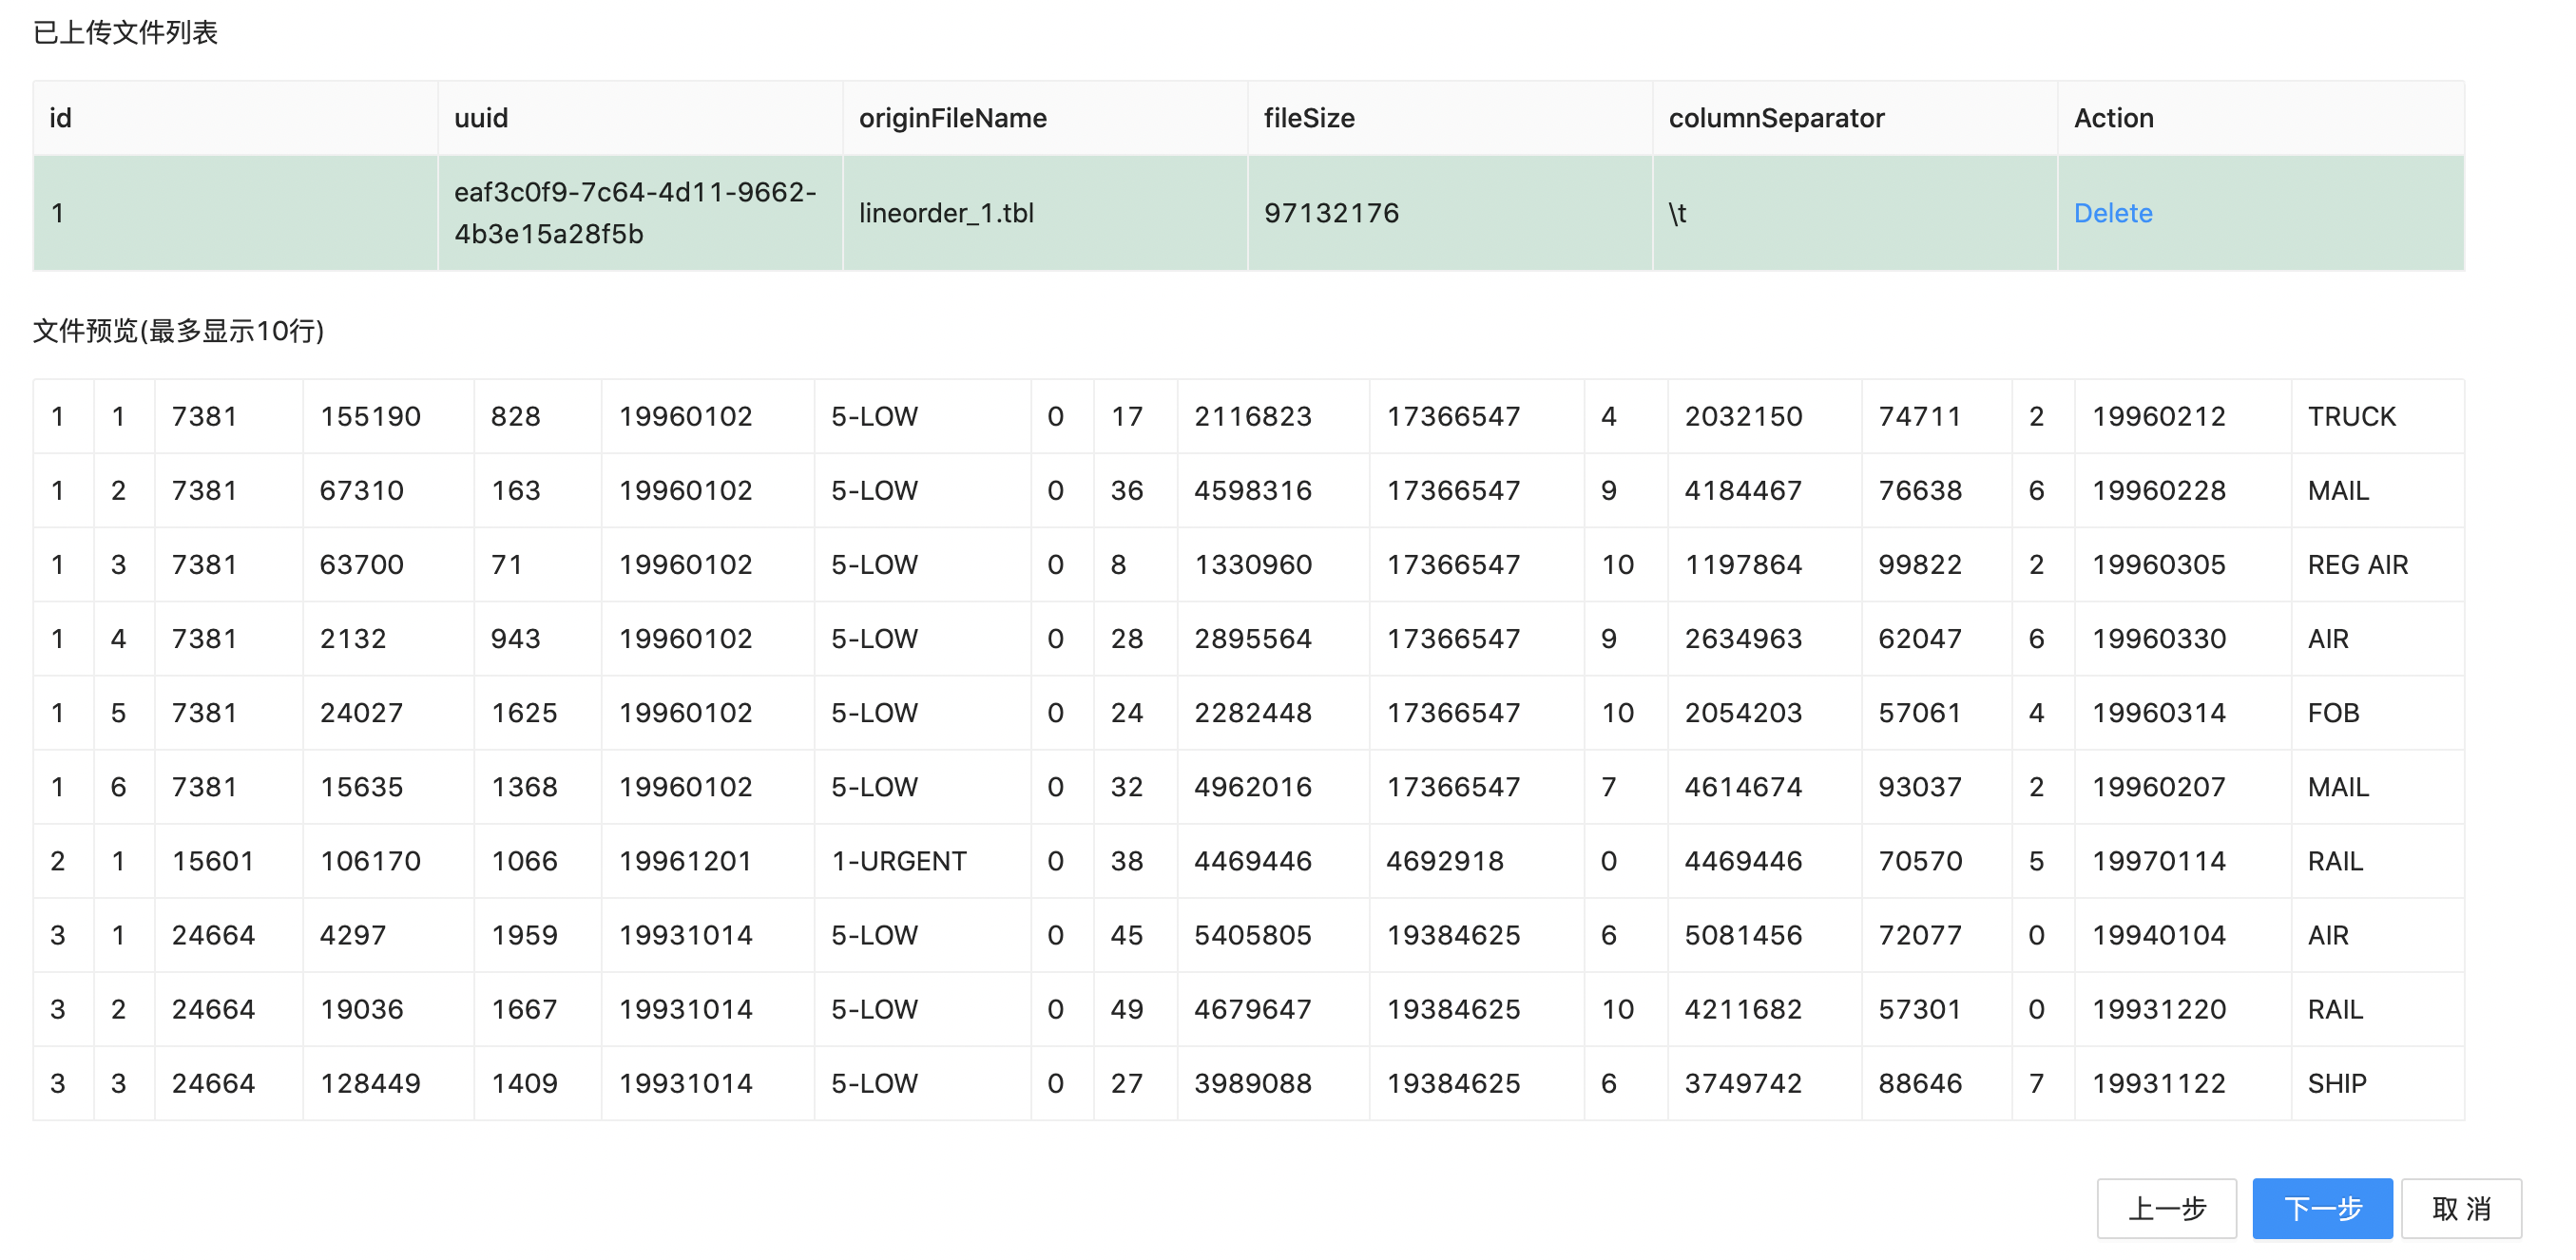
Wait for the file loading, then click to select the uploaded file below. Then the preview of the file data separated by specified separator (first 10 lines) will be displayed.
Click "Next" to enter the data import configuration page. We use "lineorder_data" as label, and then click "import" button.
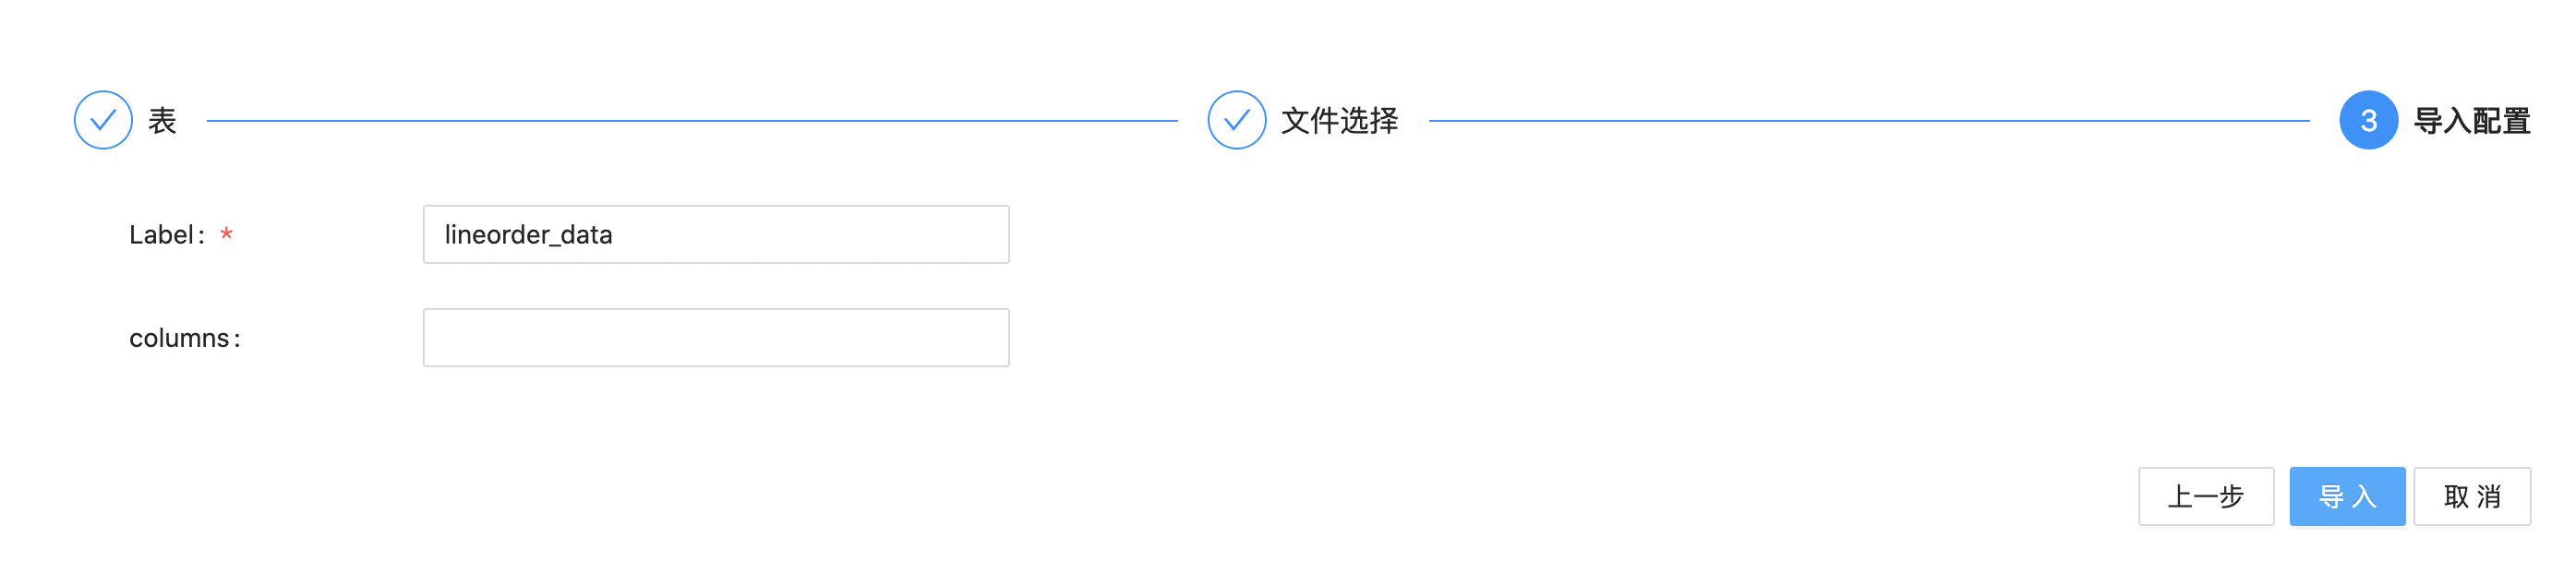
Wait for a moment, then the result of data import will be displayed. In which, the Status will change to Success, indicating that the import is successful. After clicking "OK", the data import is completed.
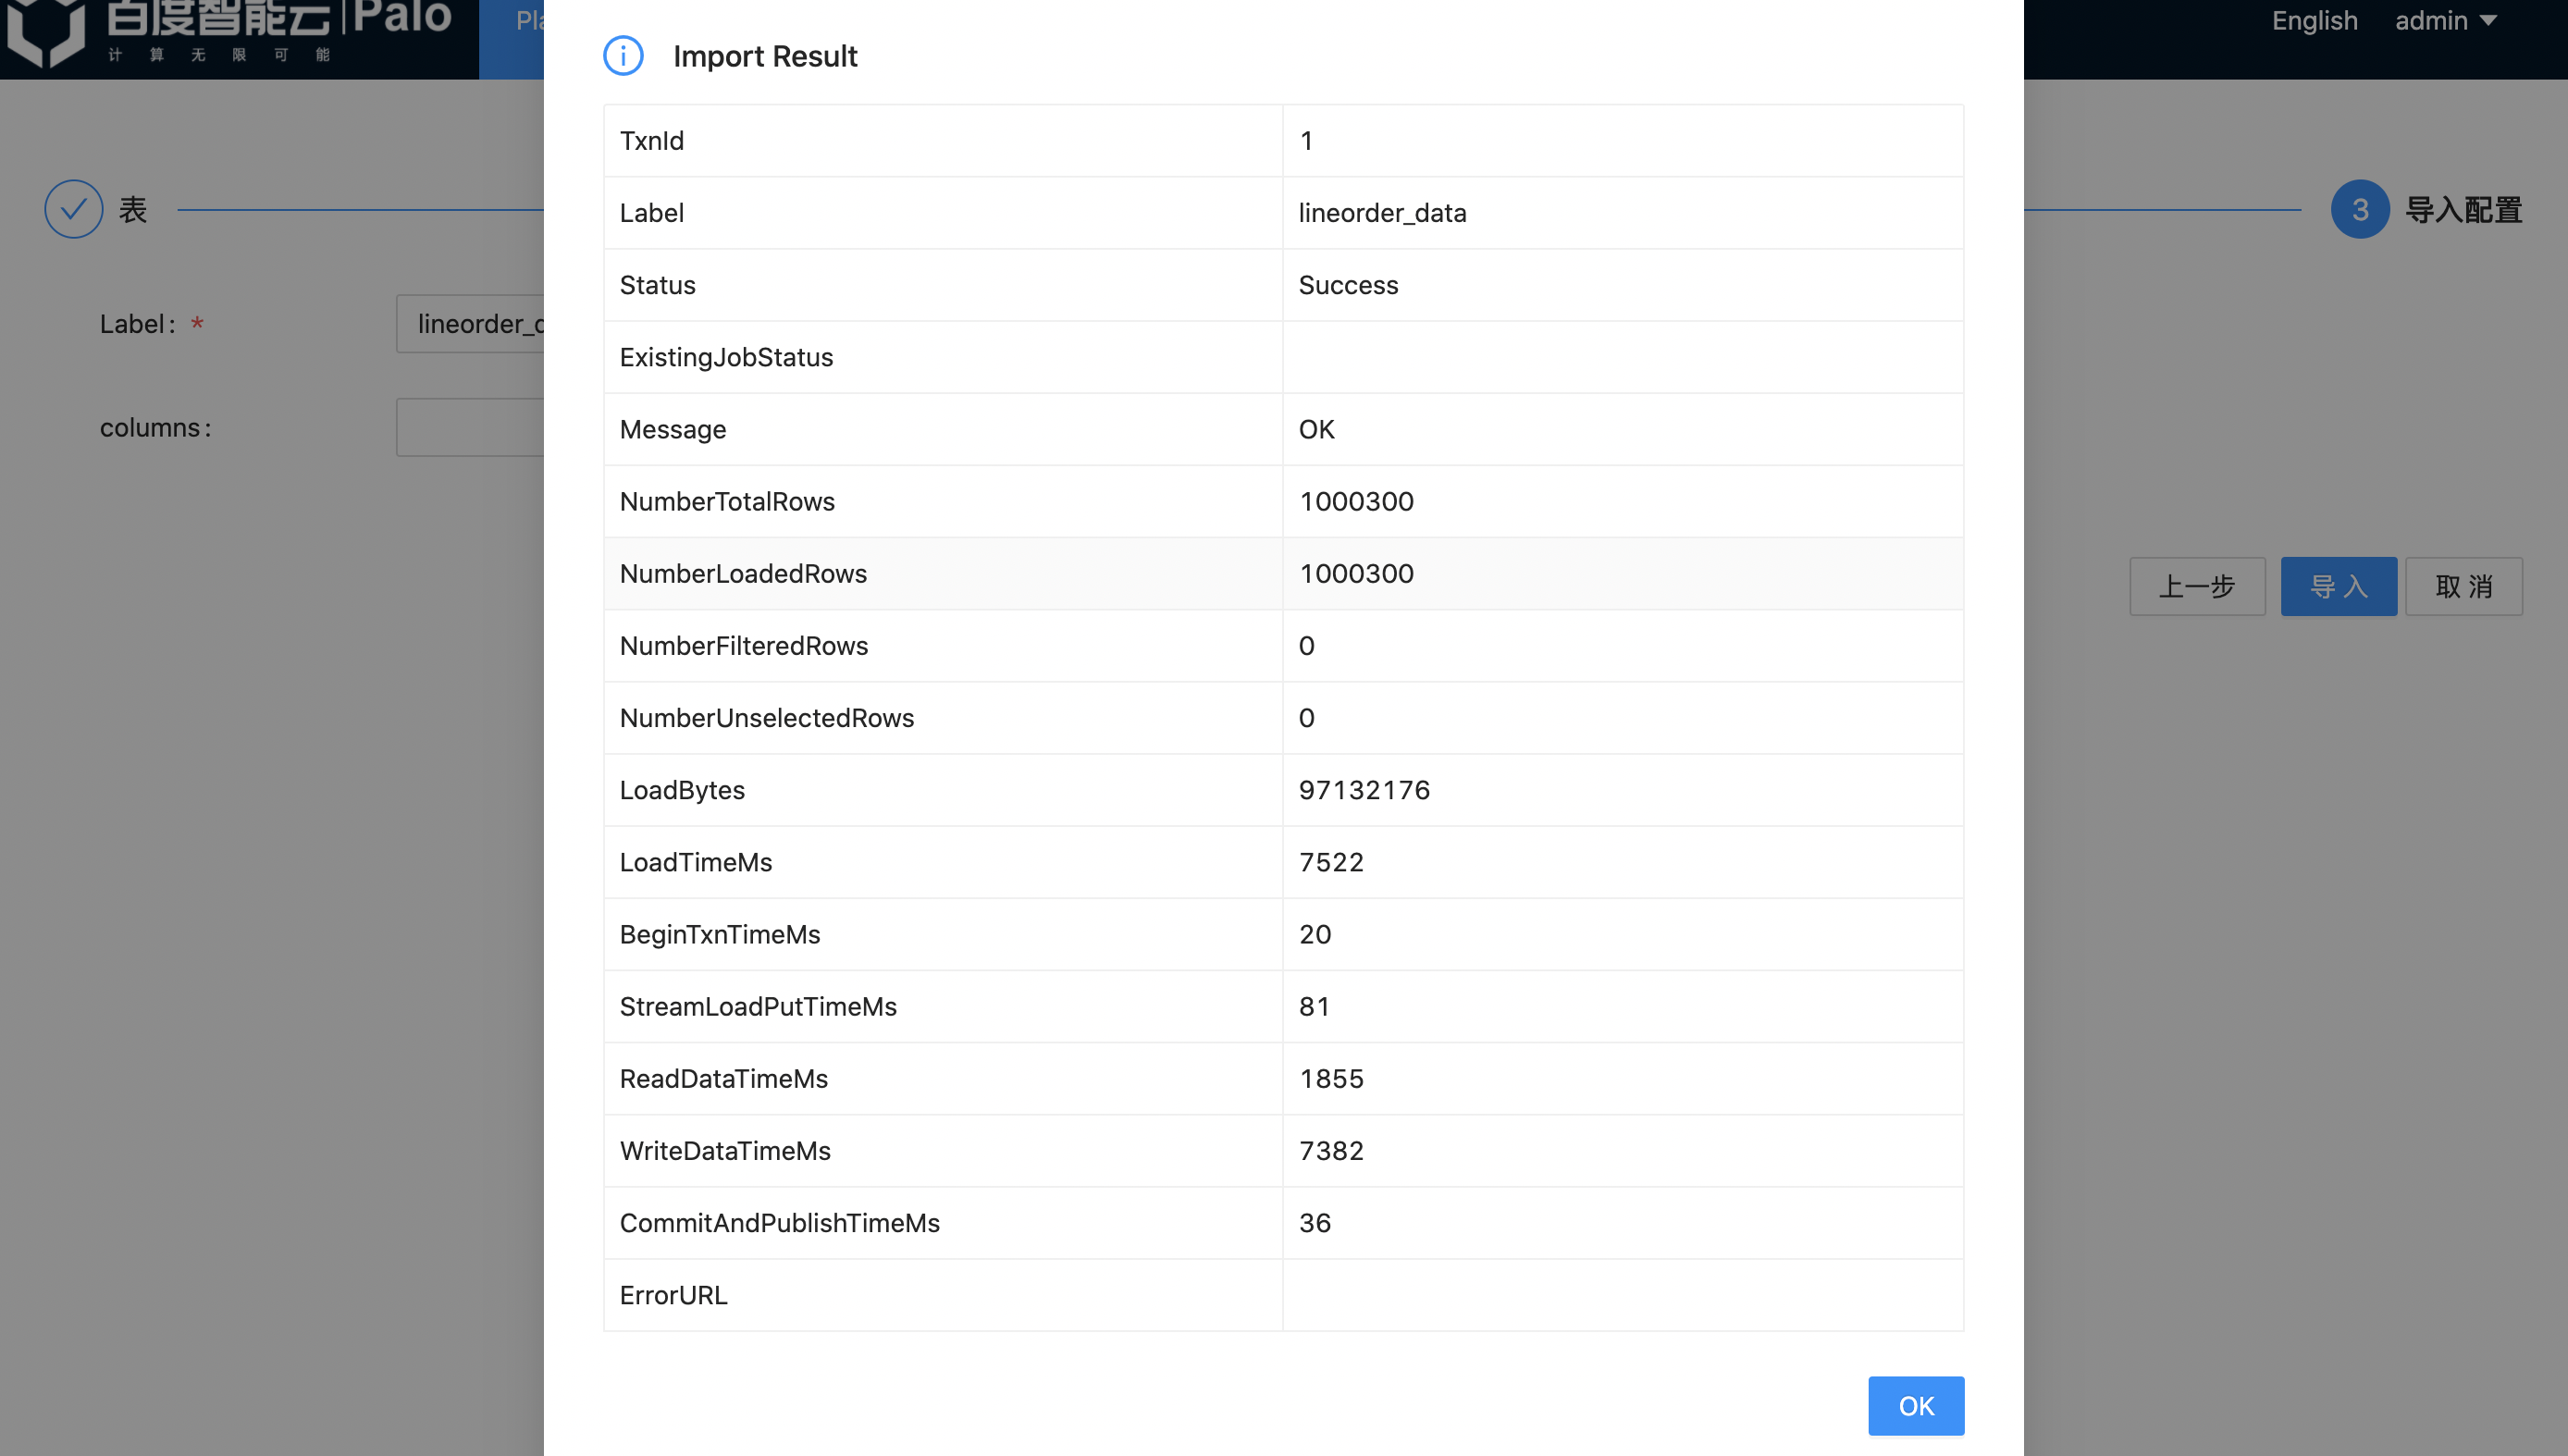
As the size of data imported by Web UI is limited, we divide the complete lineorder data into six copies, here we only import one copy of data as a demonstration and put complete data samples in the demo files, users can add and import all the data according to the test requirements.
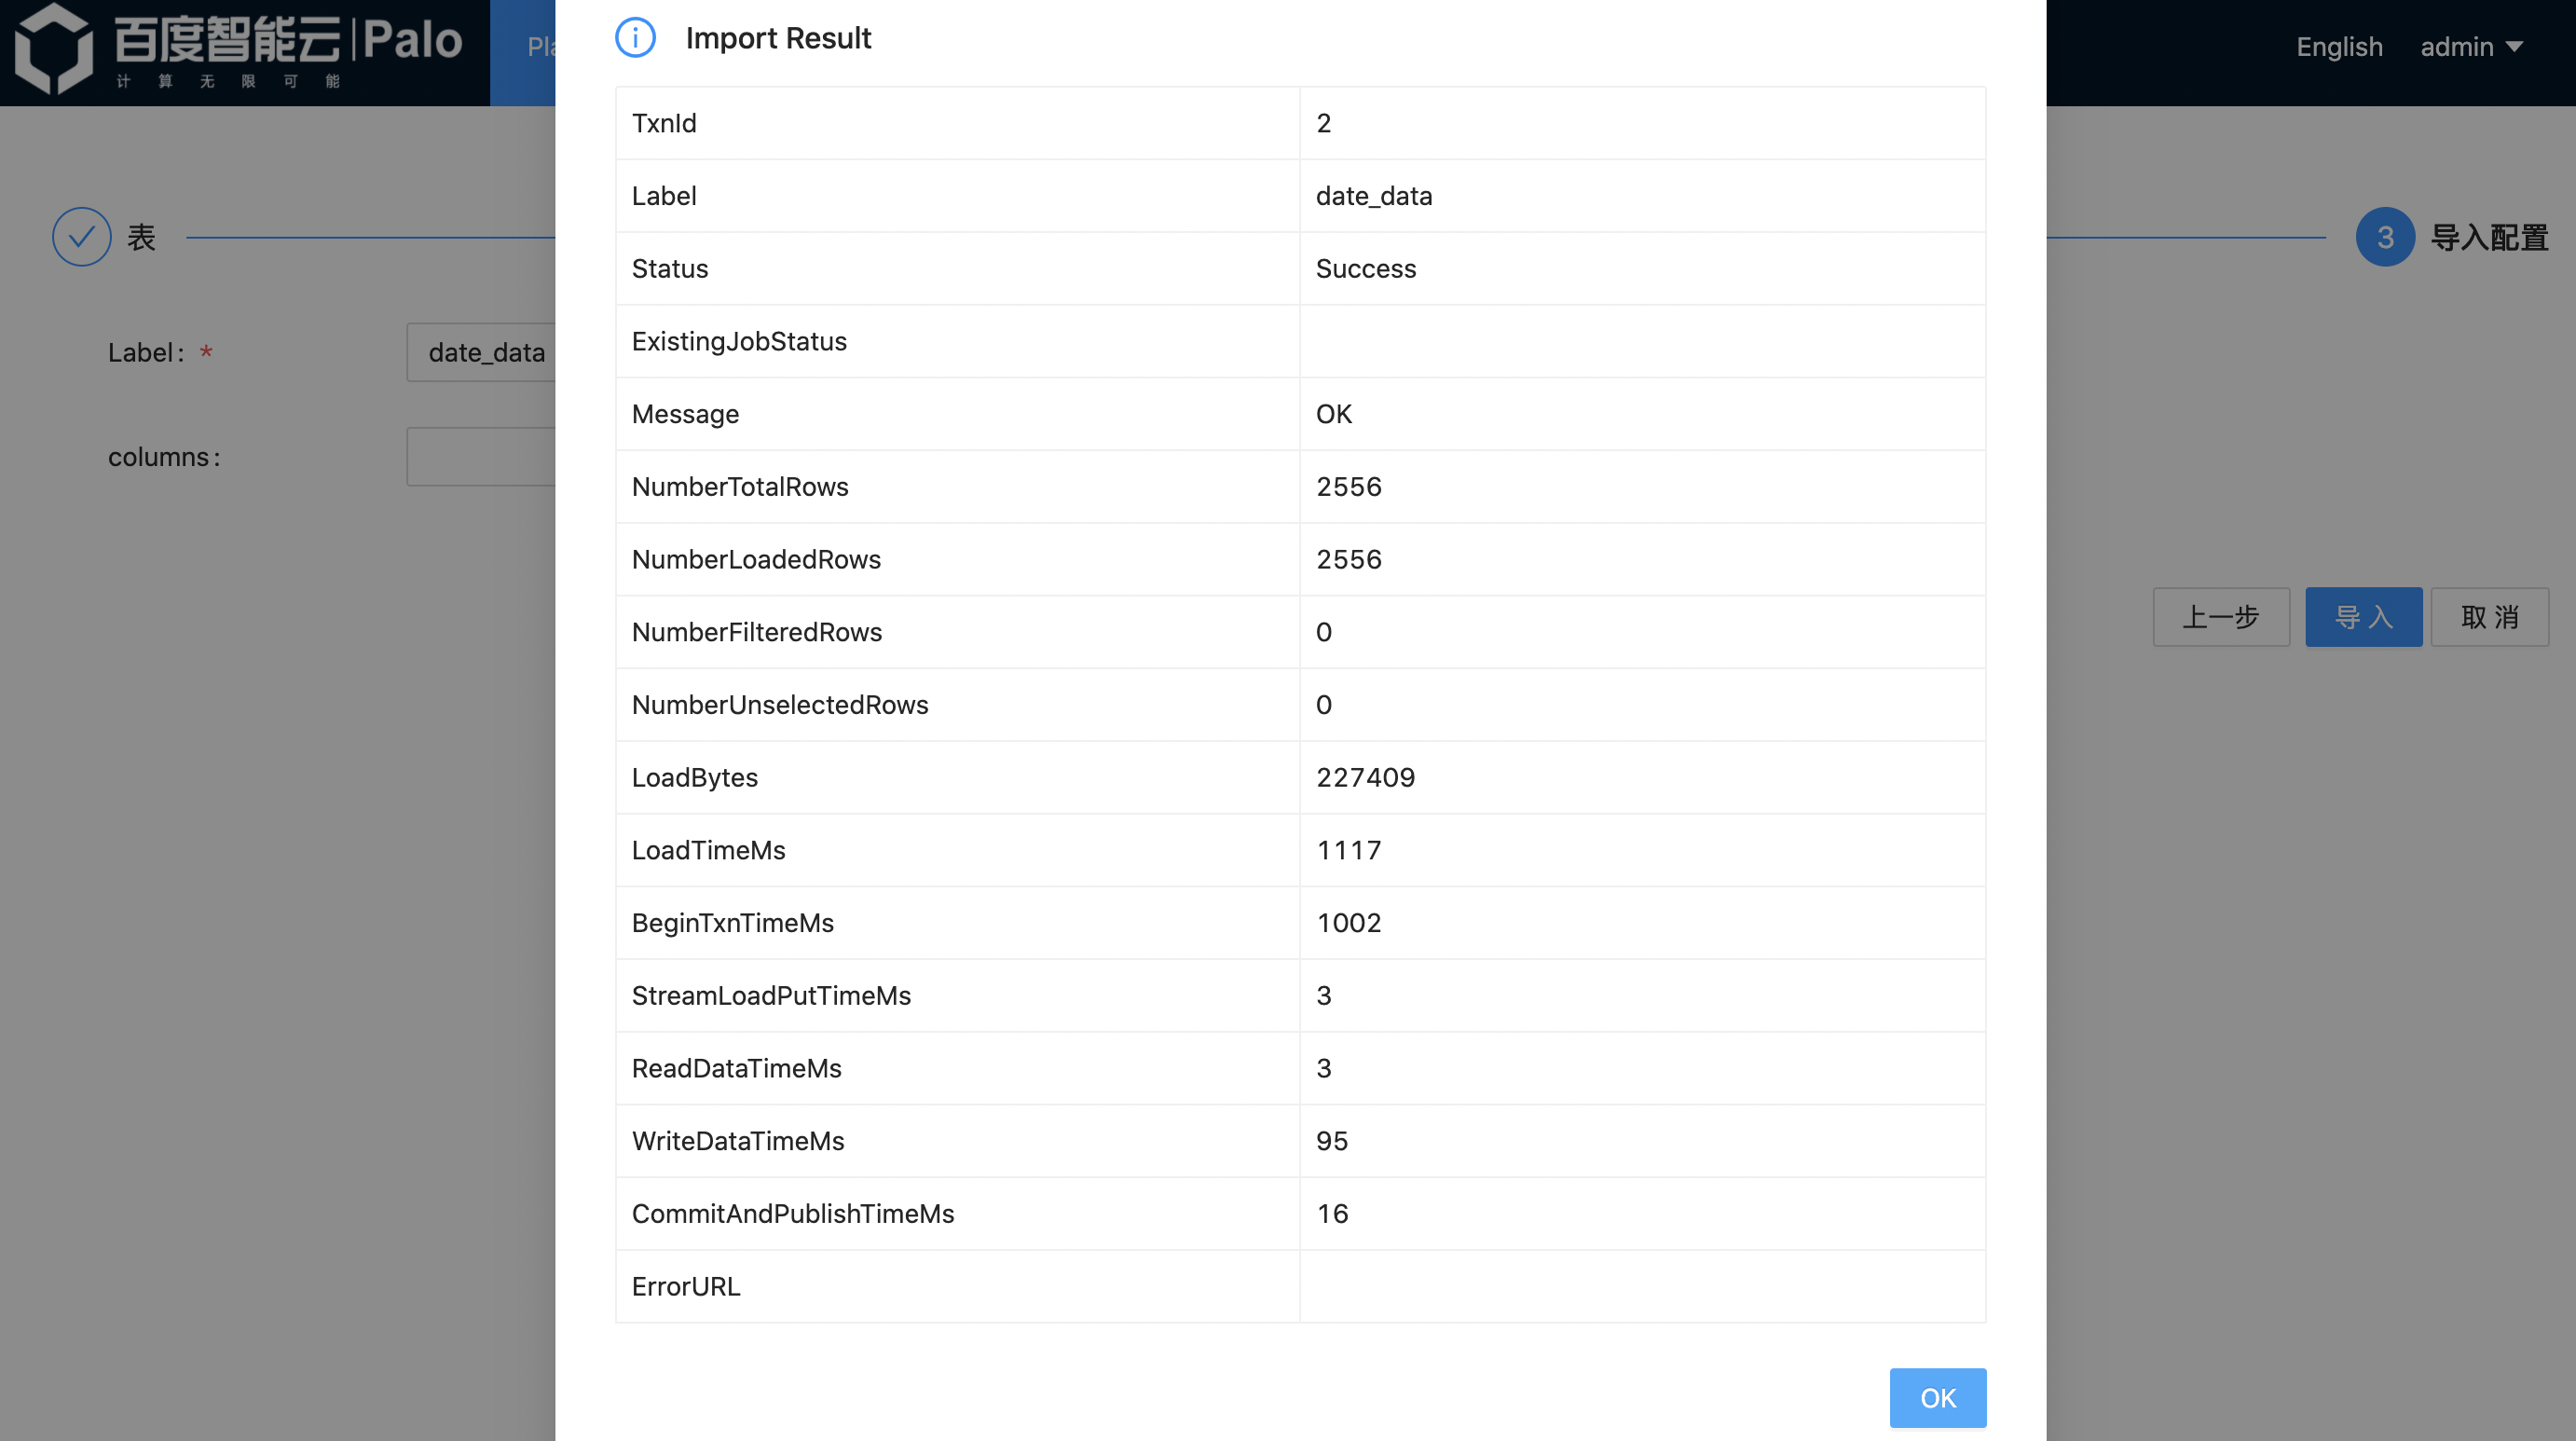
The data corresponding to tablesdate, customer, part, supplier are imported in the same way.
Data Query
Simple search
After the data import is completed, we can execute some query statements to check the status of the data.
Part of data in the table can be previewed.
SELECT * FROM lineorder limit 10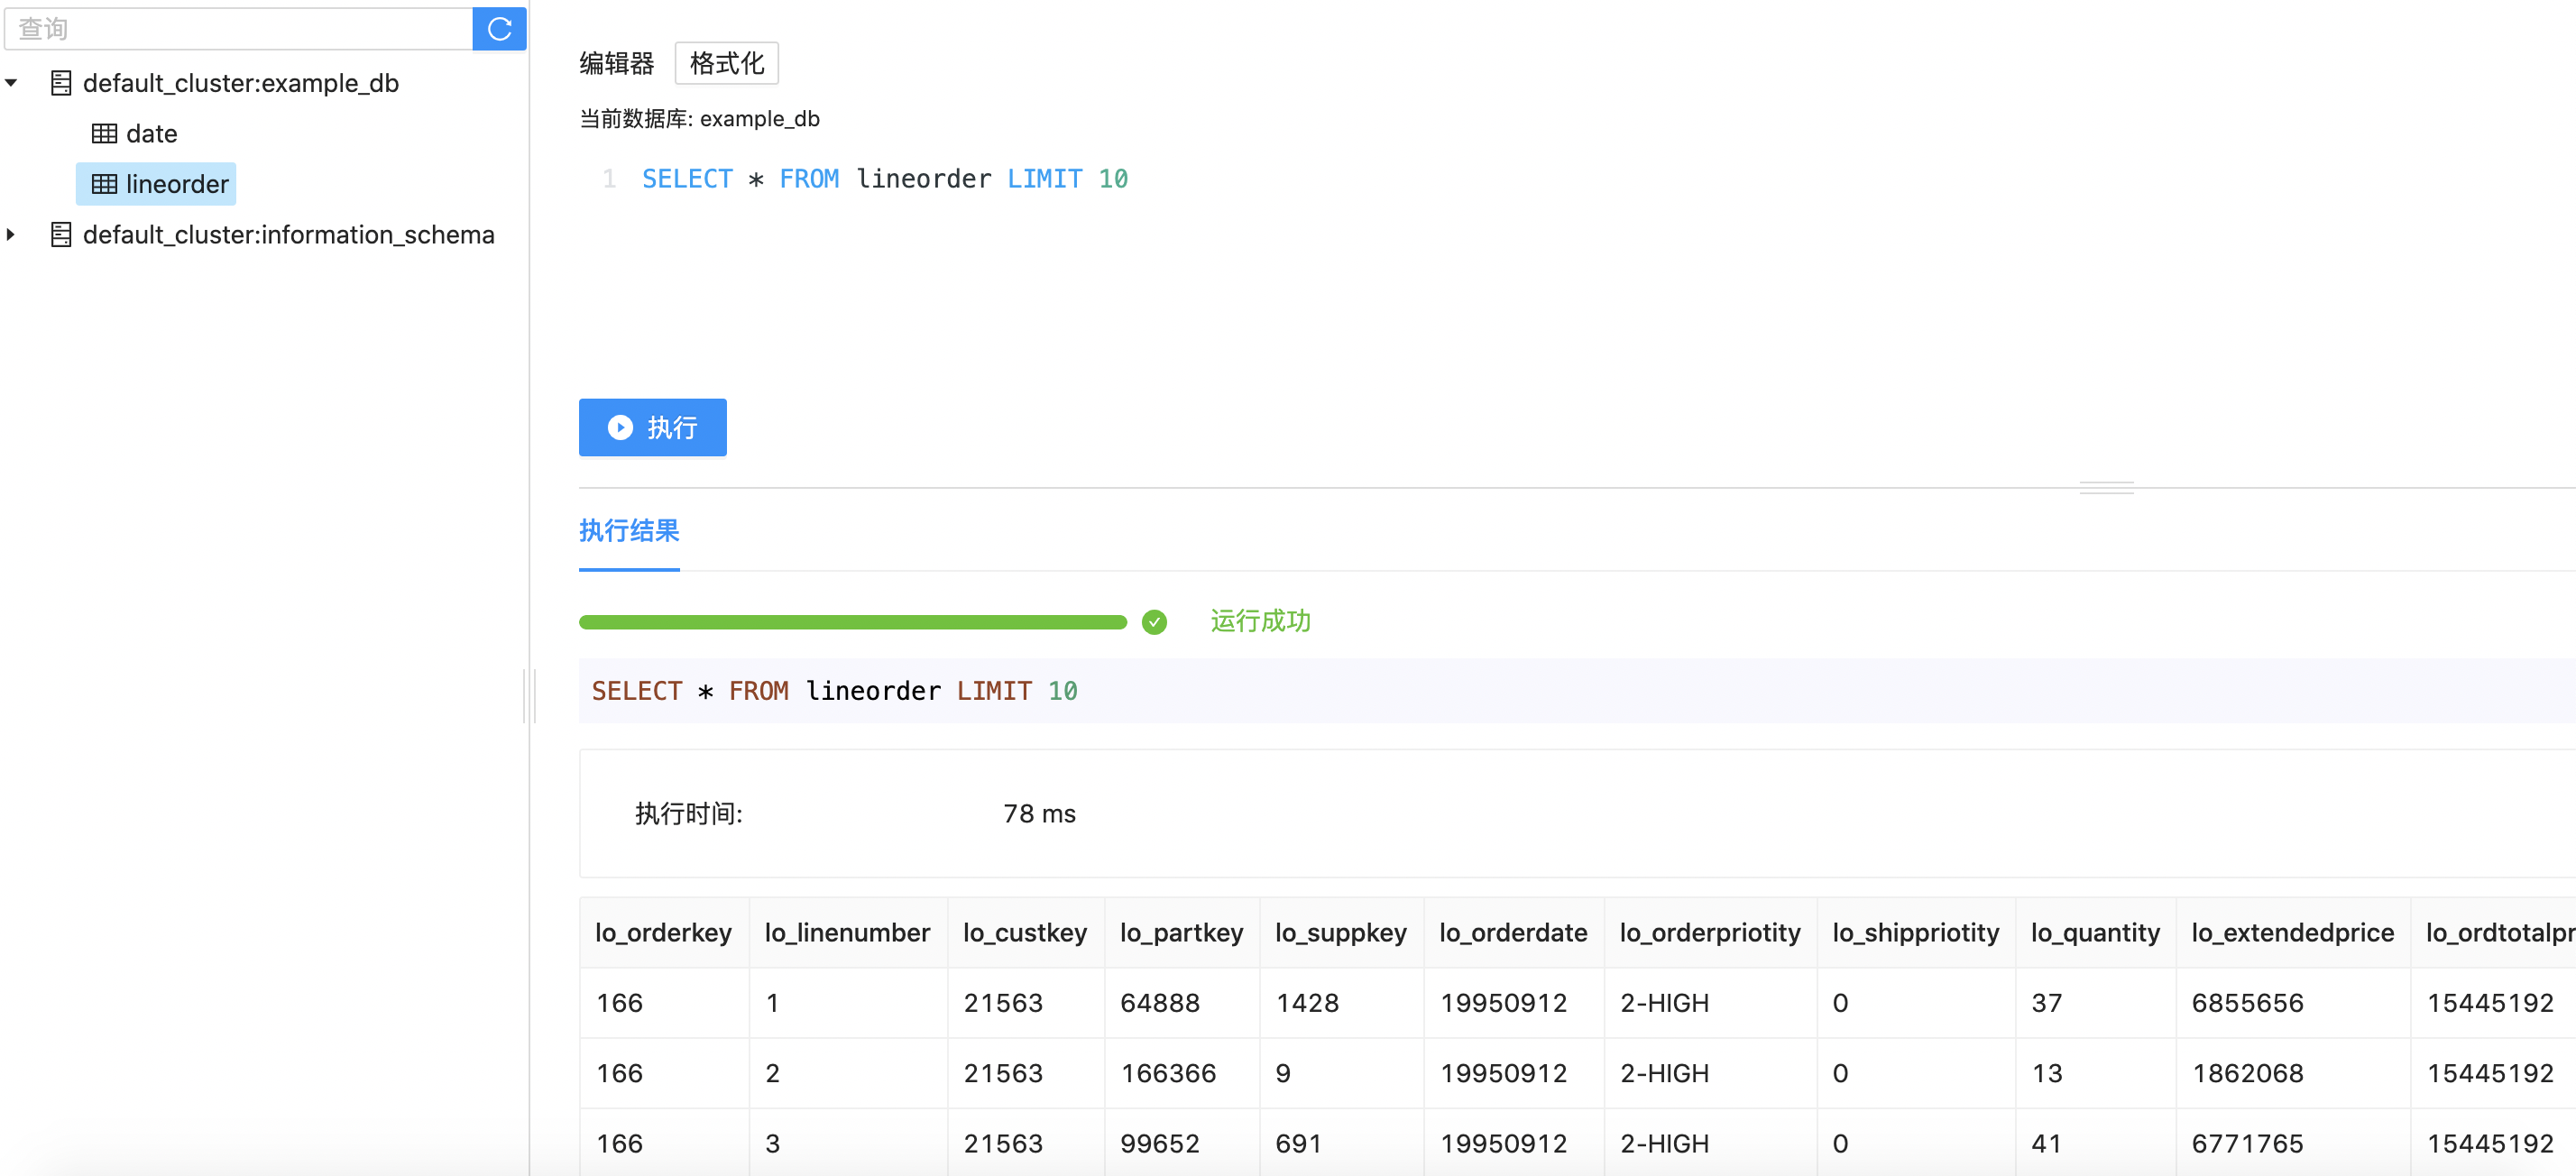
Or count the number of table query recorded.
SELECT COUNT(*) FROM lineorder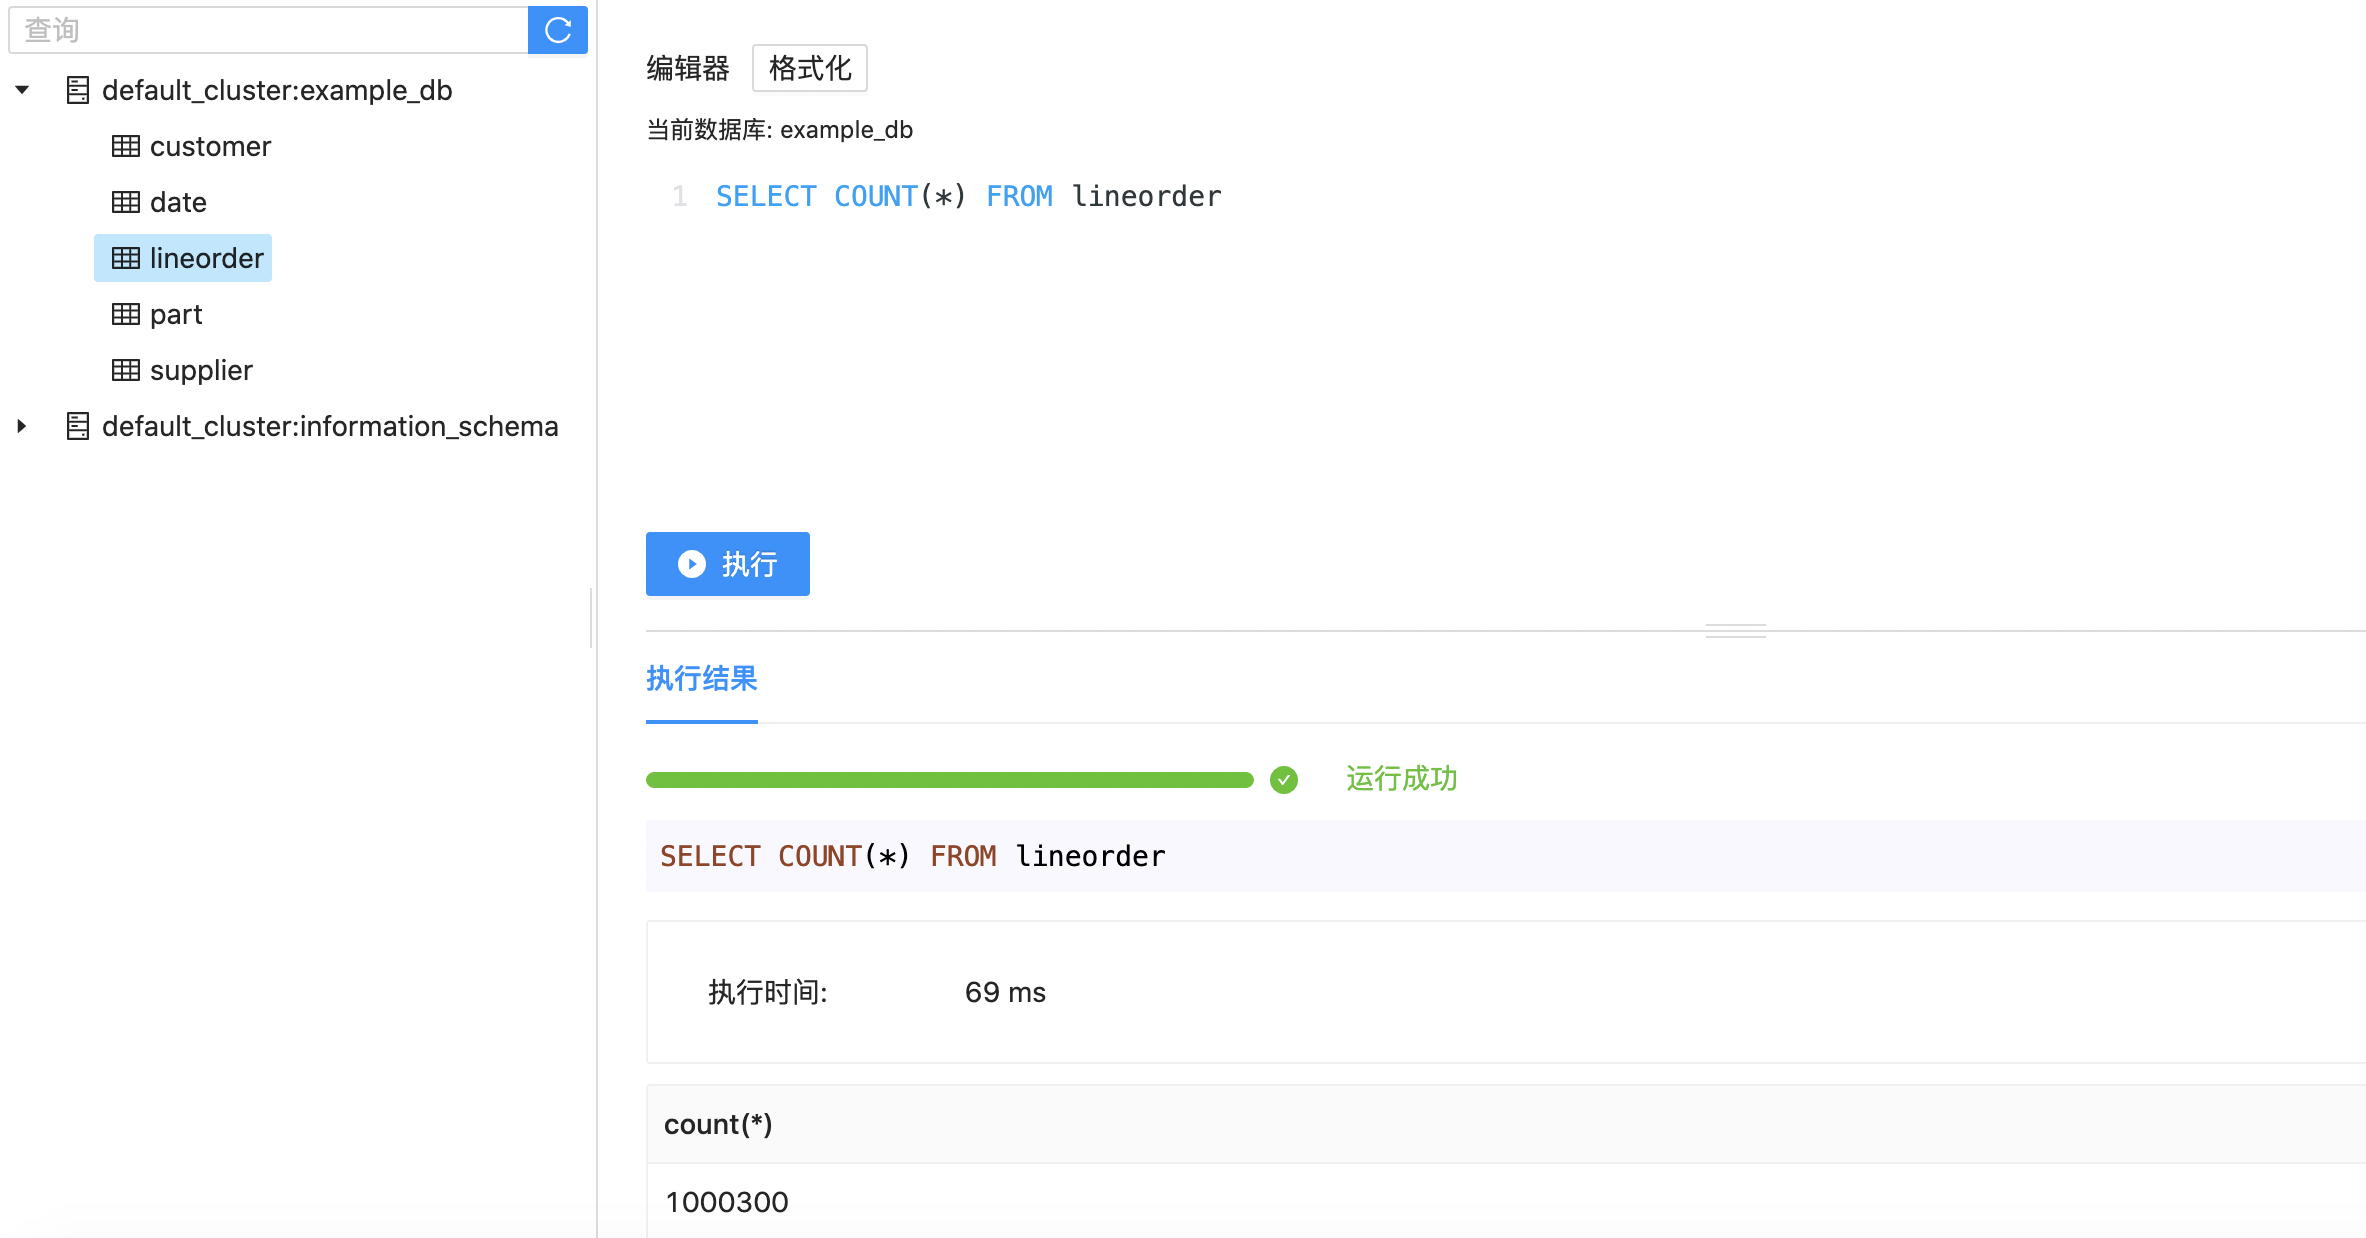
Analysis and query
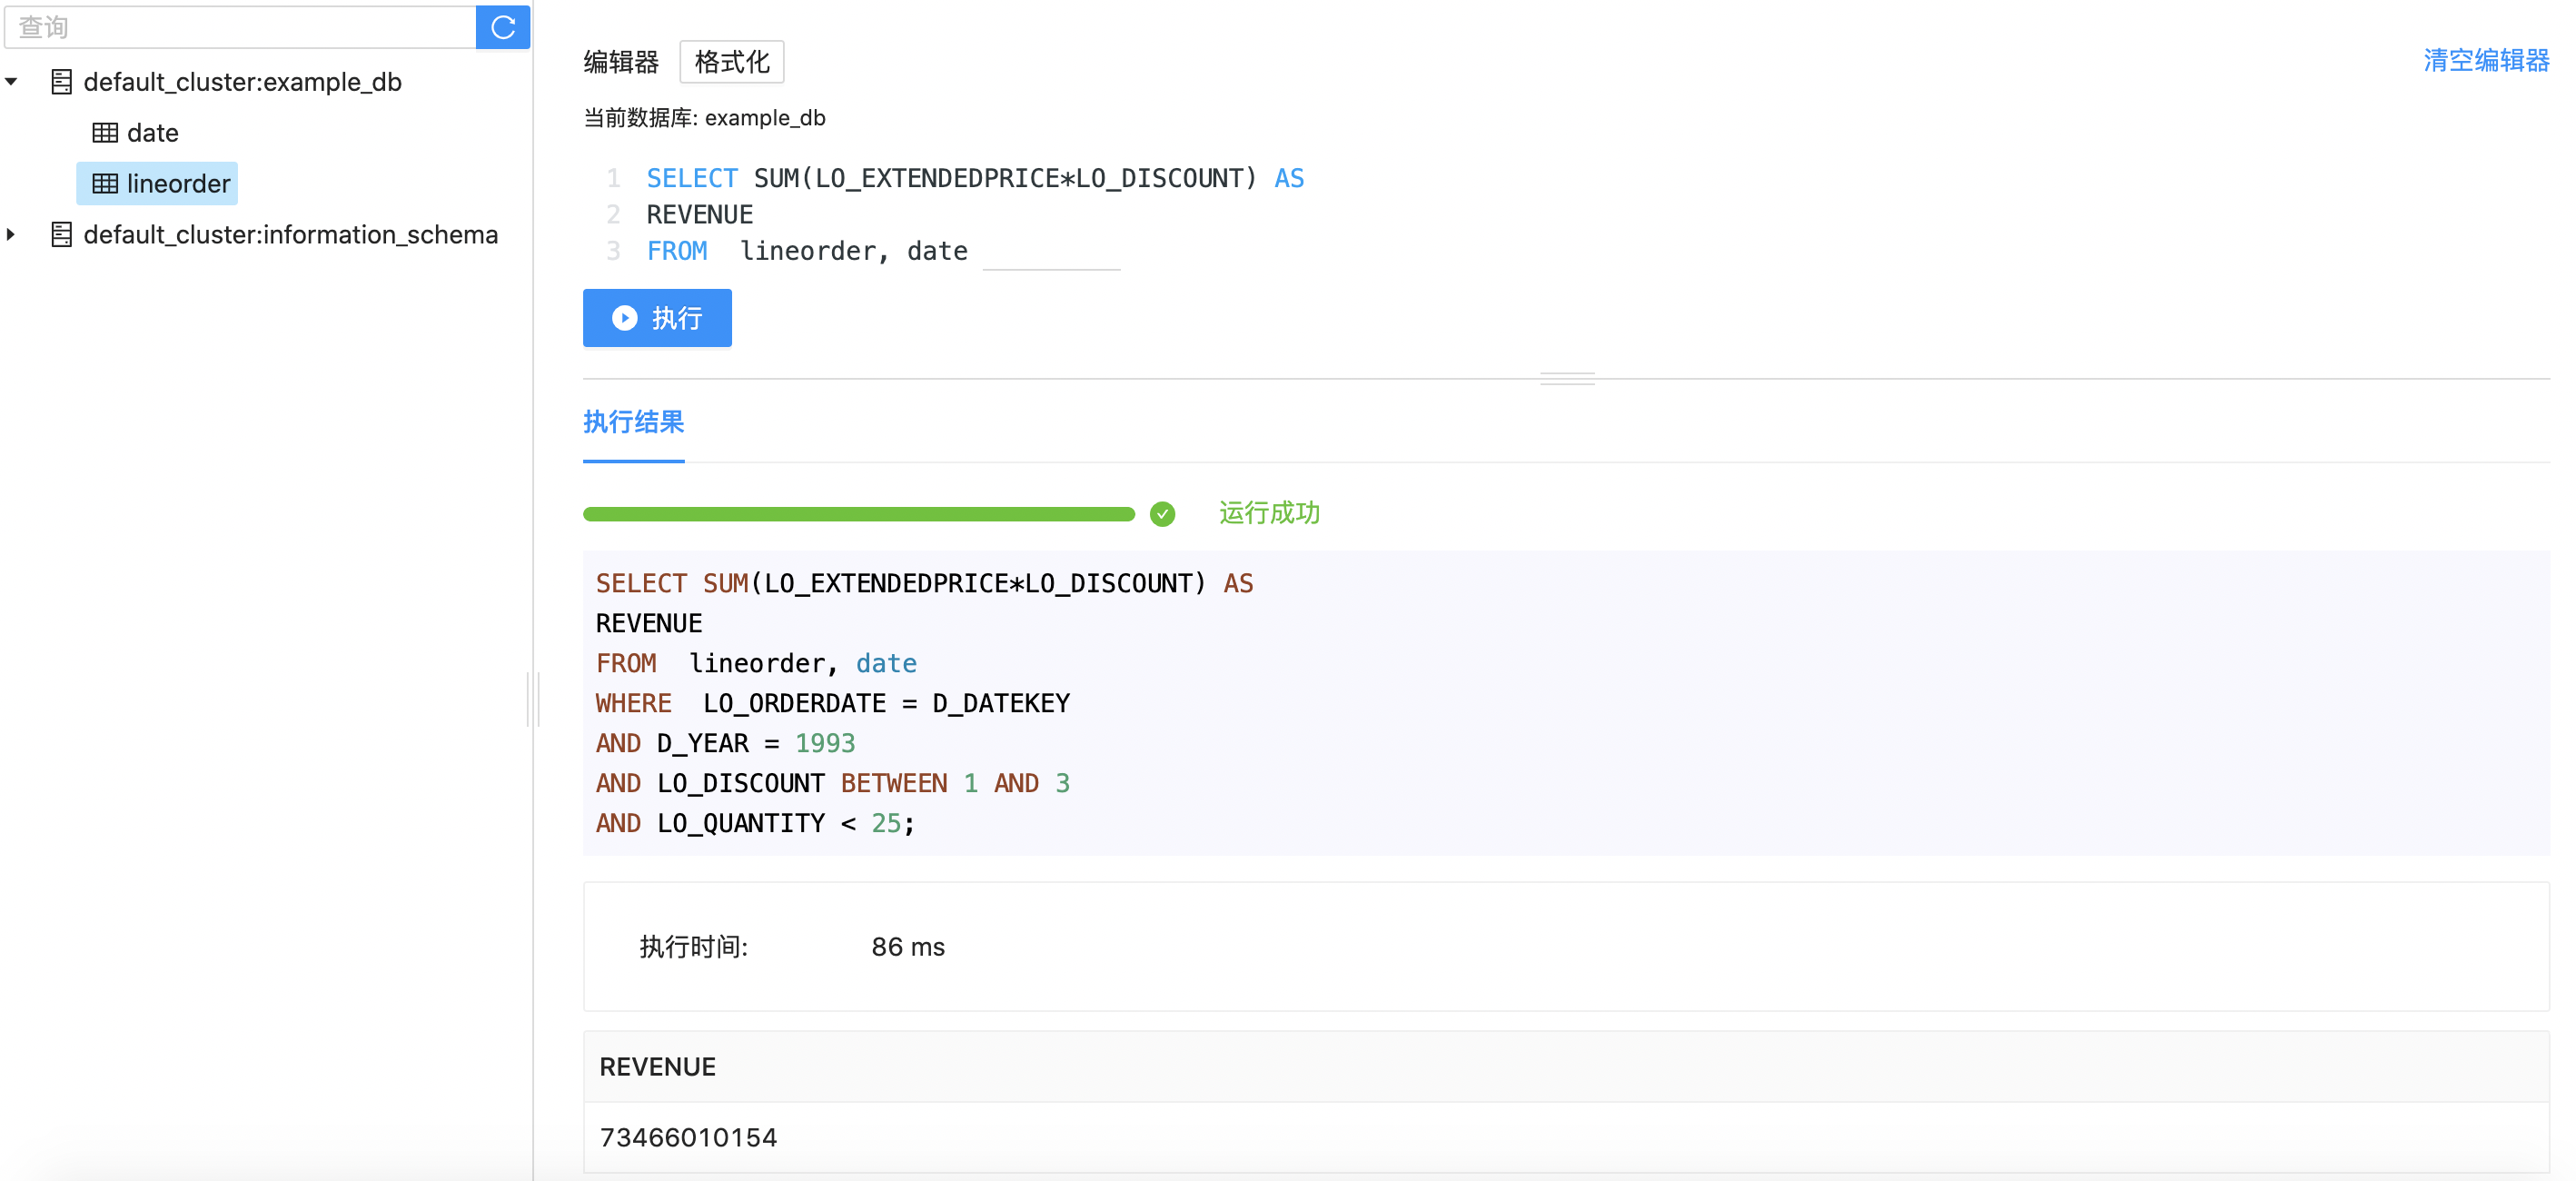
Then execute the query operation according to our analysis requirements and obtain the query results.
SELECT SUM(LO_EXTENDEDPRICE*LO_DISCOUNT) AS
REVENUE
FROM  lineorder, date
WHERE  LO_ORDERDATE = D_DATEKEY
AND D_YEAR = 1993
AND LO_DISCOUNT BETWEEN 1 AND 3
AND LO_QUANTITY < 25;
Through Web UI, we execute SQL on the page and obtain the query results quickly.
Complex query of multiple tables can also be executed.
SELECT C_CITY, S_CITY, D_YEAR, SUM(LO_REVENUE)
AS  REVENUE
FROM customer, lineorder, supplier, date
WHERE  LO_CUSTKEY = C_CUSTKEY
AND LO_SUPPKEY = S_SUPPKEY
AND  LO_ORDERDATE = D_DATEKEY
AND C_NATION = 'UNITED STATES'
AND S_NATION = 'UNITED STATES'
AND D_YEAR >= 1992 AND D_YEAR <= 1997
GROUP BY C_CITY, S_CITY, D_YEAR
ORDER BY D_YEAR ASC,  REVENUE DESC;
Execution time and results of page query:
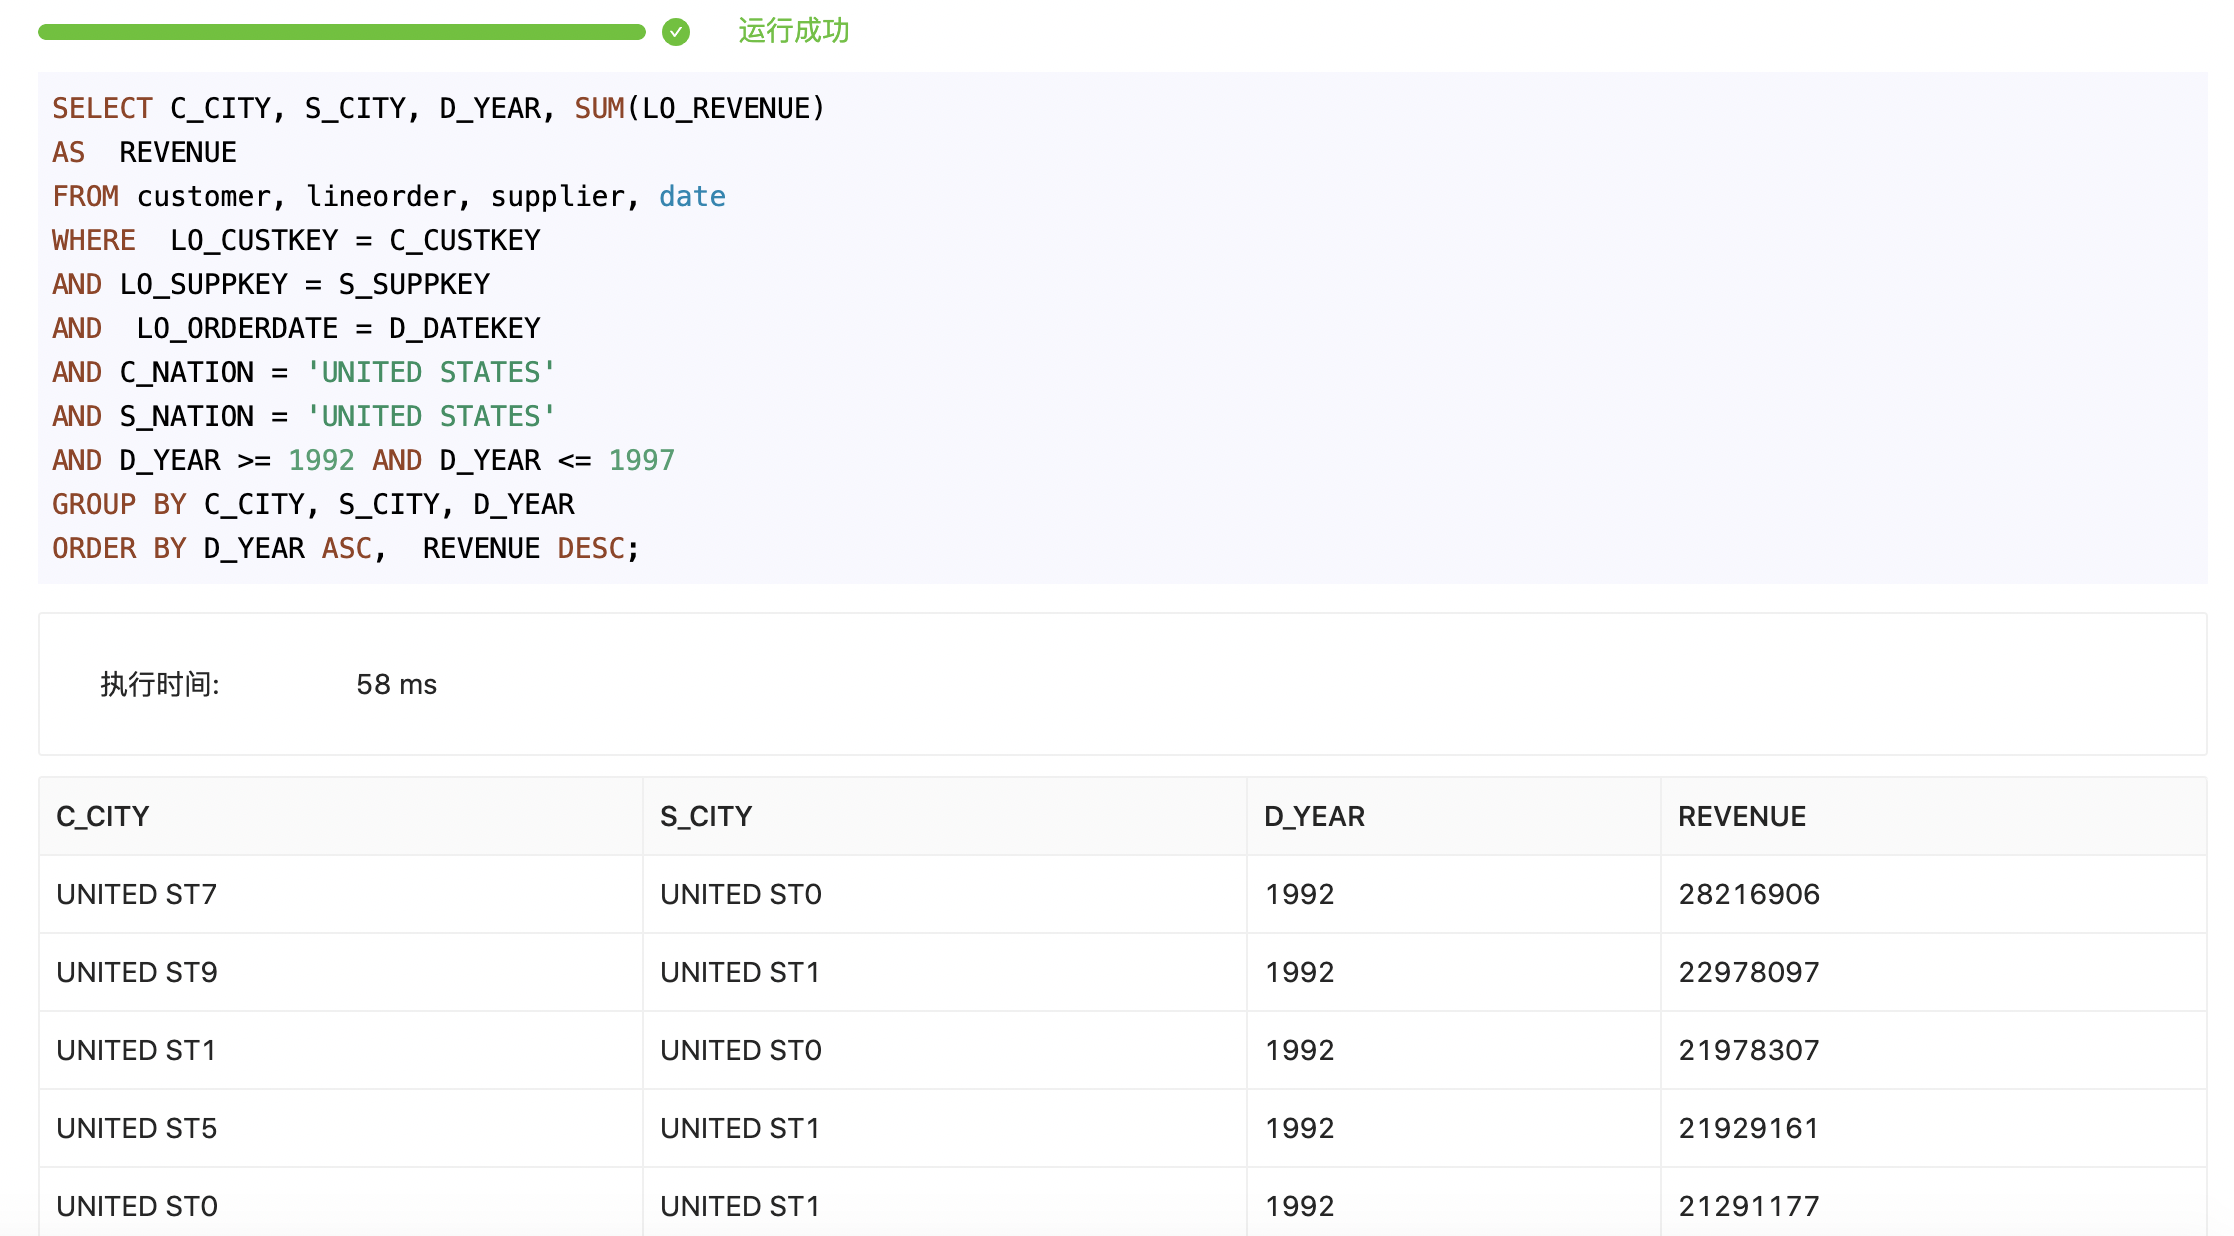
The execution time is the actual time consumed by SQL at server end. As there are many layers of agency on UI interface, the query delay sensed by users will be slower than the actual execution time of SQL.
 So far, we have completed a complete proces of database and tables building, data import and query. For more operations, please refer to Get Started.