
Create Scheduled SQL Analysis Task
Overview
The scheduled SQL analysis module currently supports log-to-metric conversion, allowing configure log-generated monitor metrics and push it to BCM custom monitor. Monitor metrics can be viewed on the BCM side. Later, this module will support log-generated metrics to CProm, scheduled log analysis, and storage to target LogStores.
Task Information
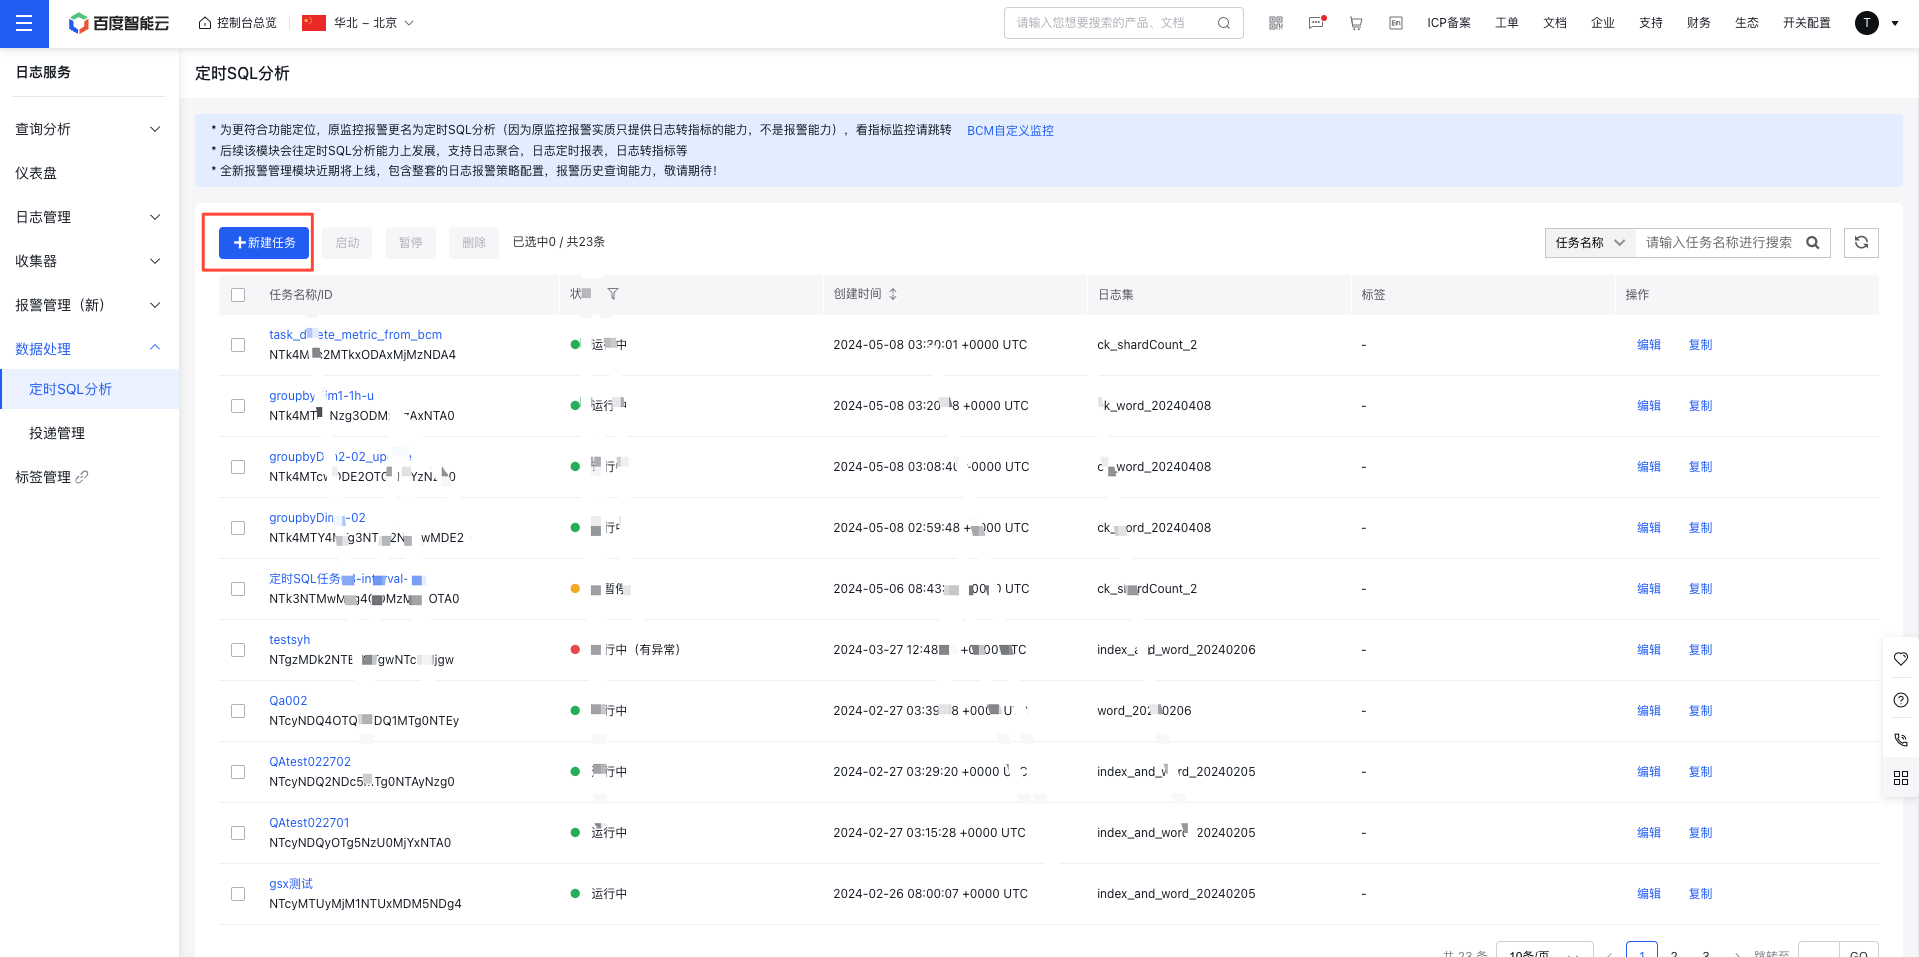
On the Log Service page, click Scheduled SQL Analysis to access the Scheduled SQL Analysis List page, click Create Task to fill in the configuration information on the creation page.
Configuration content
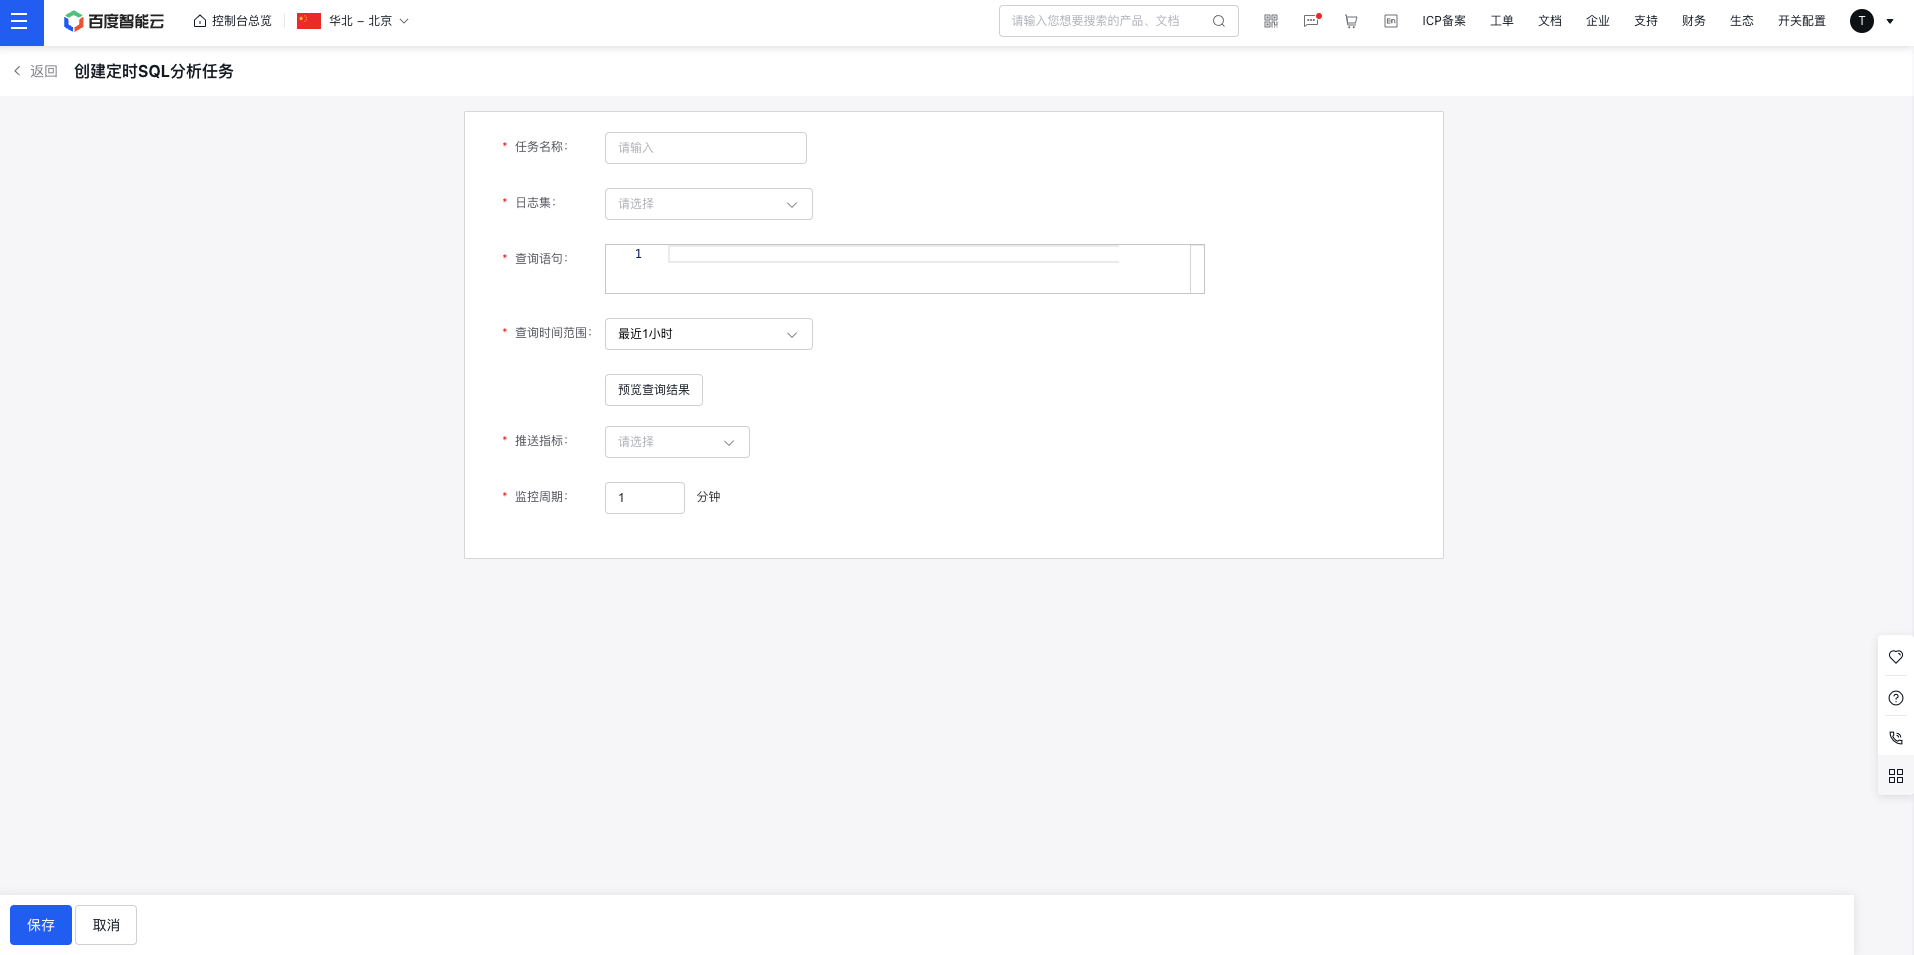
- Task name: Please enter the task name
- LogStore: Select the logStore
- Query statement: Summarize metrics in logs based on the query statement.
- Query time range: Defines the filter time range for the logs in the query statement, allowing access to logs from the past day.
- The query statement does not support pure search statements
match ..., but can support query statementsselect ...and query statements with search conditionsmatch ...| select ...- When using query statements with search conditions in alert tasks, index is not required to be enabled
- After adjusting the alert query statement or query time, Preview Query Results must be executed, and the task can only be created after previewing the results
-
Push metric: Choose a numeric field from the preview results as the monitoring metric, and aggregate the selected metric periodically to monitor activities.
- Pushing metrics requires selecting a field from the query statement results. The field name for pushing can be adjusted using aliases in the query statement
- Different alert tasks need to be bound to metrics with different names
-
Monitoring period: The minimum time interval between two consecutive metric aggregation tasks.
- The recommended use method is to set the monitor period, that is, the query time range
Query statement example
Log Sample
| @stream | @Level | CountSkipRows |
|---|---|---|
| stream1 | Error | 23 |
| stream1 | Info | 0 |
| stream2 | Error | 1 |
CASE1: Monitor aggregated metrics
- SELECT CountSkipRows
- CountSkipRows: As a metric, it must be aggregated as a numeric value in the logs
- During each push period, the number of metric data entries cannot exceed 1,000. Excess entries will be discarded
CASE2: Aggregate log data and monitor metrics
- SELECT COUNT(@Level) as cntLevel, @Level as level group by @Level
- Aggregate the count of the @Level field and monitor the count as a metric
- Monitor metric contains 3-50 characters, including letters, numbers, -, and _. Names can be modified through renaming operations
After filtering keyword, CASE3 aggregates log data and monitor metrics
- MATCH stream1 | SELECT COUNT(@Level) as cntLevel, @Level as level group by @Level
- Only monitor logs with stream1