Use BLS via Grafana
Operation scenarios
Baidu Log Service (BLS) integrates with Grafana, enabling logstore data to be displayed through Grafana. This document provides guidance on installing and configuring Grafana.
Prerequisites
For installation of Grafana version 8.0 or above, please refer to documents on Grafana official website for specific operations. If Grafana version is lower than 8.0, configuration backup and upgrade are required. Please refer to the Grafana Upgrade Guide for details.
Operation steps
Step I: Install BLS plugin to Grafana.
The steps to install the log service plugin for Grafana are as follows:
- Download the BLS plugin.
Download address: https://bls-grafana-datasource.bj.bcebos.com/latest/baidubcebls-datasource.zip
- Execute the following command to decompress the log service plugin package into the Grafana plugin directory.
- Grafana installed through YUM or RPM:
unzip baidubcebls-datasource-master.zip -d /var/lib/grafana/plugins
- Grafana installed via a .tar.gz file: {PATH_TO} represents Grafana's installation path.
unzip baidubcebls-datasource-master.zip -d {PATH_TO}/grafana-8.0.6/data/plugins
- Modify the Grafana configuration file.
(1) Position of configuration file
- Grafana installed through YUM or RPM:/etc/grafana/grafana.ini
- Grafana installed through the file .tar.gz: {PATH_TO}/grafana-8.0.6/conf/defaults.ini
(2) Set the parameter allow_loading_unsigned_plugins in the [plugins] node of the configuration file.
allow_loading_unsigned_plugins = baidubcebls-datasource
- Restart Grafana.
systemctl restart grafana-server
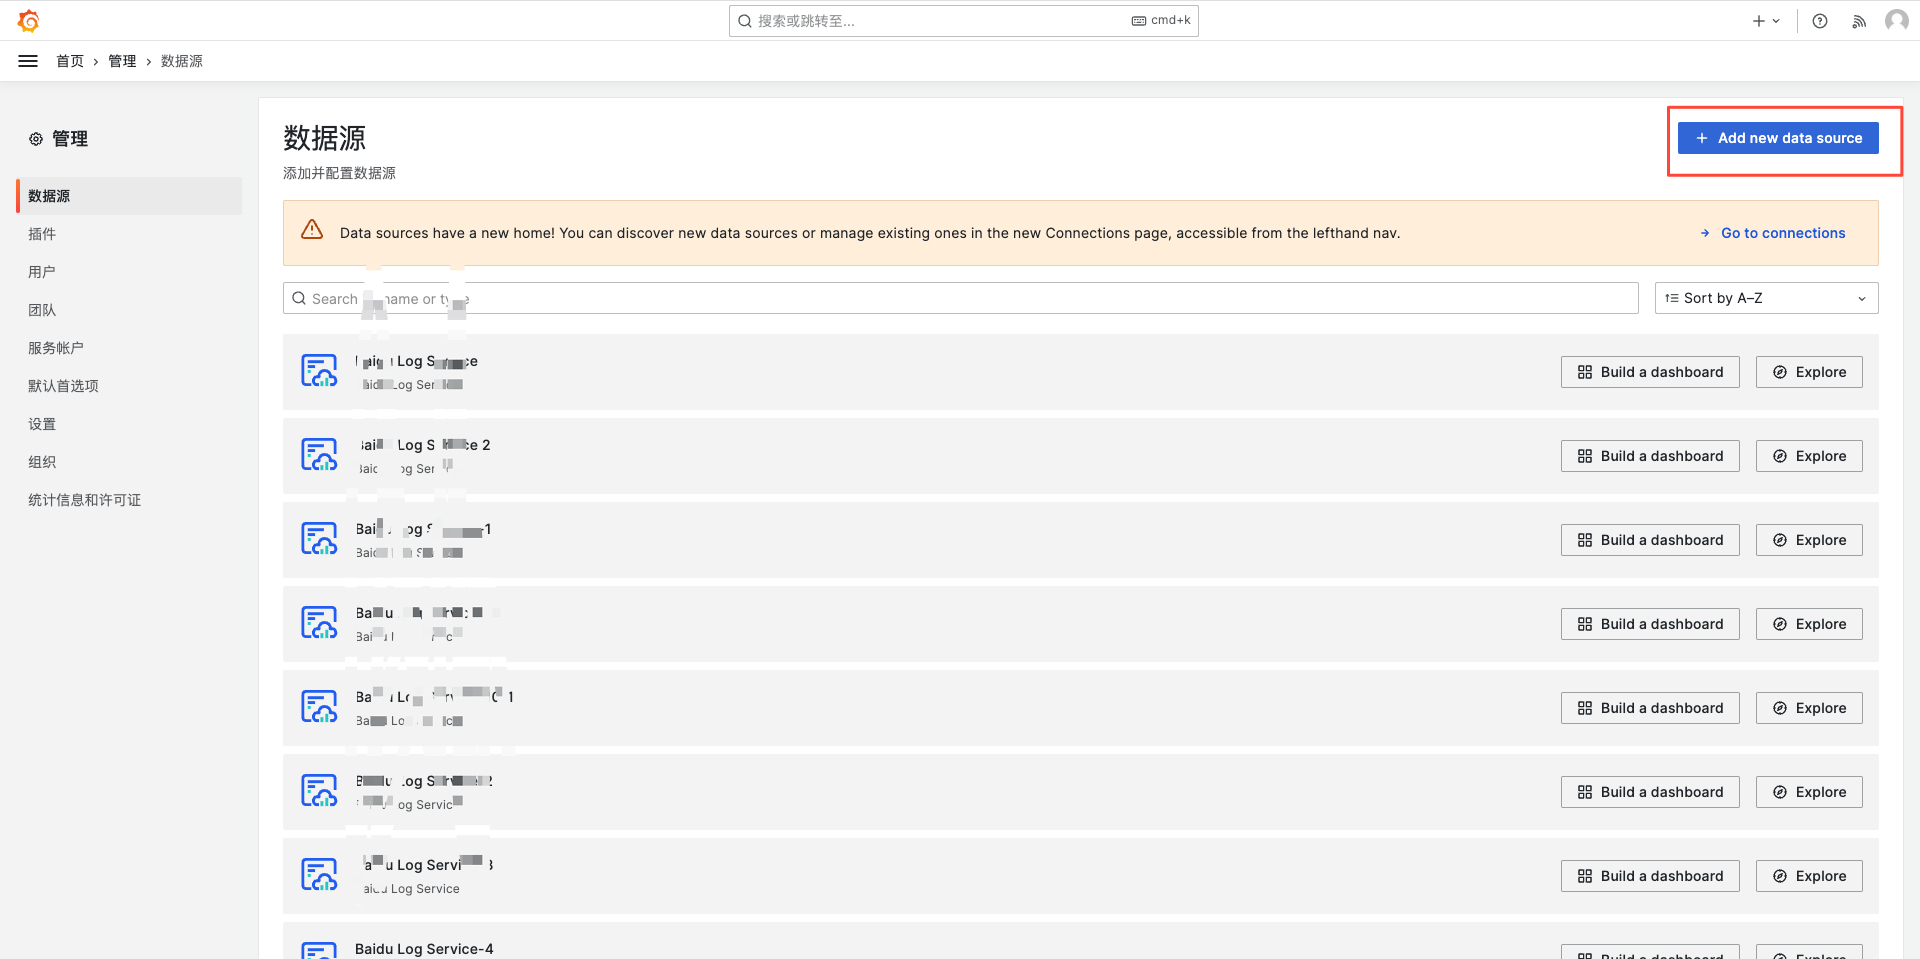
Step II: Configure data source
Click on Add Data Source on the Data Sources page.
Select Baidu Log Service data source, and configure the data source according to the following instructions

- Name: set the data source name
- Endpoint: bls address
- AK and SK: fill in after obtaining the security certification under the Baidu AI Cloud console account
Step III: View data in Grafana
- Enter Grafana-Dashboard, and click Add Chart to enter the Chart Configuration page as follows:
- Log project and logstore: Select the Baidu Log Service plugin as the data source and choose the target log project and logstore.
- Query statement: Enter a query into the search field and click "Flush" in the top-right corner to view the statistical chart results.
- Legend: users can customize the legend contents, such as host1-{{host}}, and the field value content is obtained through{{维度字段}}. If only constants are written, all legends are constant content; if the written dimension field is wrong, an error will be displayed; if it is empty, the default legend content will be displayed.
- Dimension: fields of string and bool types are obtained as dimensions by default, and fields of numerical type can be customized as dimensions, such as Status. At this time, all dimension fields need to be filled in, and multiple fields are separated by commas.
- Chart format: for the query results containing timestamp fields, the system will display data in a timeseries format by default, or the original data in a Table format. For example, select * contains a time field, so the Table format shall be selected or an error will be displayed. To configure a pie chart, the Pie format shall be selected; otherwise the legend configuration is invalid.
- Time column: displayed when the chart format is timeseries. The system obtains the timestamp field as the time column by default. If the system obtains it incorrectly, a field can be customized as the time column.
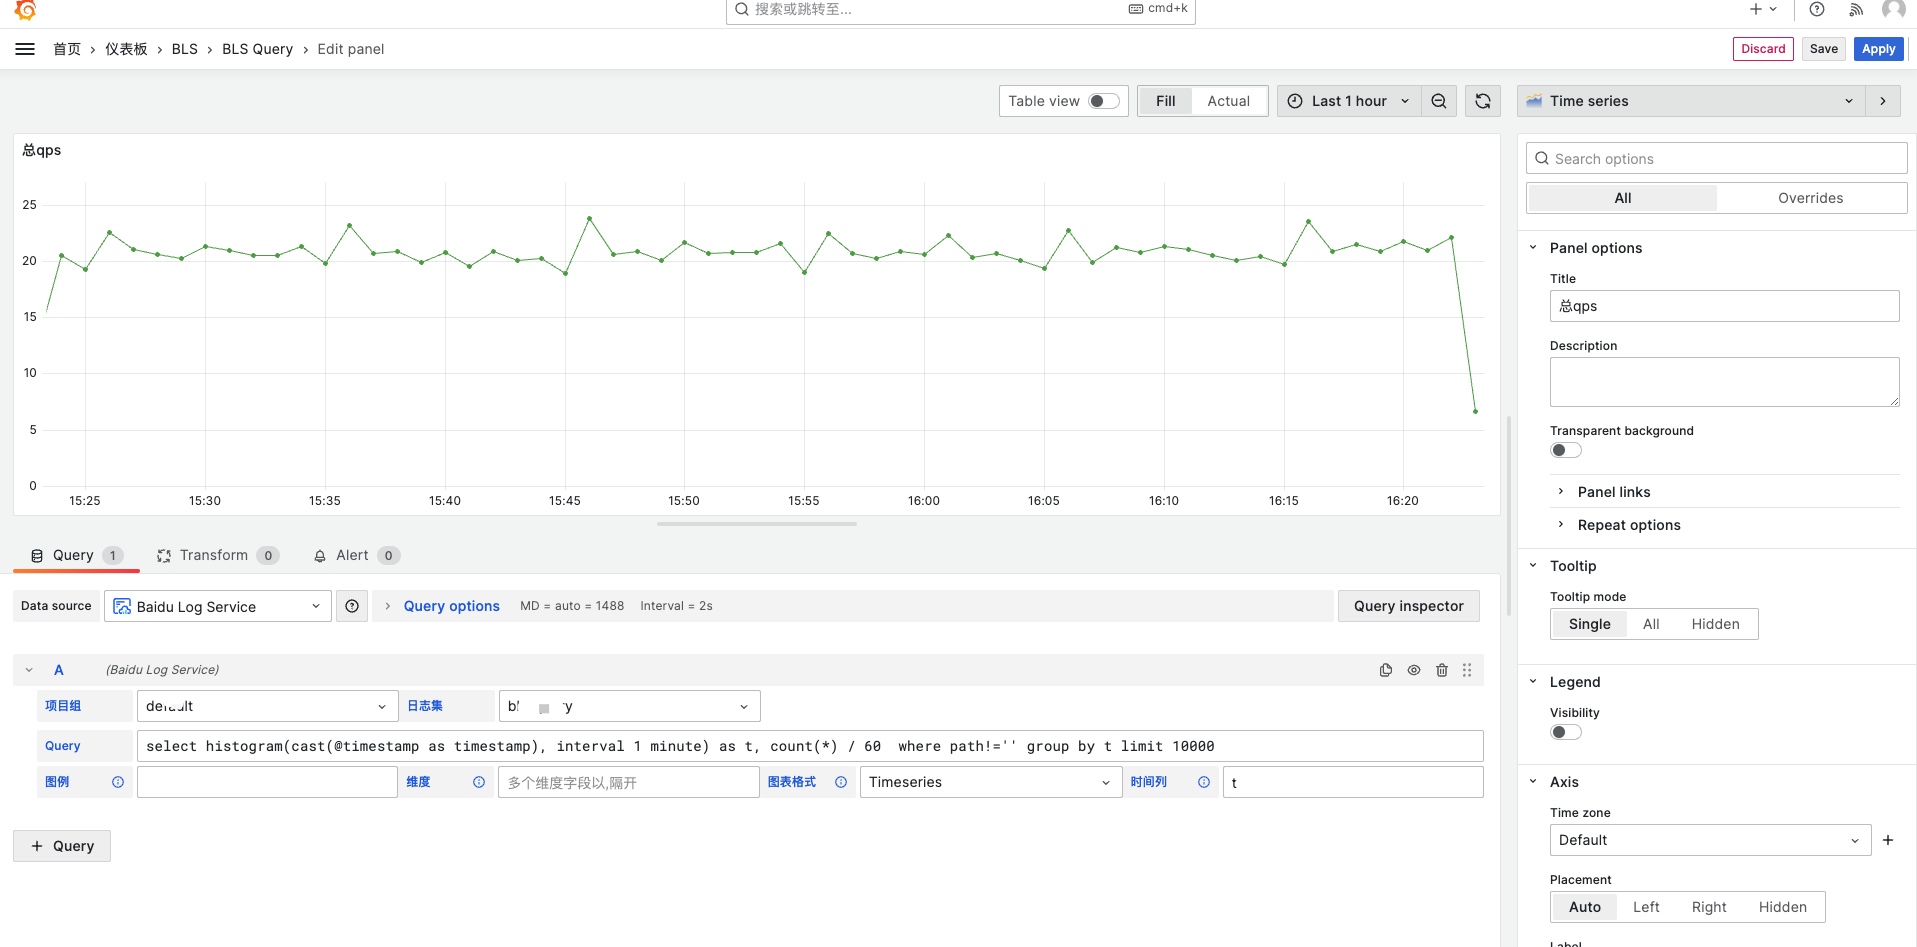
Example of statement for drawing sequence charts
select histogram(cast(@timestamp as timestamp), interval 1 minute) as t, count(*) where path!='' group by t limit 10000
Example of statement for drawing pie charts: notice the chart configuration item Value Options - show on the right, and select All values:
select uid, count(*) as cnt group by uid order by cnt desc limit 10
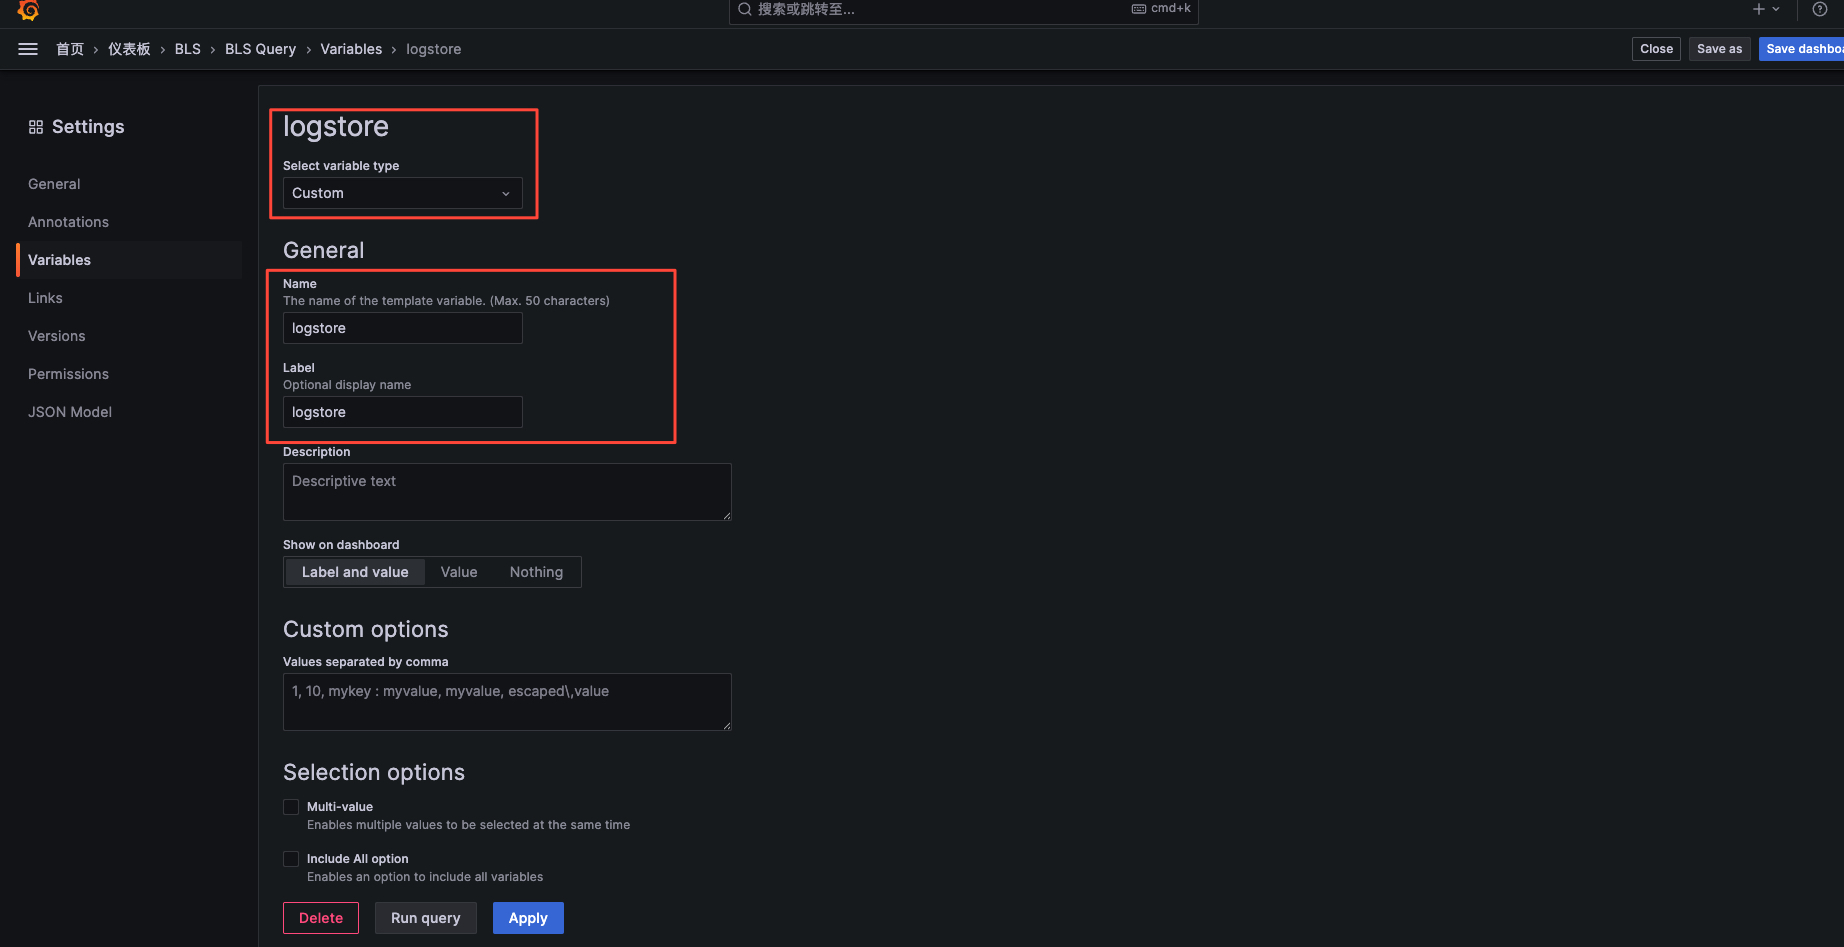
How to use the configuration logstore variables
In Grafana variable configuration, you must select the Custom type. The name field serves as a unique identifier and must contain the 'logstore' string, which is case-insensitive.
In the chart configuration API, select the logstore variable for the logstore, and enter the specific logstore in the above logstore variable input box. You need to input the logstore (project), and either Chinese or English parentheses are acceptable (but must be consistent, either all Chinese or all English), e.g., logstore1(project1). Refresh to retrieve data.

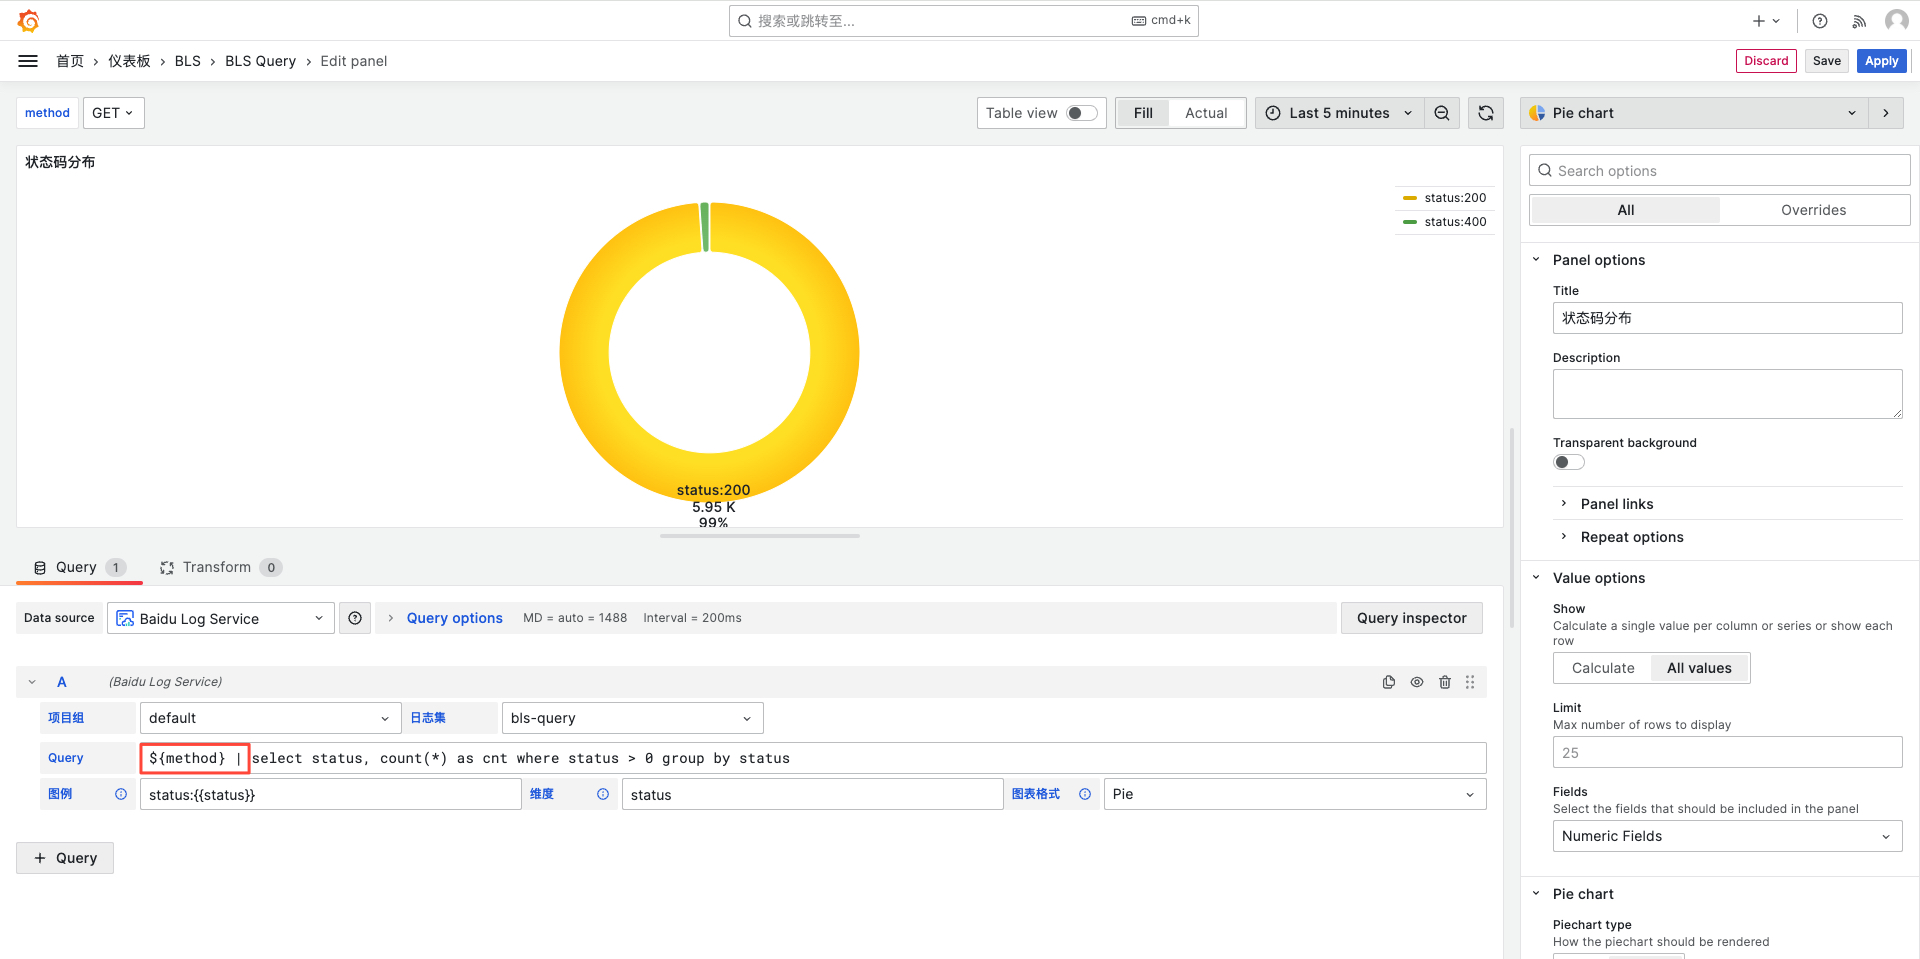
How to use variables to filter log data
Configure variables in Grafana and embed them into the chart query. By selecting different variable values, you can filter the chart data. Here's an example using the user’s "Method" filter configuration:
- Go to the Variables menu in the Grafana dashboard configuration and select "New Variables."
- Set the Variable type to "Query."
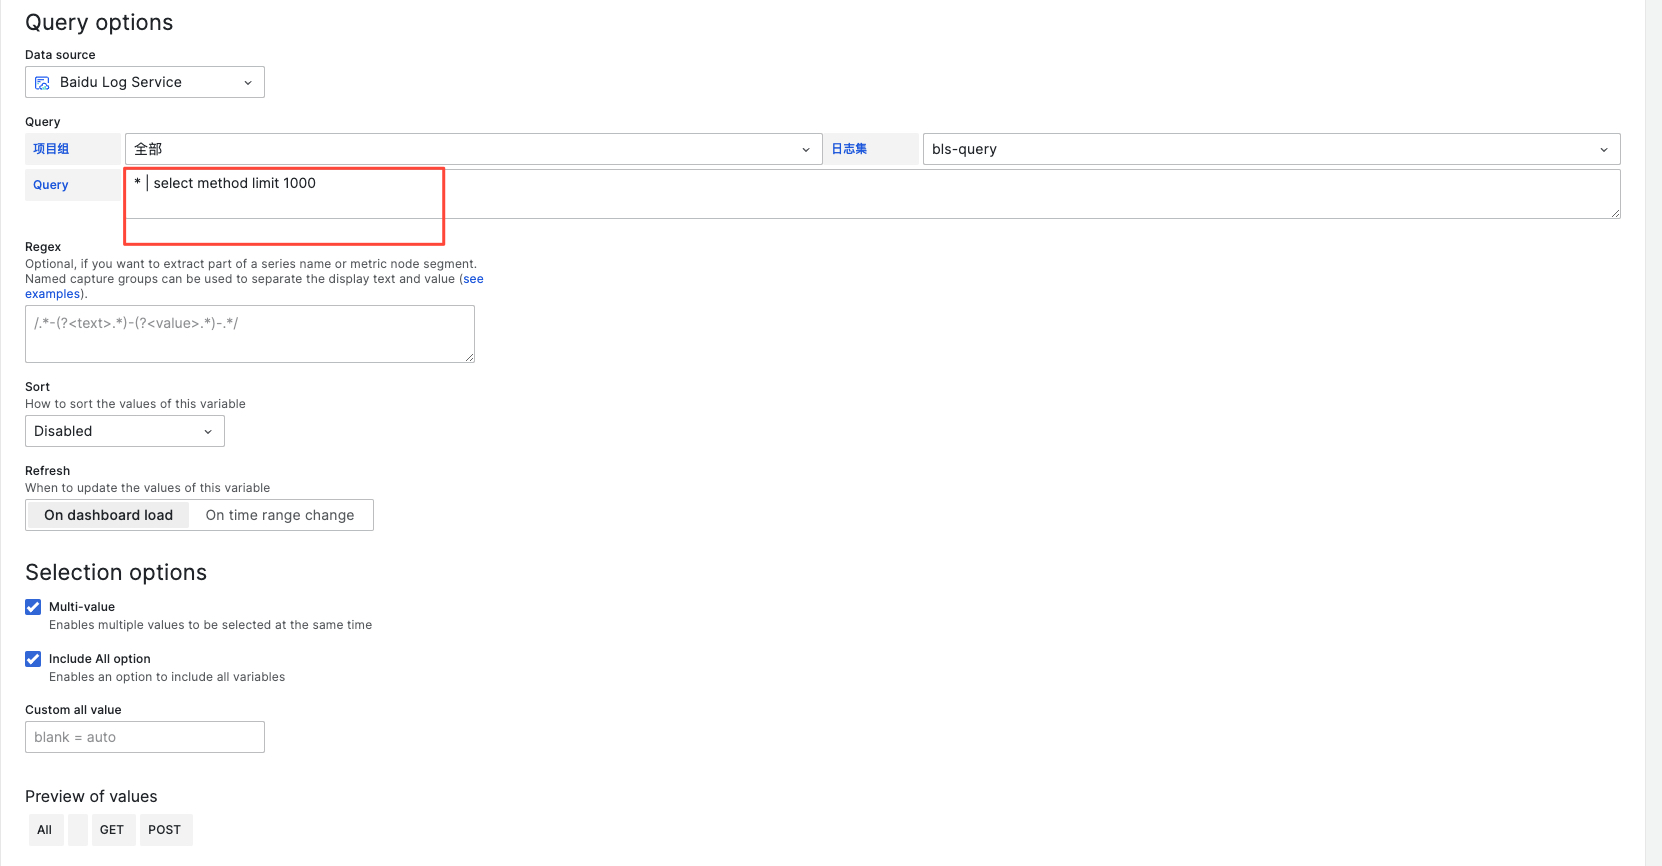
- In the Query options, select the Baidu Log Service plugin in the DataSource dropdown.
- The query service type is log service, and the query statement is as follows (take method as an example, and replace it with the target field in the actual use):
* | select method limit 1000
- (Optional) For selection options, check multiple selection and all selection; the default value of all selection is *
- Insert the variable ${method} into the statement to complete the configuration.