Log query
Log query
Log query is used to query and analyze the data content of existing LogStore. Baidu AI Cloud Log Service (BLS) provides a comprehensive data query and analysis syntax. For details, refer to [Search Syntax]
- Sign in to the Baidu AI Cloud official website, click Management Console in the top-right corner to quickly access the console interface.
- Go to Product Service > Baidu Log Service (BLS) and navigate to Query Analysis -> Log Query page.

-
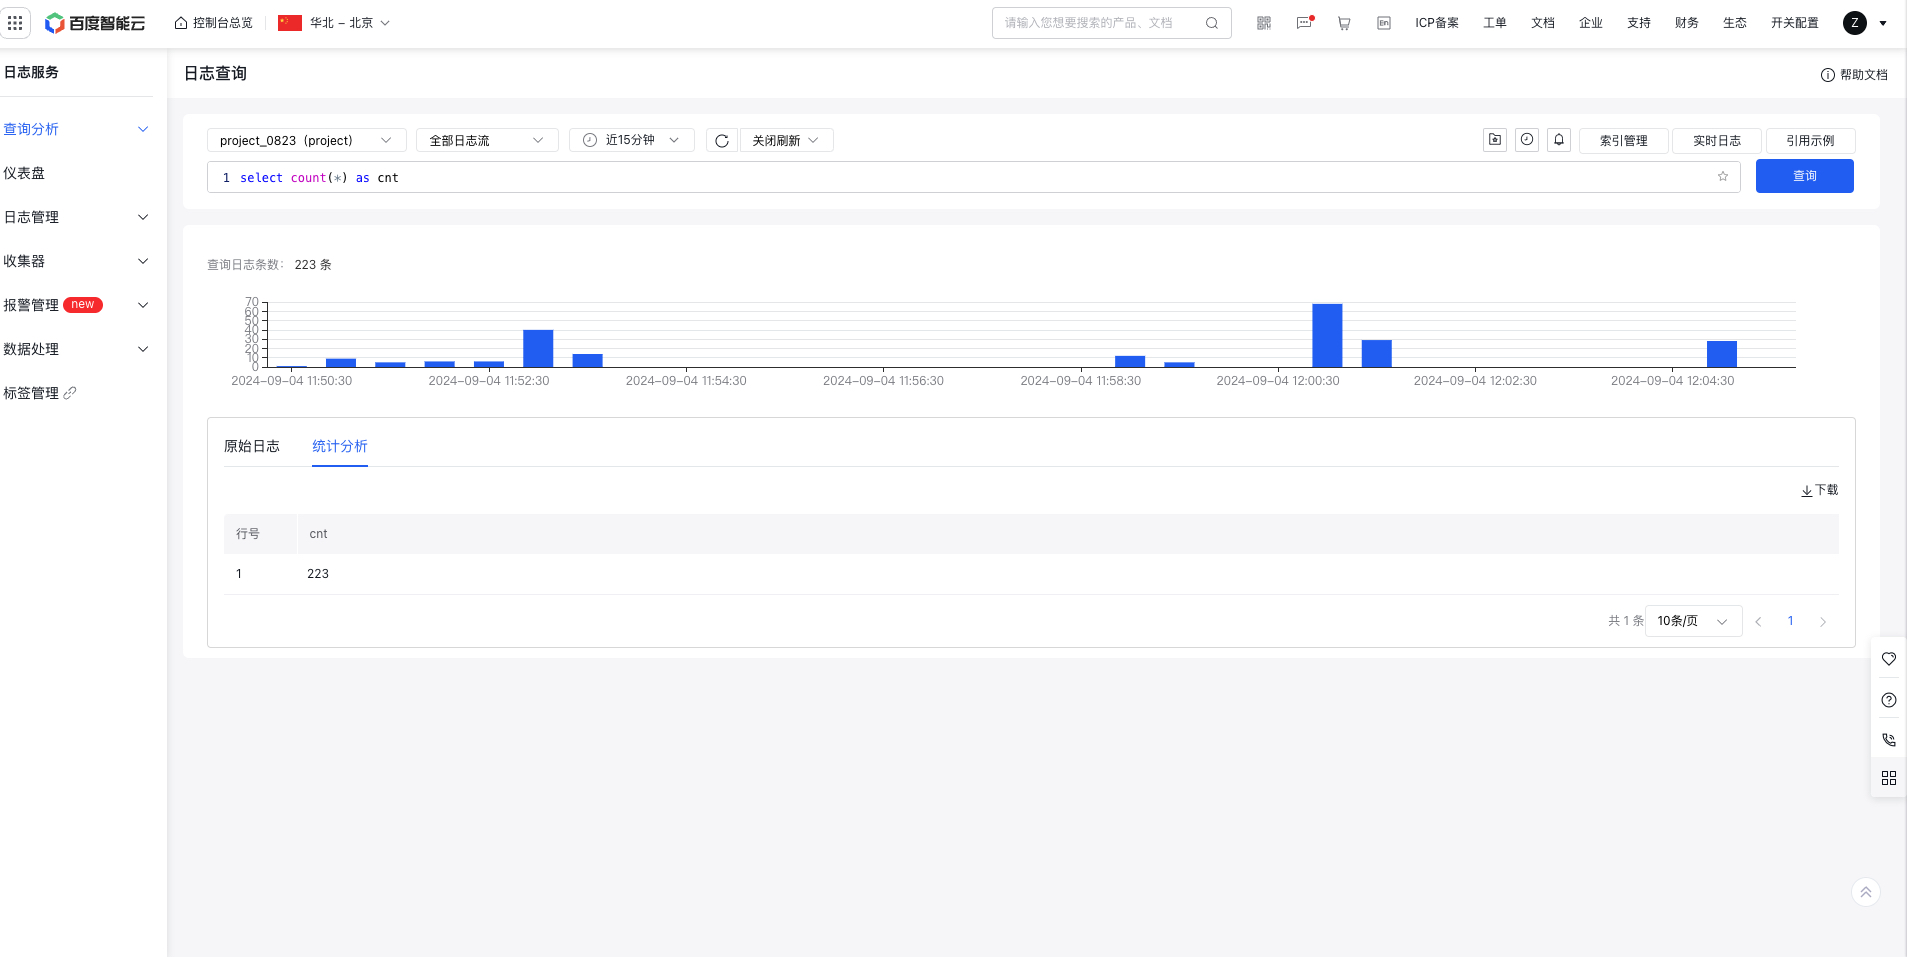
Select logstore, logstream and time range, enter search or SQL statements in the statement edit box, or reference SQL statement in the example, click Query to execute the query statement, and return the results and display them below.
- LogStore Selection: Choose from user-created LogStores in the current region or manually input a LogStore name to filter.
- Logstream Selection: Specify the logstream within the chosen LogStore. Leave blank to query all logstreams.
- Auto-refresh: By default, data query results do not auto-refresh. Once the auto-refresh period is set, the query statement will be executed automatically at defined intervals.
- Quick actions
| Function | Description |
|---|---|
| Favorite statements | If you frequently need to view the data results of this query, click Favorite button to store the current data query in your favorites. Enter favorites to automatically execute query statements and display results. 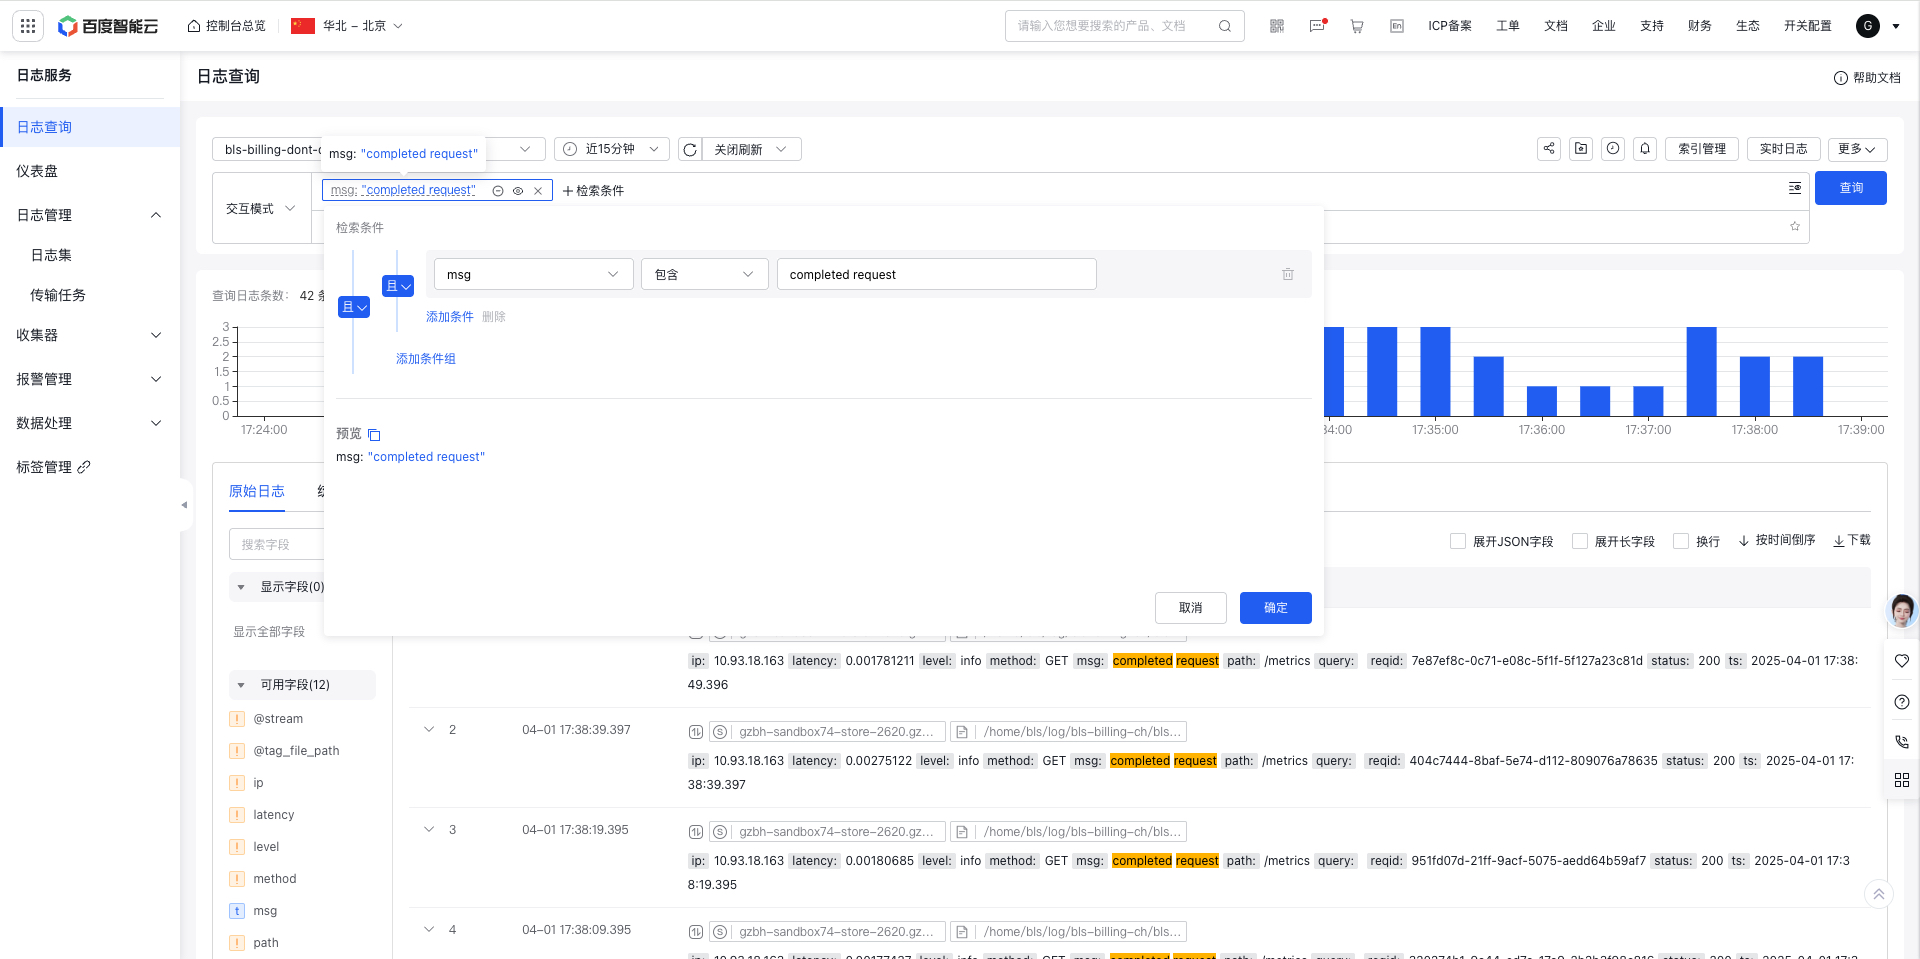 |
| Historical records | Click the History Records Pop-up to quickly select recently queried statements, automatically execute the query statements, and display the results. 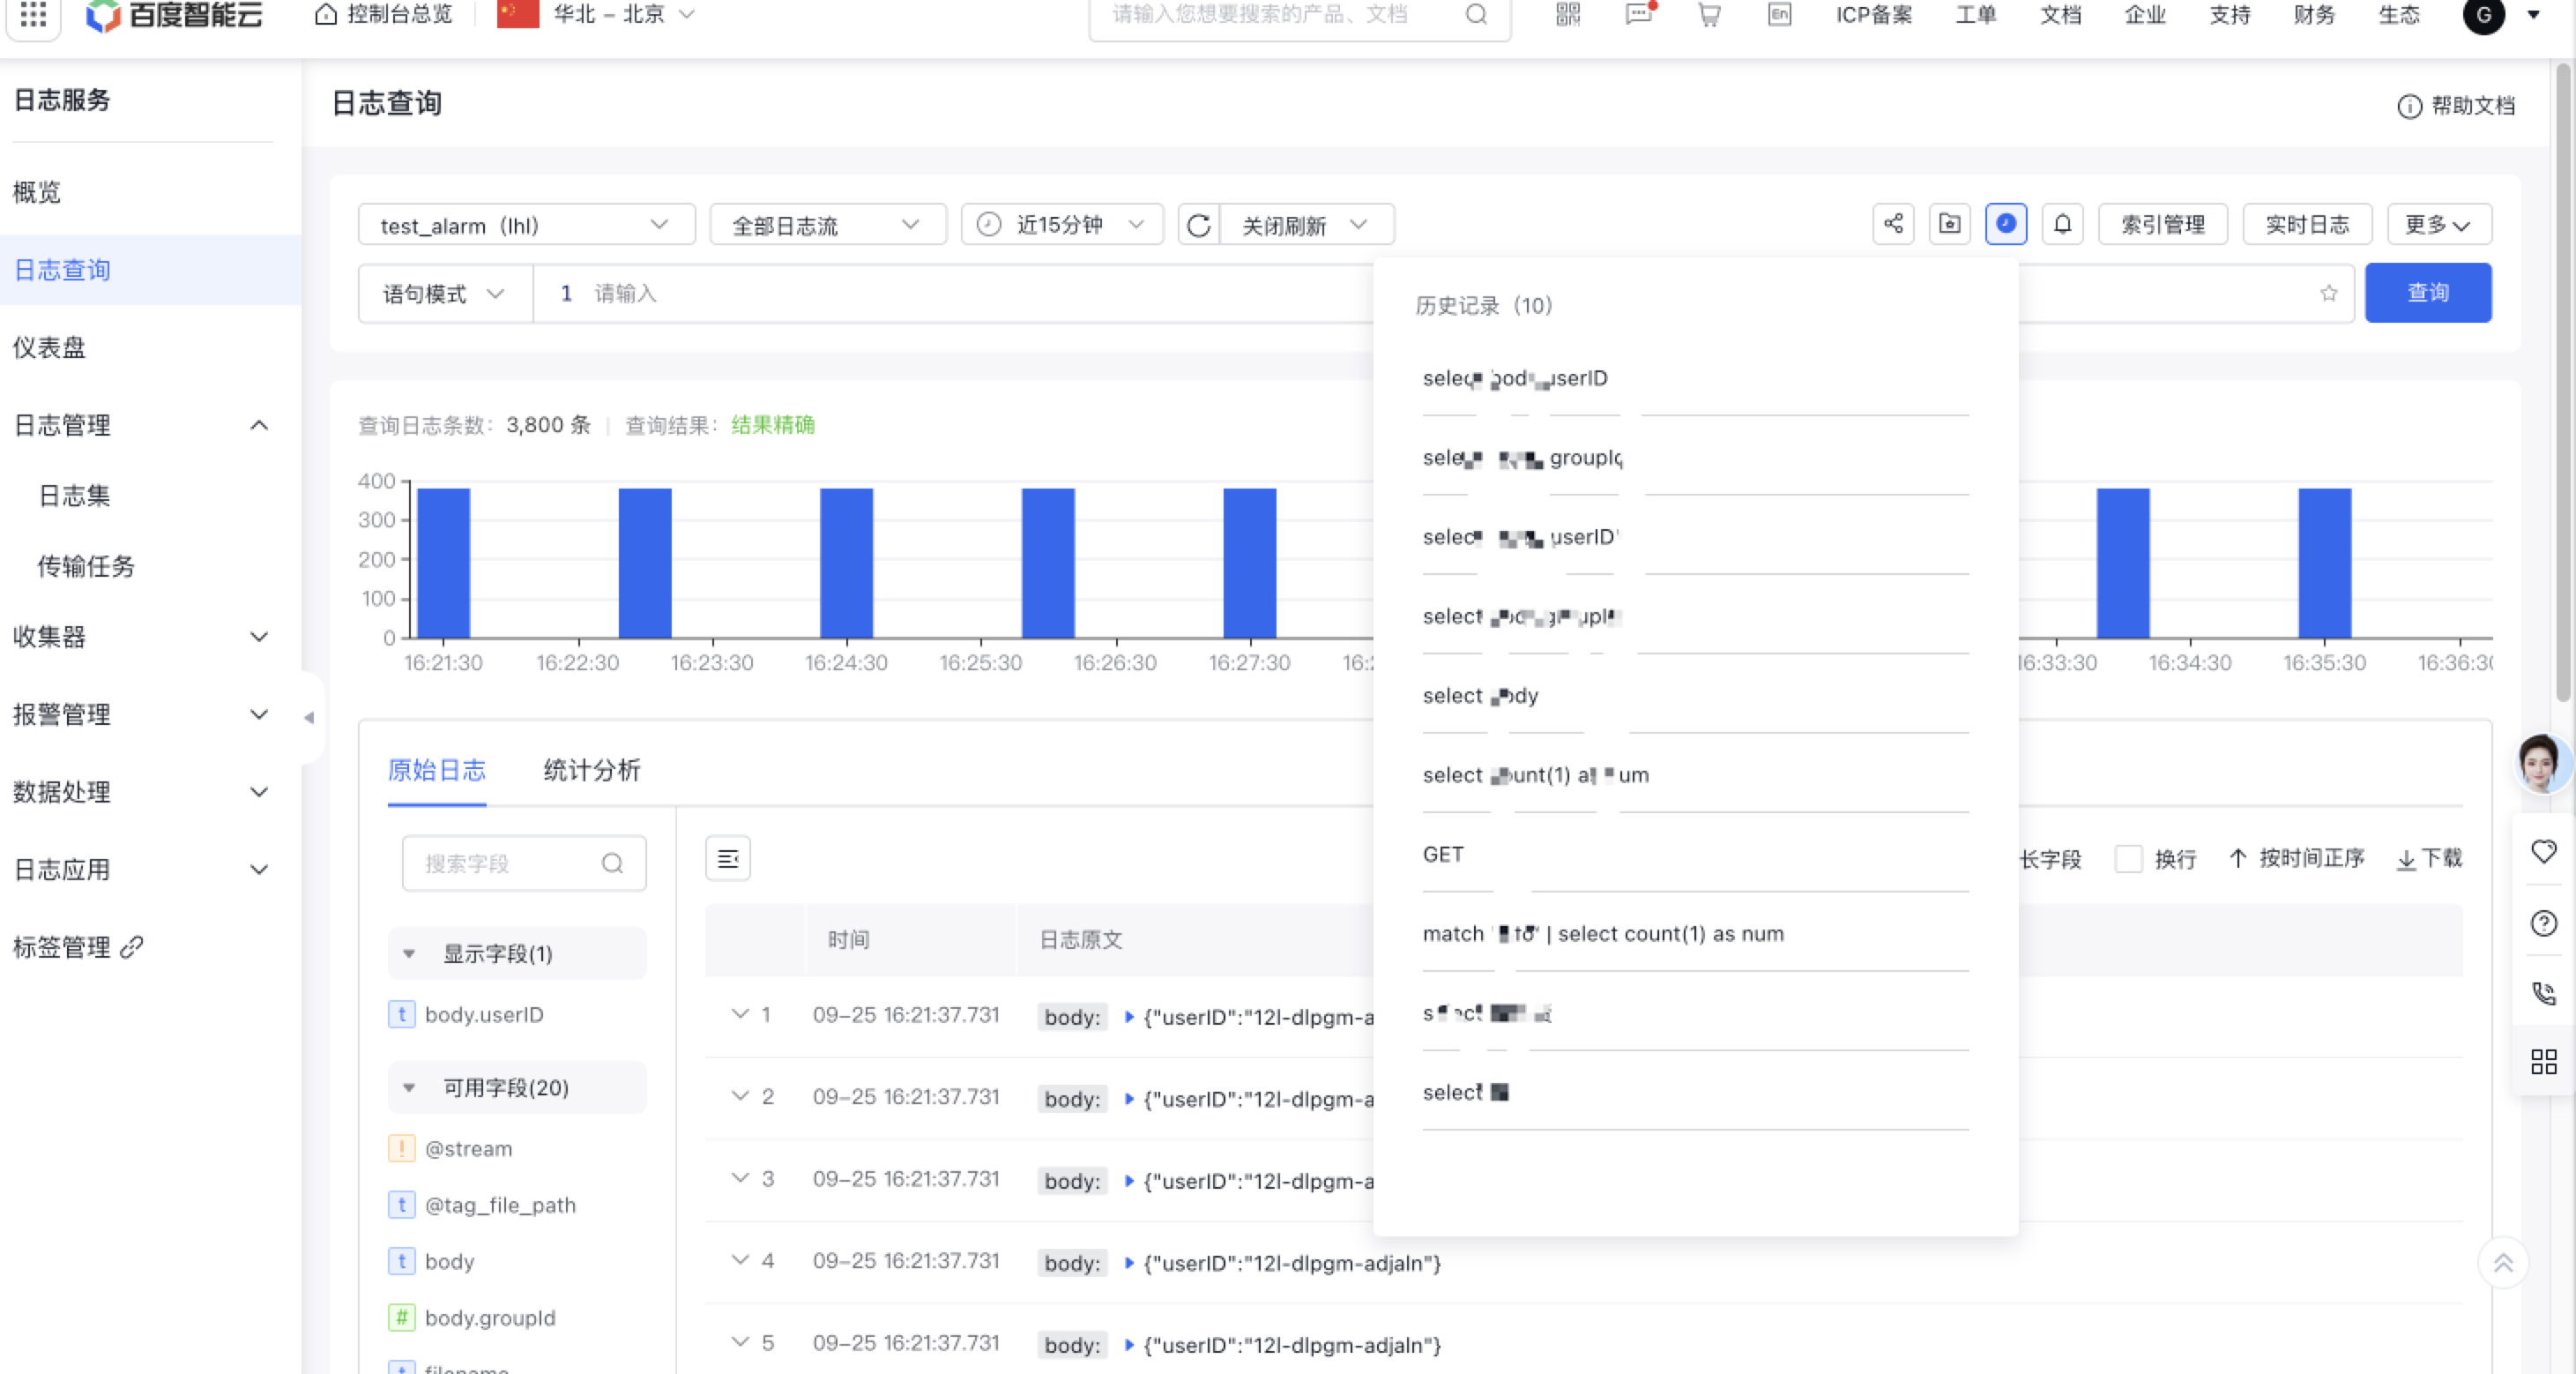 |
| Share link | Support sharing link |
| Quick jump alarm | Click the Jump Alarm icon to bring logstore, and the query statement can quickly redirect to the Alarm Creation page to configure the alarm |
| Support log association redirection | Support log association redirection, allowing redirection to modules such as transmission task, delivery management, scheduled SQL analysis, and alarm management associated with the LogStore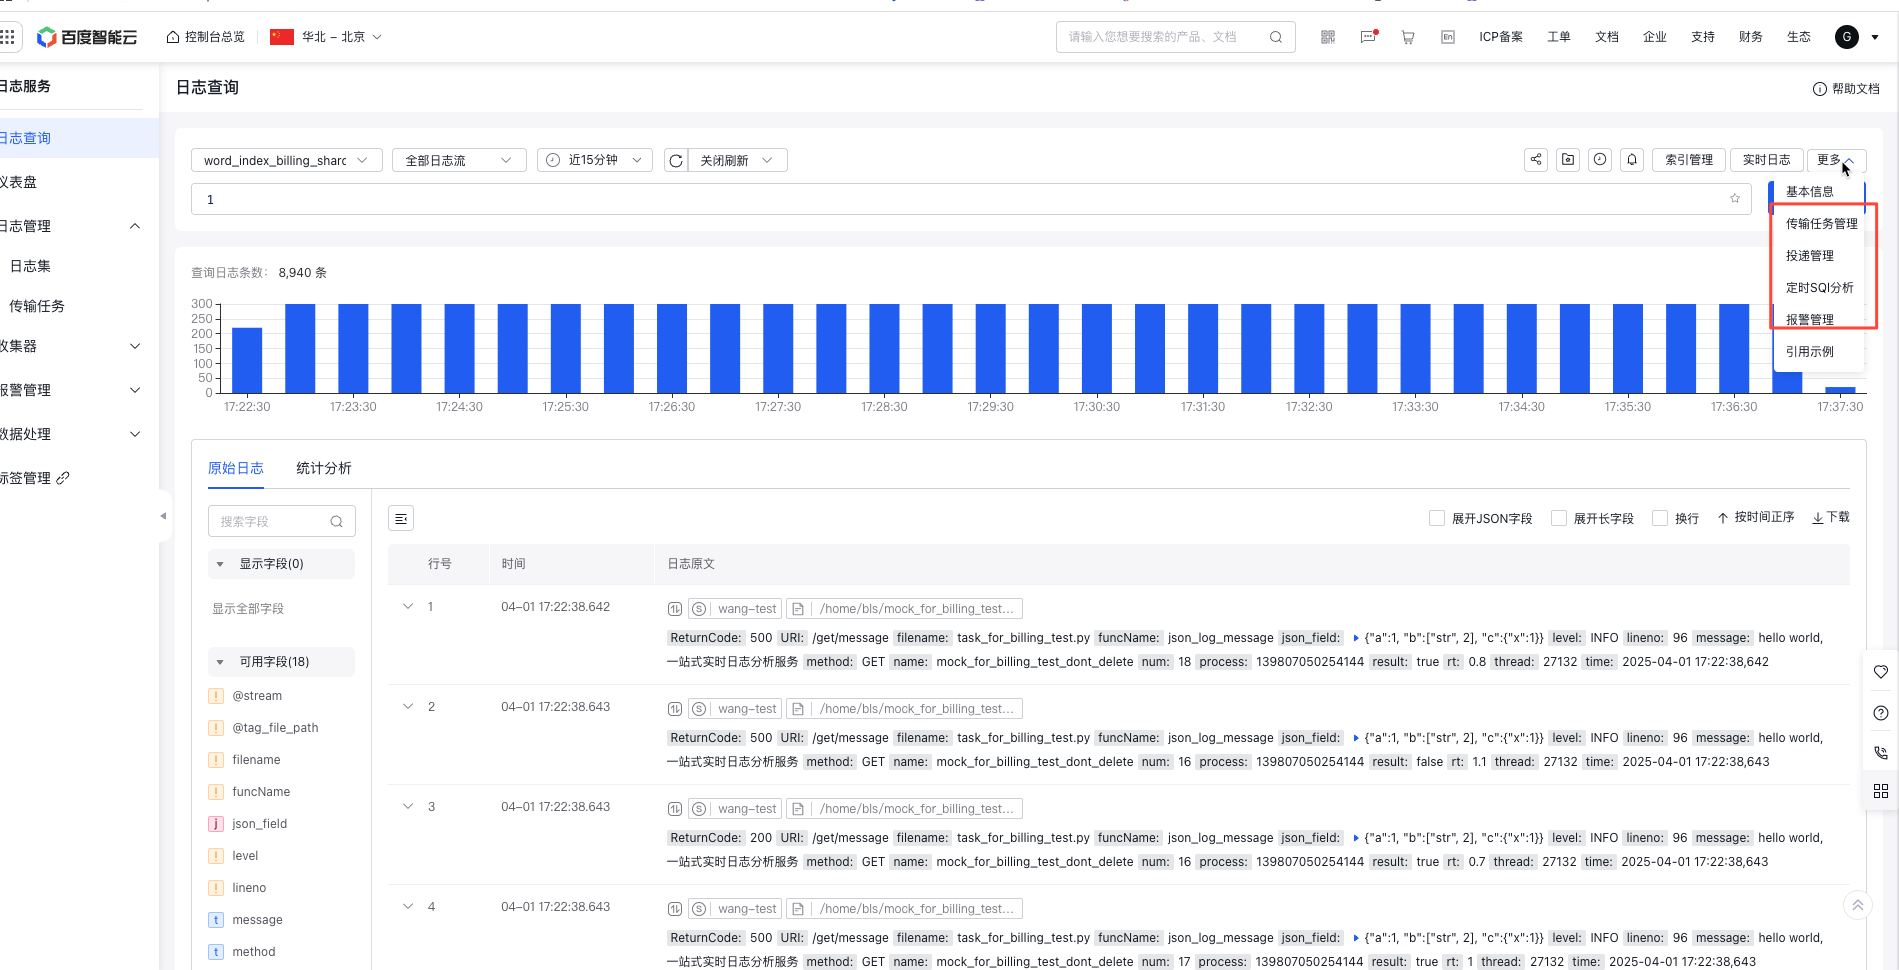 |
| Real-time logs | Support viewing real-time logs with highlighting or filtering specific content  |
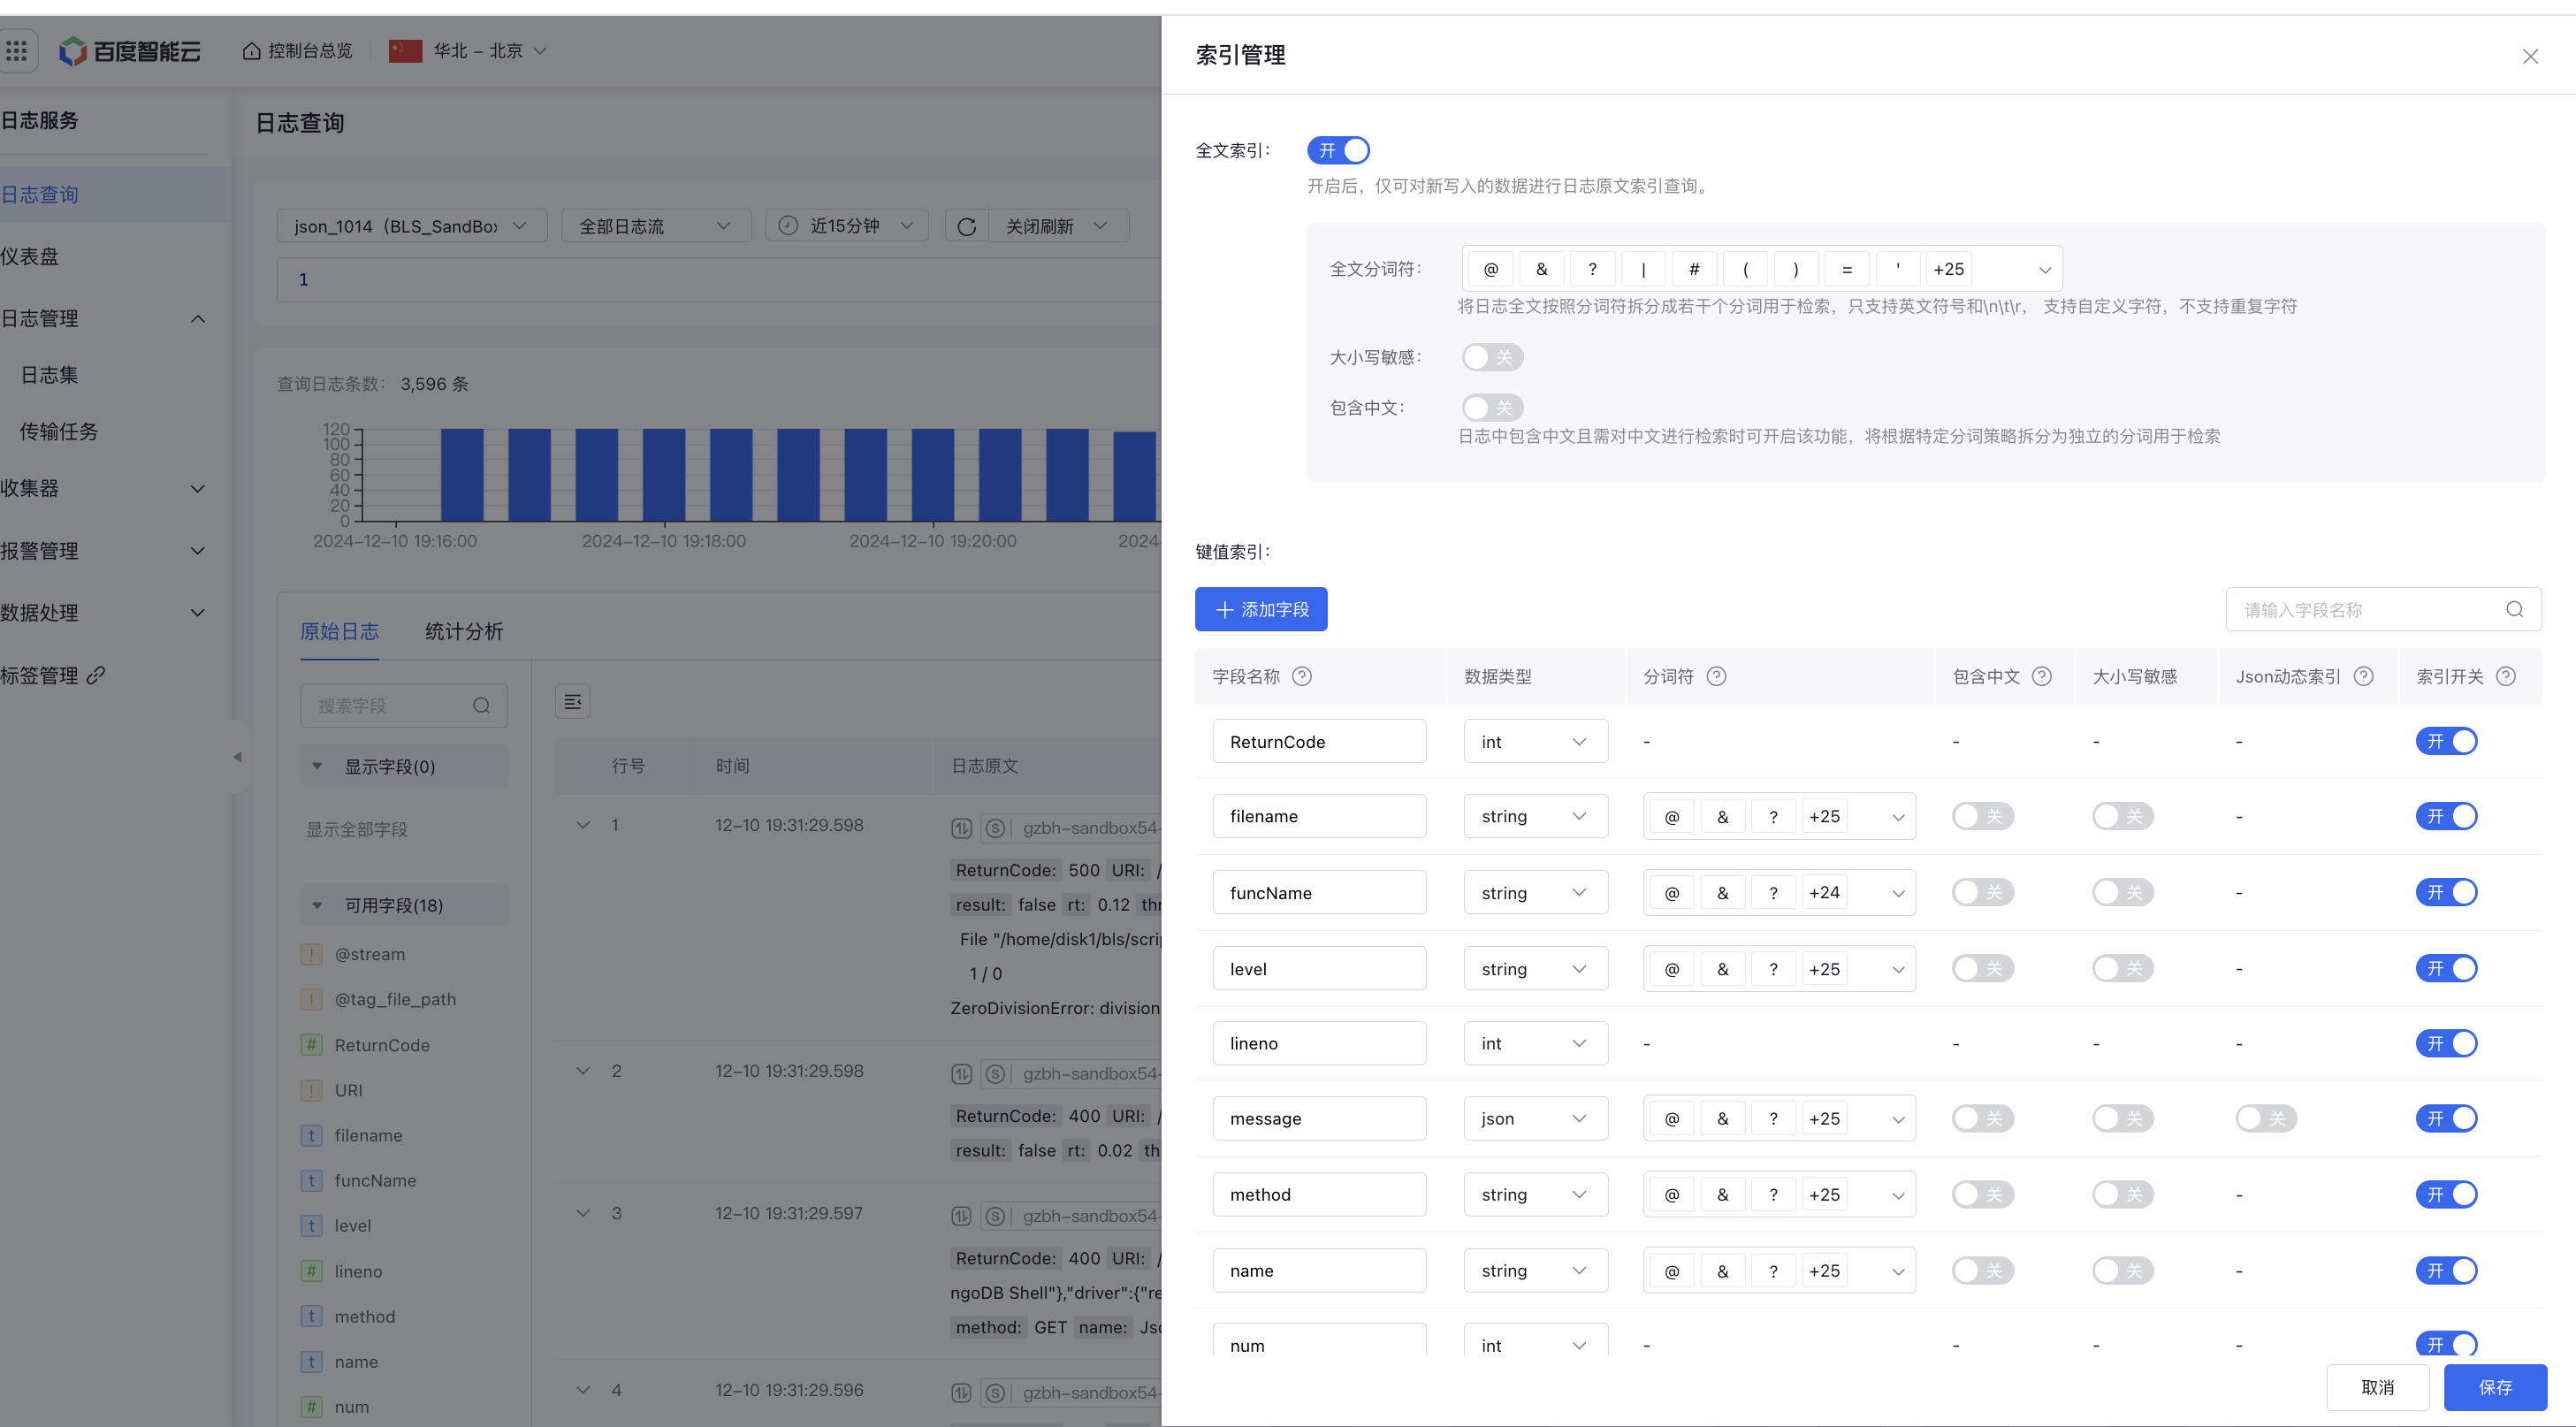
Index configuration
On the Log Query page, you can enable log indexing. Once enabled, keyword searches can be performed on log fields, with SQL queries executed on the search results.
- After clicking Index Configuration, you can directly enable full-text indexing or add key indexing
- Automatically obtain the field list by simply enabling the index switch. If the desired field is not in the list, click Add Field to customize (Note: Custom-added fields without enabled indexing will not be displayed during subsequent edits)
-
After opening the index, you can set the field name, data type, word separator, case sensitivity, inclusion of Chinese, etc.
- Supported data types: string/long/float/bool
- For json-formatted string fields, indexes can be configured in the a.b.c format. For example, message:{"client":"conn281","doc":{"application":{"name":"MongoDB Shell"},"driver":{"result":true}}}, the message.doc.driver index can be configured, and then message.doc.driver can be searched
- The word separator splits the full text of logs into several tokens for search, supporting only English symbols and \n\t\r
- Case Sensitivity: Determine whether searches are case-sensitive. For instance, if the log is level:Error, a case-sensitive search using level:error will not retrieve the log.
- Chinese Content: Enable this feature for fields containing Chinese text. For example, if the log is labeled Baidu AI Cloud, you cannot retrieve it by searching "Baidu" unless this feature is enabled. Once enabled, searching "Baidu" will retrieve the log.
- Json dynamic index: 1. For Json-type fields, you can enable the Json dynamic index switch, which will automatically index all fields in the first three layers of the Json field. 2. The dynamic index subfield only supports match to search field values, that is, it supports key.key1:value1 search, but it does not support key:key1 search. 3. The dynamic index subfield does not support select subfield query, that is, it does not support select key.key1 query.
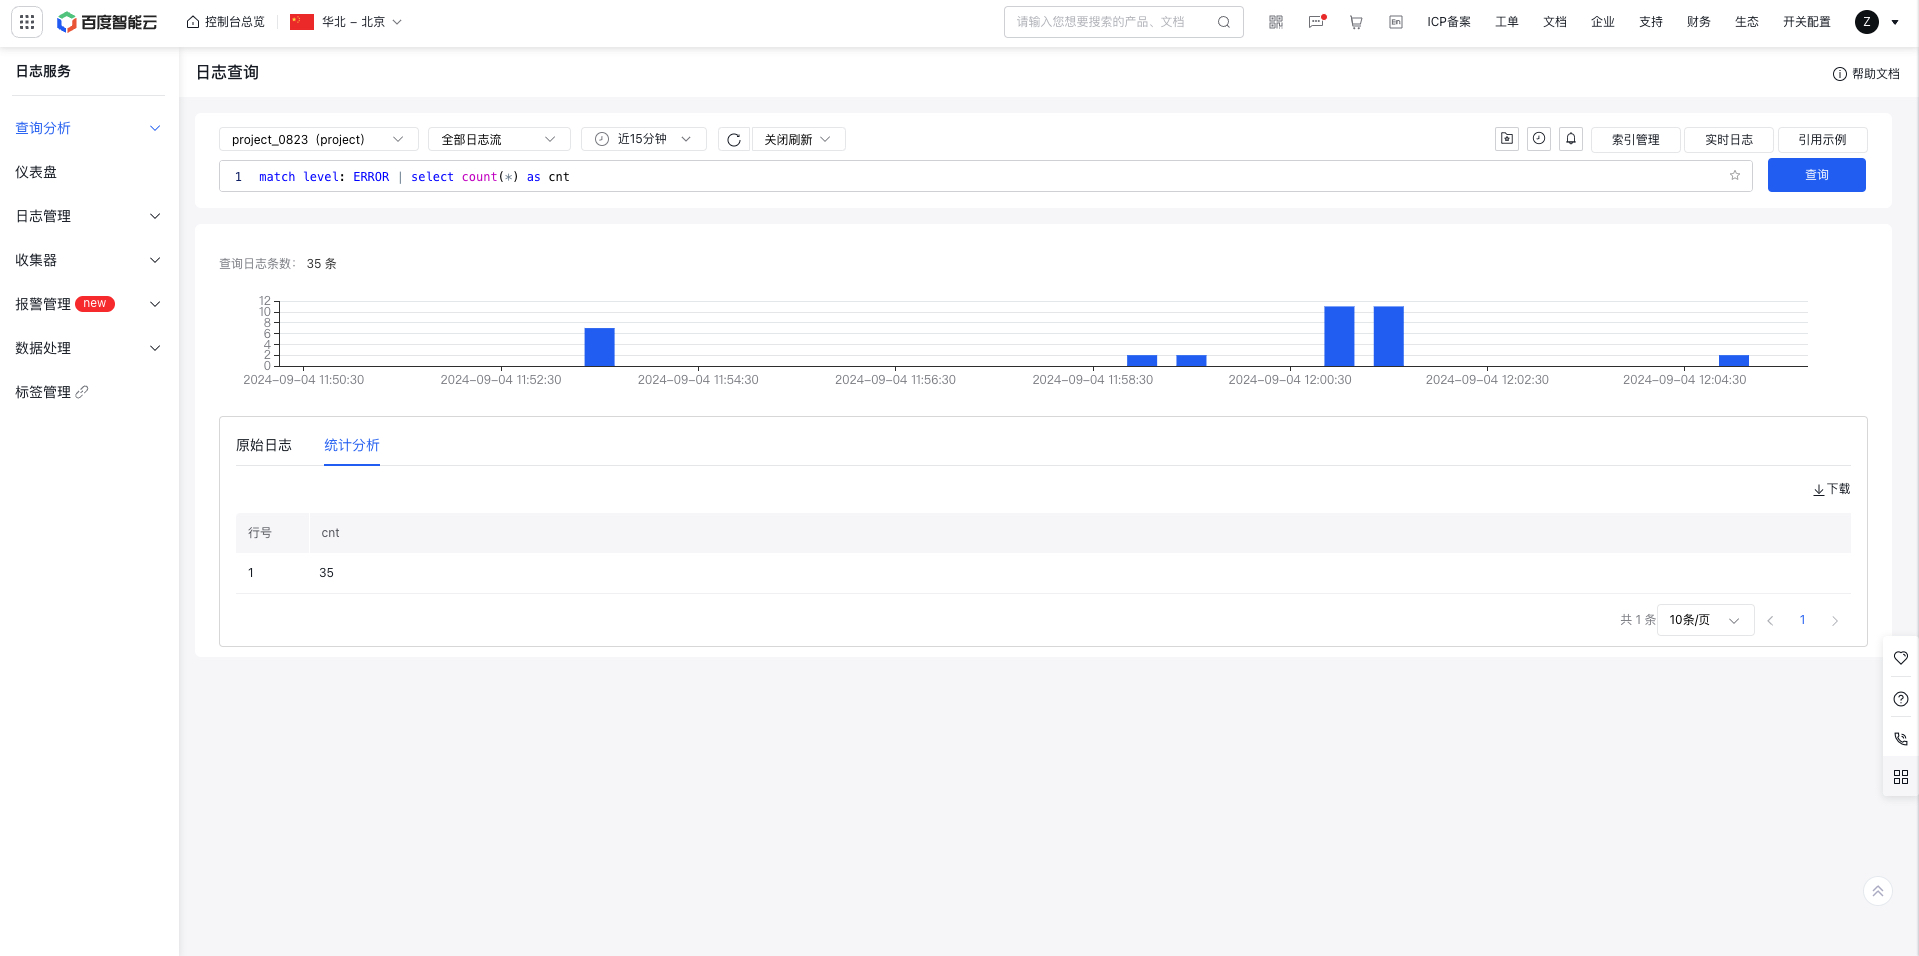
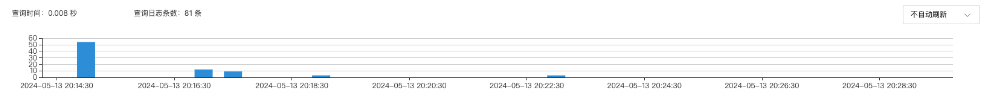
Bar chart
The log distribution histogram displays the time distribution of queried logs. Hovering over the histogram shows the time and log count for each bar.
Query analysis
After enabling indexing, BLS supports log search via Query or SQL query analysis. See Search Syntax for details.
Query statements support three formats, such as:
match search statement: Search log content based on conditions. match is a search syntax keyword (Note: The search statement in match must be configured with relevant indexes. For example, match GET for full-text search requires full-text indexing, match method:GET for field search requires corresponding field-level index, and match * currently requires either full-text indexing or field-level index)SQL statement: Execute SQL statementmatch search statement | SQL statement: Execute SQL statements on the result set that meets the query conditions, with the query statement and SQL statement separated by a vertical bar (Note: If there is a query statement before select, the queried content needs to be configured with relevant indexes; otherwise, an error will be reported)
1. Log Search module

| Function | Description |
|---|---|
| Search | 1. Manually enter a query statement 2 Support interactive query, allowing search syntax configuration via form selection. Single search conditions support AND, OR, and condition group configurations. Multiple search conditions can be configured, with an AND relationship between them |
| Support expanding long fields | By default, long fields exceeding 1000 characters will be collapsed, and the expansion and collapse of long fields can be globally configured |
| Support expanding JSON fields | By default, JSON fields are displayed as long strings. Click to expand JSON fields into a tree view, with one layer of structure expanded by default, such as message field! |
| Field list | 1. Available fields: Retrieve the latest 20 log fields and all configured index fields (parent-child hierarchical index fields will be displayed in available fields, dynamic index child-level fields will not be displayed) 2. Display fields: Click fields in the available fields list to add them to display fields, and only the logs added to display fields will be shown on the right. 3. Index fields support quick statistical analysis of logs 3. Index fields support quick statistical analysis of logs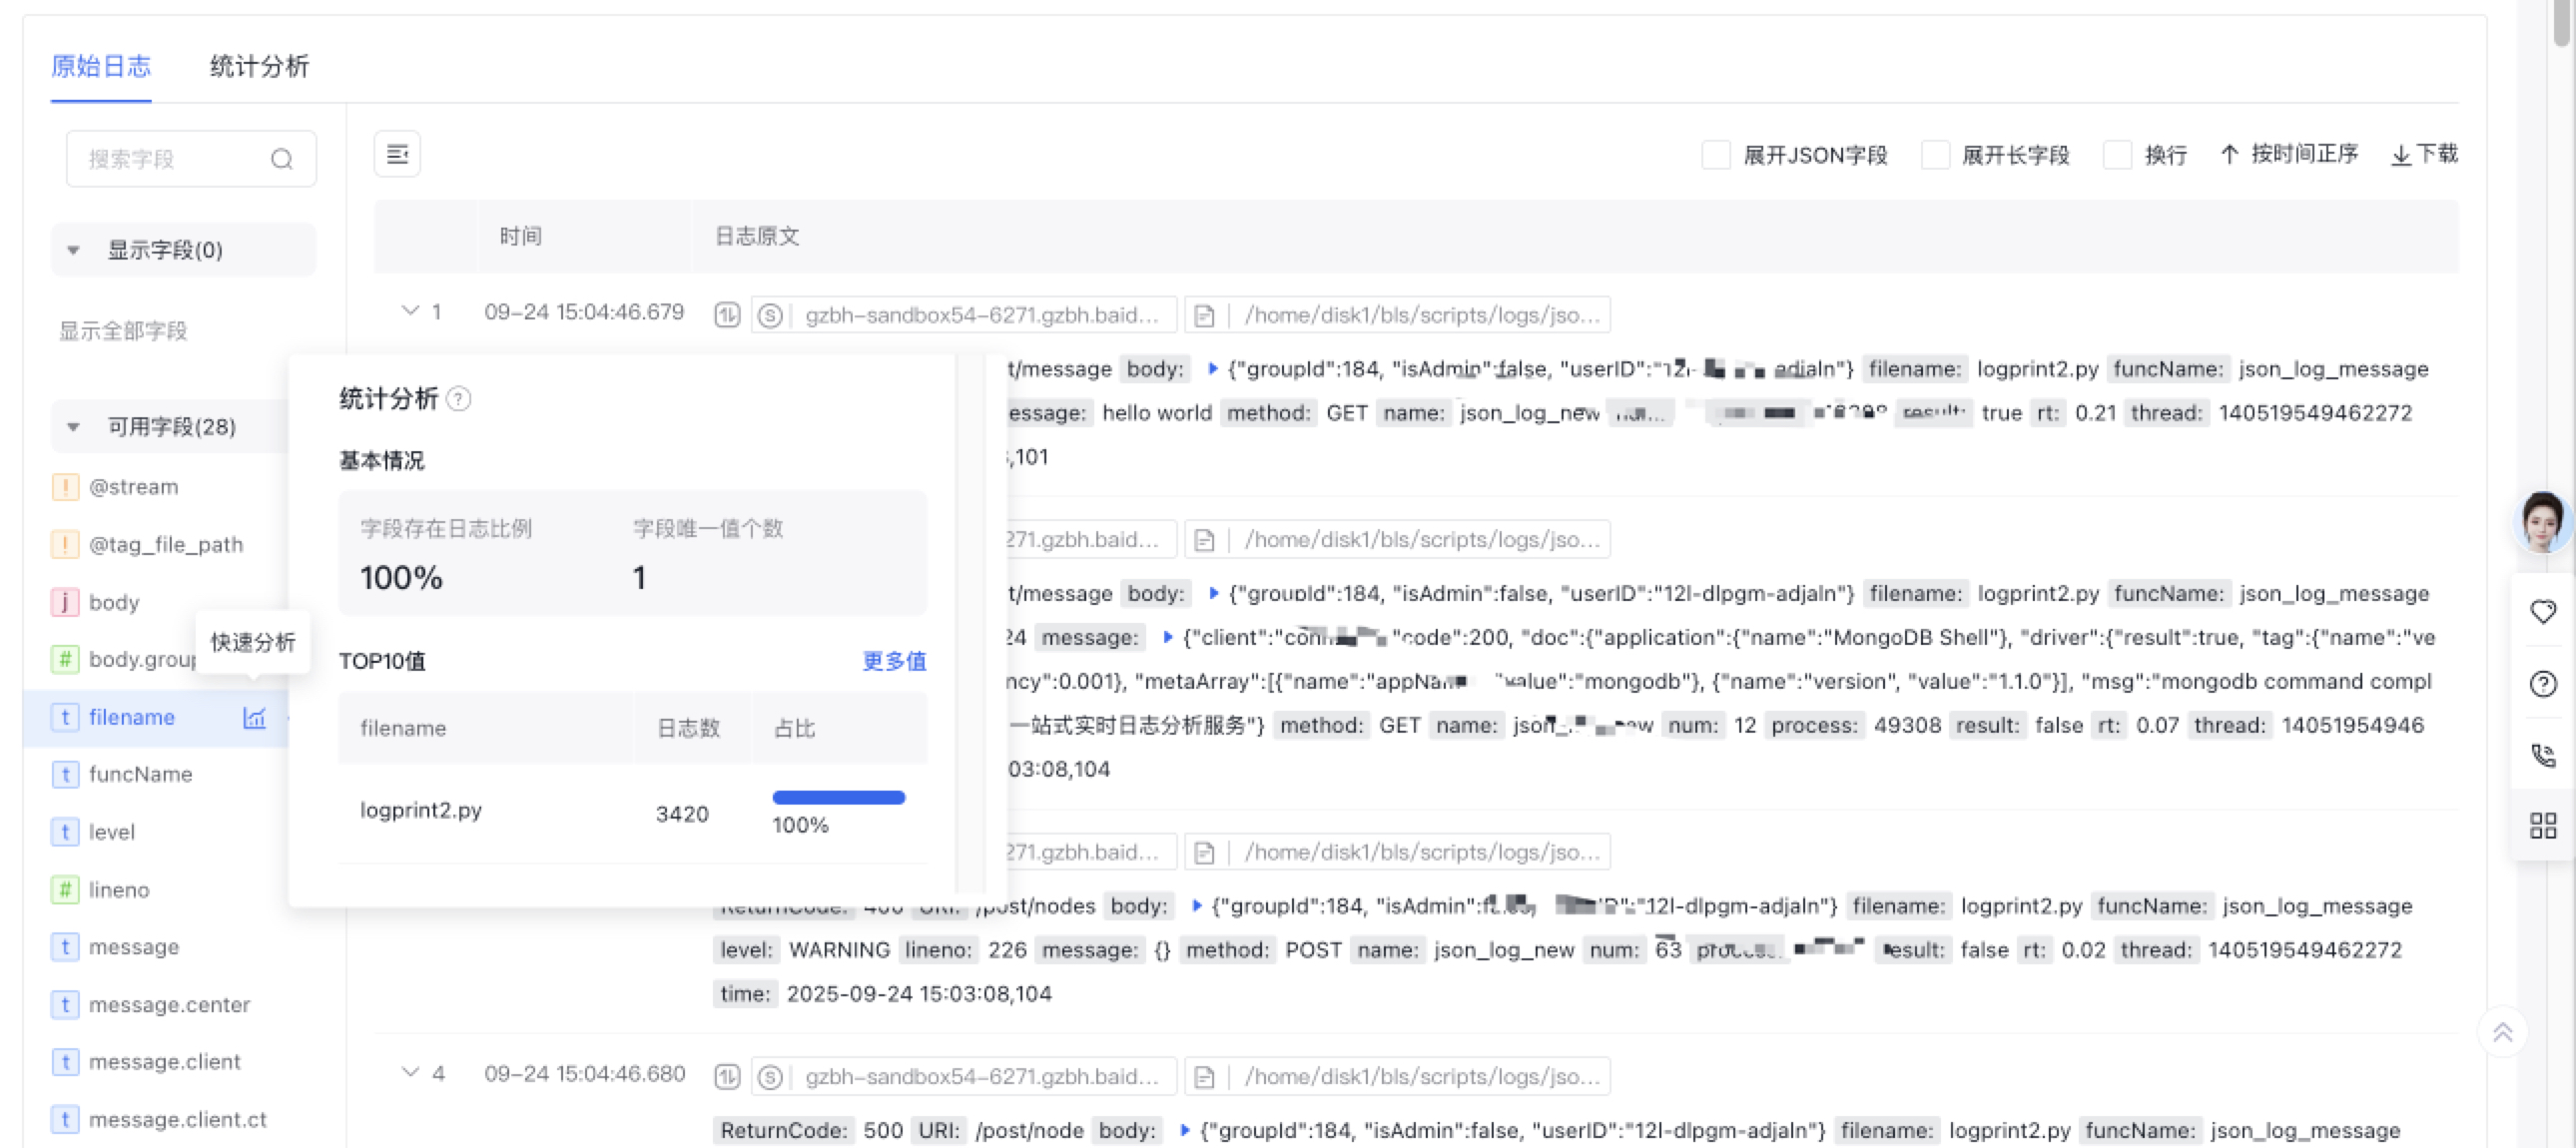 |
| Context log browsing | Support viewing the context information of specified logs in the original file, highlighting or filtering specific content  |
| Data Download | To download query results data locally, click Download to obtain log data in JSON or CSV format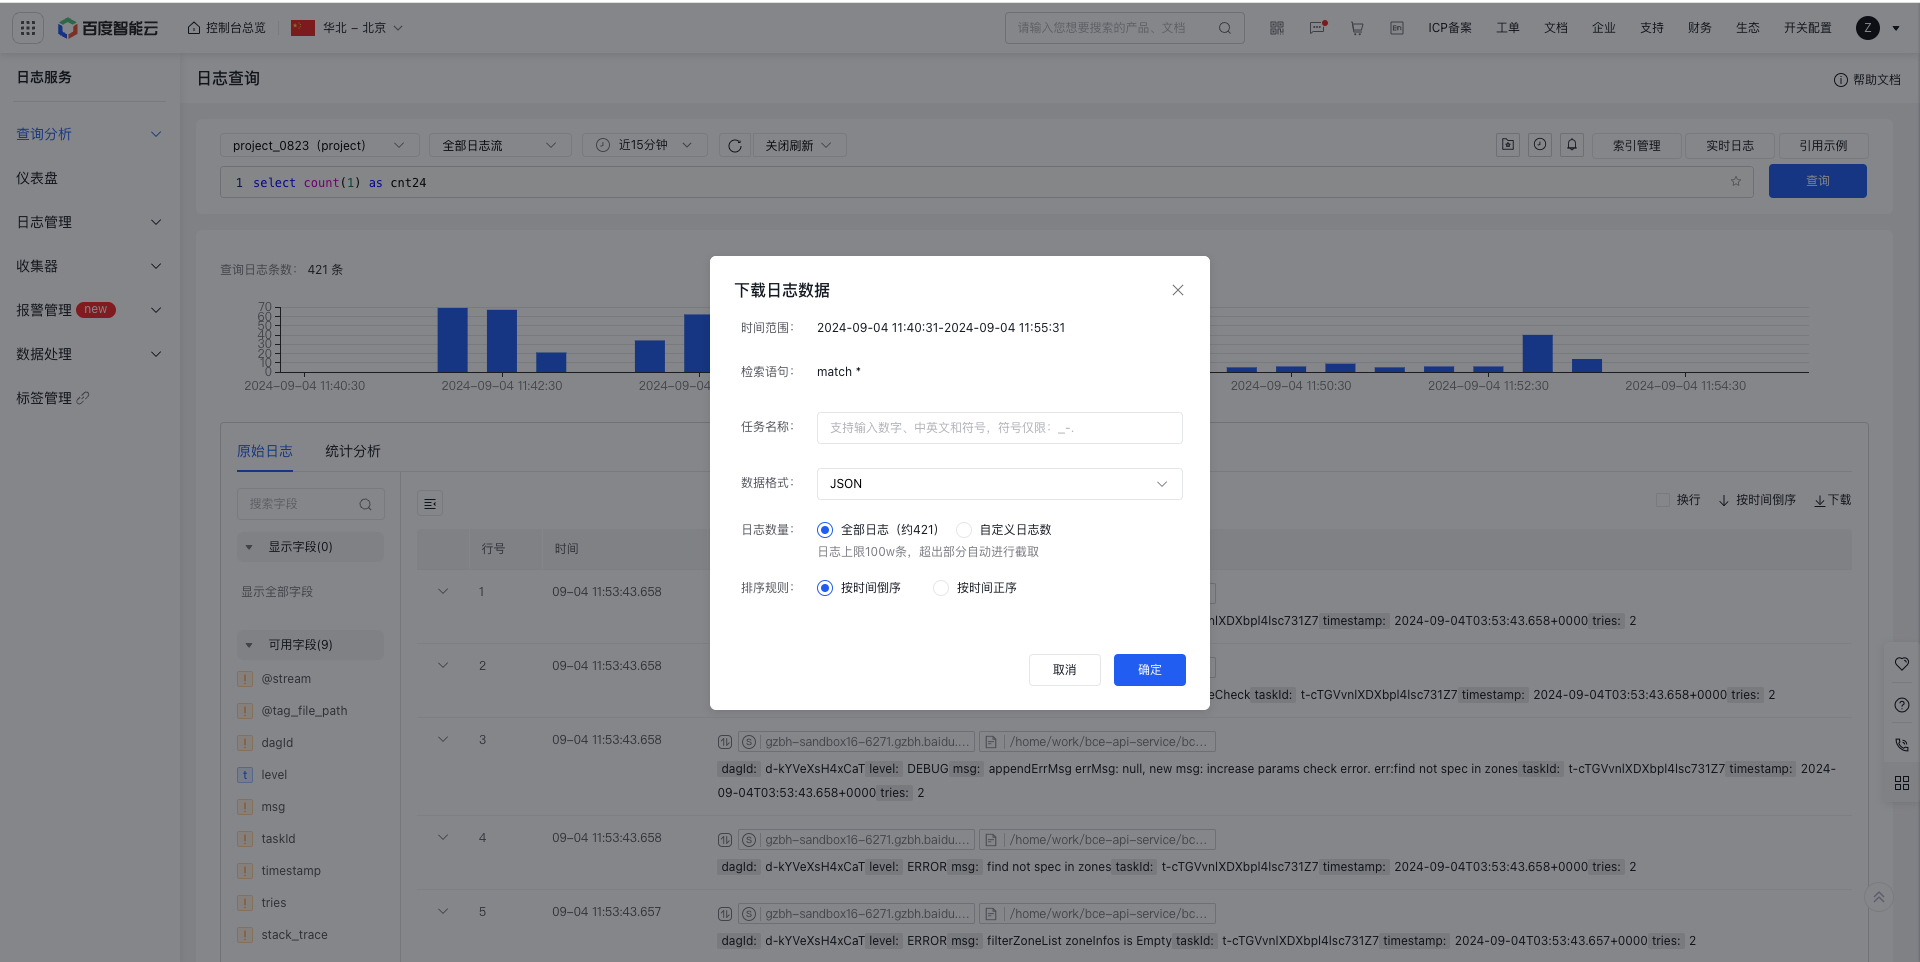 |
2. SQL query analysis
Execute SQL queries directly without search conditions
SQL queries can be executed on the basis of search results.