
Backend
Overview
The backend management feature lets you view and analyze application data, as well as manage form submissions. This makes it easy to monitor app performance and handle form data efficiently.
Backend Management Portal
-
For apps Draft: Go to MeDo → Draft → Preview. At the top of the Preview page, you’ll find the Backend Management portal.
This section is designed for managing test content.


-
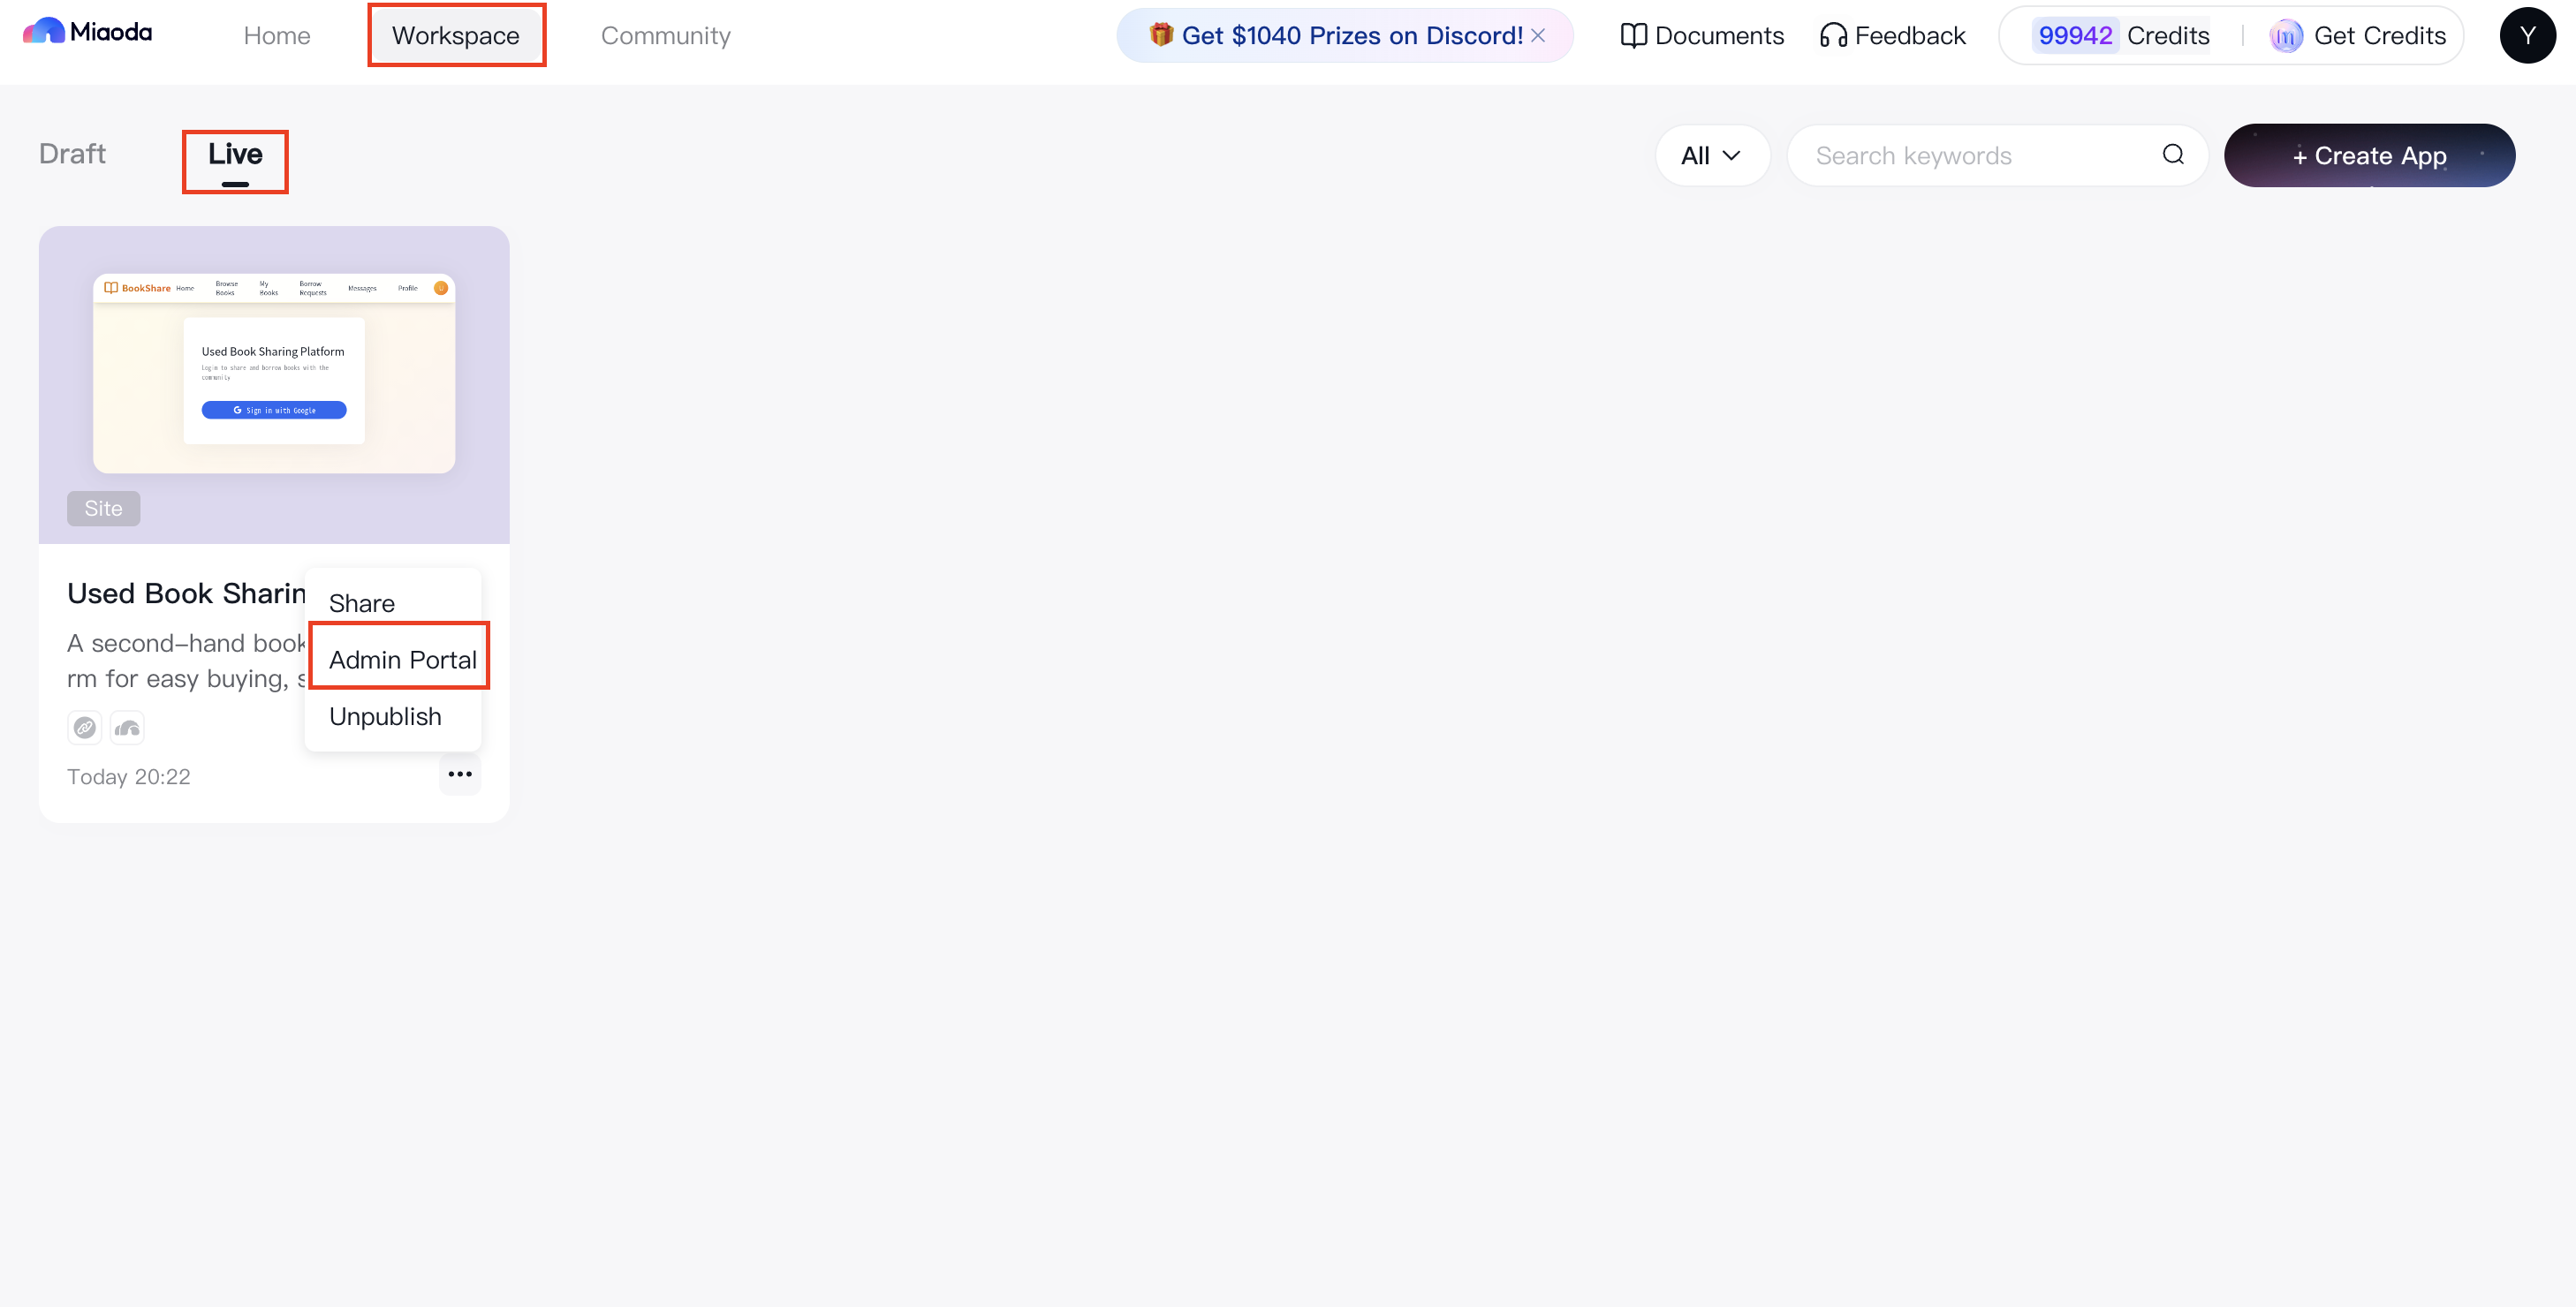
For apps Live: On the Application Card, locate the Admin Portal.
This section is designed for managing production data.
Application Data
For questionnaire-type apps: At the top of the page, you can filter data by date range: Today, Yesterday, Last 7 Days, Last 15 Days, Last 30 Days, or a custom range.

Key Metrics
-
Page Views (PV)
- Definition: Total visits to the questionnaire page.
- Display: Shown in the core data area at the top.
-
Unique Visitors (UV)
- Definition: Number of unique users visiting the page. Multiple visits by the same user in a day are counted once.
- Display: Shown in the core data area.
-
Forms Collected
- Definition: Number of questionnaires successfully submitted.
- Display: Visualized with a donut chart.
-
Average Time on Page (s)
- Definition: Average duration users spend on the questionnaire page, in seconds.
- Display: Shown in the core data area.
Data Visualization
-
Core Metrics Trend
- Type: Line chart
- Content: Trends for PV, UV, forms collected, and average time on page.
-
Device Breakdown
- Type: Donut chart
- Content: Device types used to access the questionnaire.
-
Geographic Distribution
- Type: Map
- Content: Page views by region, with color intensity showing volume.
-
Top 10 Regions by Views
- Type: Bar chart
- Content: Top 10 provinces or cities ranked by page views.
Form Details
All form submissions are securely stored for developers and can be analyzed through charts and reports.
Form Data
Displays user-submitted entries. Developers can delete individual records or export all submissions.
