
邀测版存储计算分离套餐介绍
更新时间:2025-08-20
介绍
百度智能云 Elasticsearch 服务支持开源版和开源增强版两种类型,其中开源增强版是百度智能云基于多年的Elasticsearch管理运维经验,在7.4.2版本的基础上进行了云原生的改造,通过改造我们实现了存储计算分离的架构,允许用户根据情况分别对计算和存储进行扩容,更经济的满足业务的需求。
架构
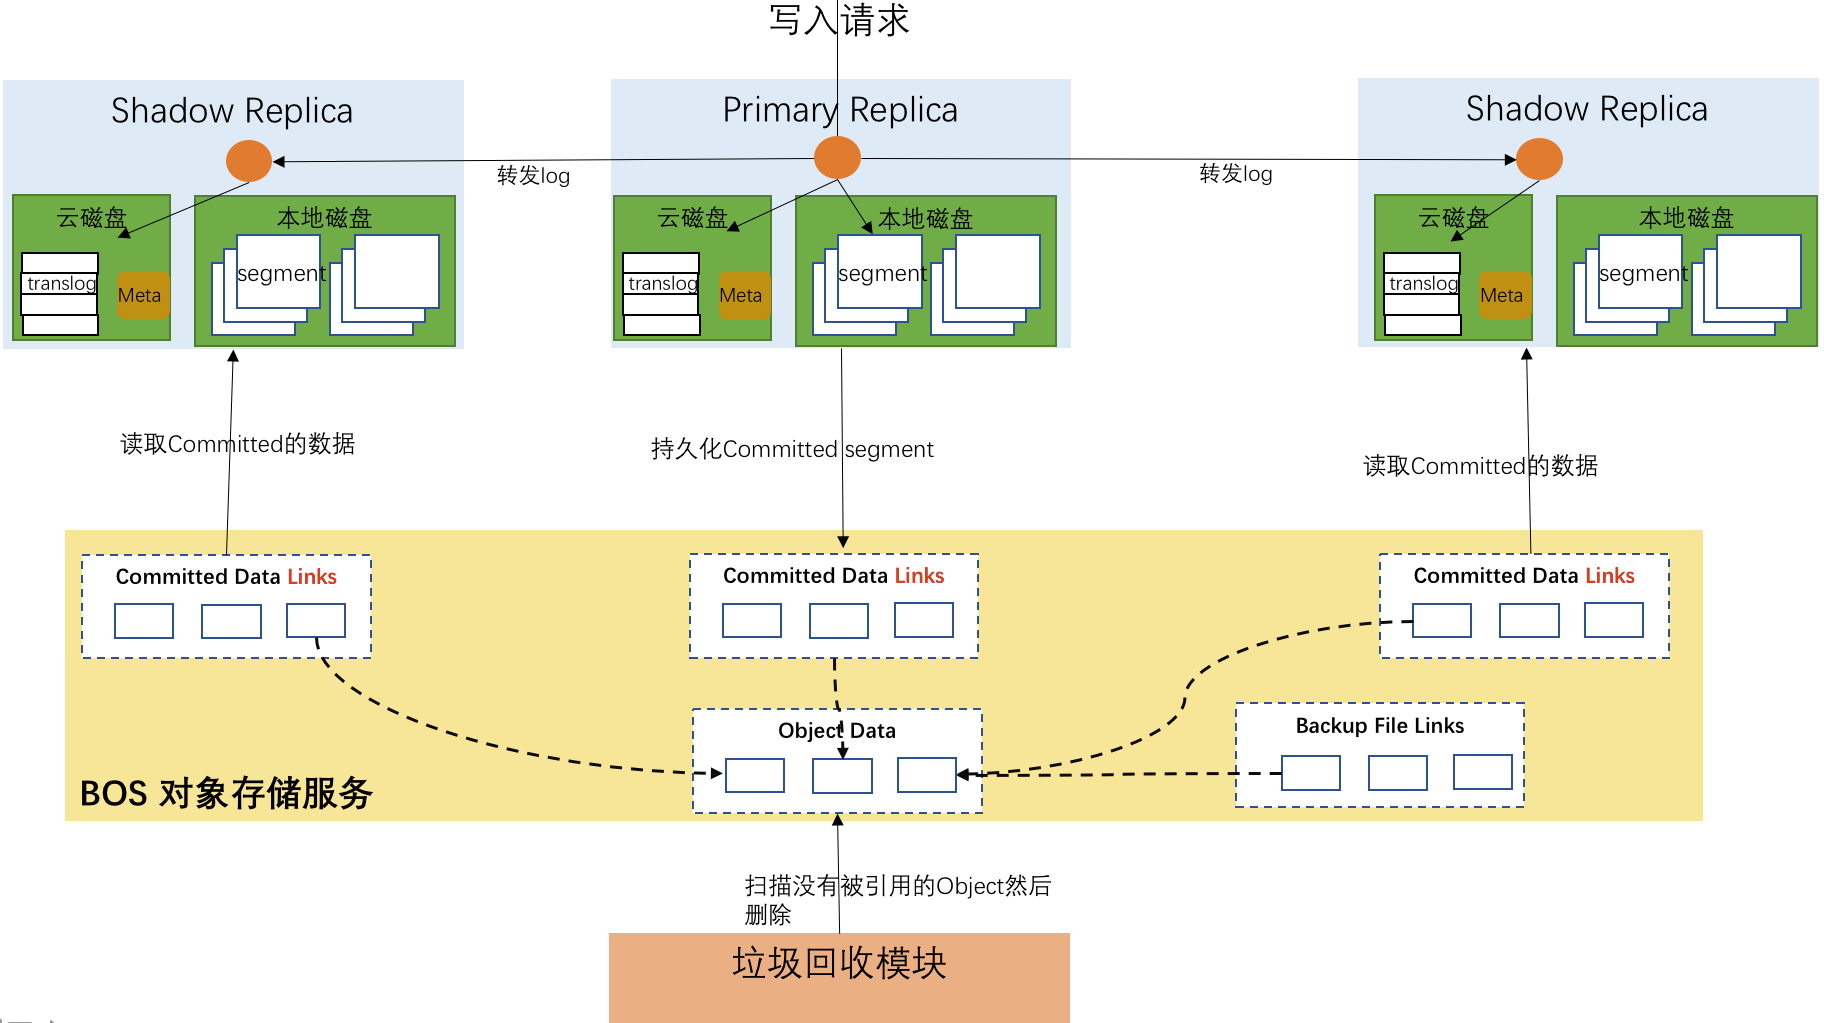
- 计算存储分离:计算节点和存储规模可以独立扩容,更经济的满足用户对不同资源的需求。
- 高可靠:数据持久化存储到对象存储系统中,提供99.99999999%的数据可靠性。
- 高性价比:依靠系统内置的多级存储机制,在保证性能的前提下,某些场景下降低50%以上的成本。
- 高效率:索引分片一写多读,只有主节点执行建立索引的过程,大幅度降低建立索引时的CPU开销。
适用场景:
- 日志分析场景,系统内部自动根据数据的冷热做数据在不同存储介质的移动,降低冷数据的存储成本,同时满足对热数据的查询满足高性能的需求。
- 低延时查询场景,通过适用本地磁盘提供的高速缓存,大幅度降低读取的延时。