
16核32GB512GB计算型的3个数据节点实例基准性能指标
更新时间:2025-08-20
16核32GB512GB计算型的3个数据节点实例基准性能指标
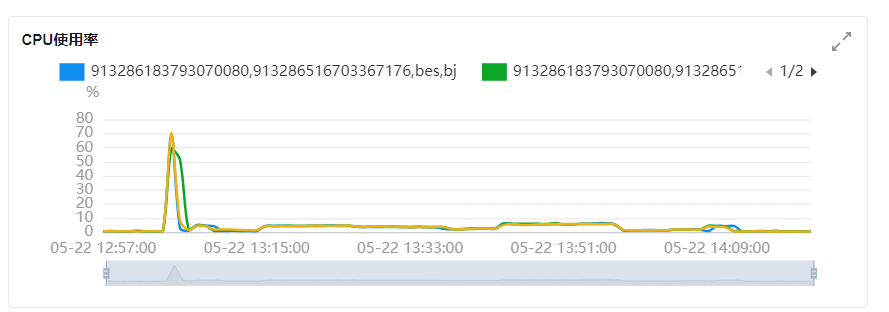
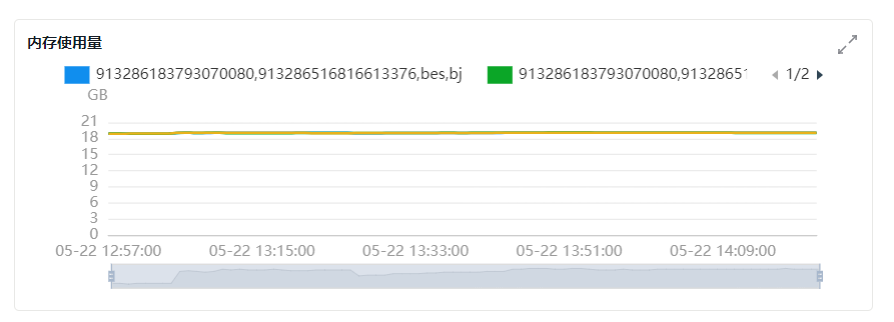
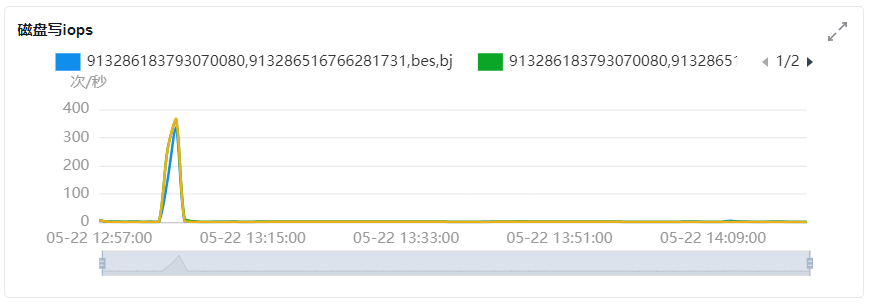
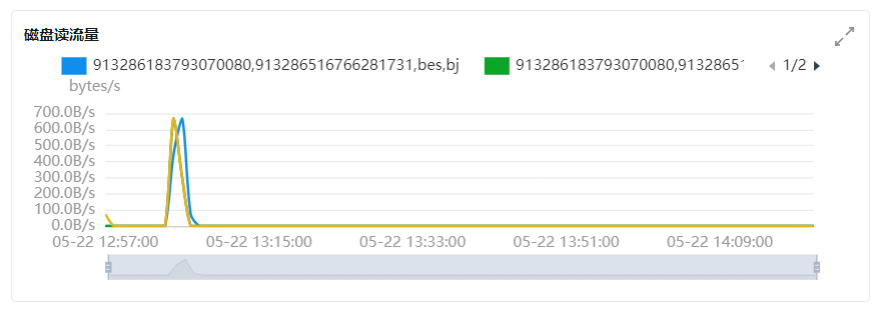
使用ESRally工具对数据节点规格为16核32GB的BES集群实例(7.10.2版本)进行基准测试。
压测配置
| 项目 | 说明 |
|---|---|
| 实例配置 | 版本:BES集群实例(7.10.2版本) 数据节点规格:16核32GB 数据节点存储性能级别:增强型SSD_PL1 数据单节点存储空间:512GB 数据节点数量:3个 |
| ESRally配置 | 使用ESRally的默认配置tracks。 |
| 数据集 | 使用ESRally的预置数据集Geonames模拟测试场景,数据文档总数11396503。获取数据集,请查看ES Rally Hub获取。 |
| 分片数 | 主分片:6 副本数:0 |
| bulk_size | 每次批量操作提交5000个文档。 |
| bulk_indexing_clients | 同时执行批量索引操作的客户端数量为8个。 |
| index_append warmup time | 从默认的120s修改为30s,当集群配置高时,index_append在预热启动期间就完成了。 |
压测结果
压测结果仅供参考,无法代表实际生产中写入查询情况,建议您结合业务生产数据进行压测。
主要压测指标结果
基准压测报告
| Metric | Task | Value | Unit |
|---|---|---|---|
| Cumulative indexing time of primary shards | 10.9337 | min | |
| Min cumulative indexing time across primary shards | 1.83442 | min | |
| Median cumulative indexing time across primary shards | 2.28088 | min | |
| Max cumulative indexing time across primary shards | 2.28988 | min | |
| Cumulative indexing throttle time of primary shards | 0 | min | |
| Min cumulative indexing throttle time across primary shards | 0 | min | |
| Median cumulative indexing throttle time across primary shards | 0 | min | |
| Max cumulative indexing throttle time across primary shards | 0 | min | |
| Cumulative merge time of primary shards | 3.31318 | min | |
| Cumulative merge count of primary shards | 30 | ||
| Min cumulative merge time across primary shards | 0.541267 | min | |
| Median cumulative merge time across primary shards | 0.689833 | min | |
| Max cumulative merge time across primary shards | 0.72115 | min | |
| Cumulative merge throttle time of primary shards | 1.07413 | min | |
| Min cumulative merge throttle time across primary shards | 0.1705 | min | |
| Median cumulative merge throttle time across primary shards | 0.223183 | min | |
| Max cumulative merge throttle time across primary shards | 0.252783 | min | |
| Cumulative refresh time of primary shards | 0.733233 | min | |
| Cumulative refresh count of primary shards | 76 | ||
| Min cumulative refresh time across primary shards | 0.120533 | min | |
| Median cumulative refresh time across primary shards | 0.147433 | min | |
| Max cumulative refresh time across primary shards | 0.160433 | min | |
| Cumulative flush time of primary shards | 0.15545 | min | |
| Cumulative flush count of primary shards | 10 | ||
| Min cumulative flush time across primary shards | 0.0209167 | min | |
| Median cumulative flush time across primary shards | 0.0305333 | min | |
| Max cumulative flush time across primary shards | 0.0381667 | min | |
| Total Young Gen GC time | 3.28 | s | |
| Total Young Gen GC count | 615 | ||
| Total Old Gen GC time | 0 | s | |
| Total Old Gen GC count | 0 | ||
| Store size | 3.10479 | GB | |
| Translog size | 2.56114e-07 | GB | |
| Heap used for segments | 0.622139 | MB | |
| Heap used for doc values | 0.024971 | MB | |
| Heap used for terms | 0.487488 | MB | |
| Heap used for norms | 0.0663452 | MB | |
| Heap used for points | 0 | MB | |
| Heap used for stored fields | 0.043335 | MB | |
| Segment count | 84 | ||
| Total Ingest Pipeline count | 0 | ||
| Total Ingest Pipeline time | 0 | s | |
| Total Ingest Pipeline failed | 0 | ||
| Min Throughput | index-append | 251959 | docs/s |
| Mean Throughput | index-append | 258644 | docs/s |
| Median Throughput | index-append | 258336 | docs/s |
| Max Throughput | index-append | 265359 | docs/s |
| 50th percentile latency | index-append | 95.672 | ms |
| 90th percentile latency | index-append | 260.095 | ms |
| 99th percentile latency | index-append | 1130.76 | ms |
| 100th percentile latency | index-append | 1534.71 | ms |
| 50th percentile service time | index-append | 95.672 | ms |
| 90th percentile service time | index-append | 260.095 | ms |
| 99th percentile service time | index-append | 1130.76 | ms |
| 100th percentile service time | index-append | 1534.71 | ms |
| error rate | index-append | 0 | % |
| Min Throughput | index-stats | 90.04 | ops/s |
| Mean Throughput | index-stats | 90.06 | ops/s |
| Median Throughput | index-stats | 90.06 | ops/s |
| Max Throughput | index-stats | 90.1 | ops/s |
| 50th percentile latency | index-stats | 2.66644 | ms |
| 90th percentile latency | index-stats | 3.49003 | ms |
| 99th percentile latency | index-stats | 3.81744 | ms |
| 99.9th percentile latency | index-stats | 3.94127 | ms |
| 100th percentile latency | index-stats | 4.16882 | ms |
| 50th percentile service time | index-stats | 1.35649 | ms |
| 90th percentile service time | index-stats | 1.48534 | ms |
| 99th percentile service time | index-stats | 1.71008 | ms |
| 99.9th percentile service time | index-stats | 2.00326 | ms |
| 100th percentile service time | index-stats | 2.01654 | ms |
| error rate | index-stats | 0 | % |
| Min Throughput | node-stats | 89.92 | ops/s |
| Mean Throughput | node-stats | 90.08 | ops/s |
| Median Throughput | node-stats | 90.06 | ops/s |
| Max Throughput | node-stats | 90.28 | ops/s |
| 50th percentile latency | node-stats | 2.69308 | ms |
| 90th percentile latency | node-stats | 4.06851 | ms |
| 99th percentile latency | node-stats | 4.44659 | ms |
| 99.9th percentile latency | node-stats | 5.12146 | ms |
| 100th percentile latency | node-stats | 11.7301 | ms |
| 50th percentile service time | node-stats | 1.78248 | ms |
| 90th percentile service time | node-stats | 1.9183 | ms |
| 99th percentile service time | node-stats | 2.66963 | ms |
| 99.9th percentile service time | node-stats | 3.21213 | ms |
| 100th percentile service time | node-stats | 3.3223 | ms |
| error rate | node-stats | 0 | % |
| Min Throughput | default | 50.03 | ops/s |
| Mean Throughput | default | 50.04 | ops/s |
| Median Throughput | default | 50.04 | ops/s |
| Max Throughput | default | 50.07 | ops/s |
| 50th percentile latency | default | 3.13588 | ms |
| 90th percentile latency | default | 4.15946 | ms |
| 99th percentile latency | default | 4.53467 | ms |
| 99.9th percentile latency | default | 4.89849 | ms |
| 100th percentile latency | default | 5.43421 | ms |
| 50th percentile service time | default | 1.79154 | ms |
| 90th percentile service time | default | 2.01733 | ms |
| 99th percentile service time | default | 2.32979 | ms |
| 99.9th percentile service time | default | 3.18136 | ms |
| 100th percentile service time | default | 4.06553 | ms |
| error rate | default | 0 | % |
| Min Throughput | term | 100.04 | ops/s |
| Mean Throughput | term | 100.06 | ops/s |
| Median Throughput | term | 100.06 | ops/s |
| Max Throughput | term | 100.12 | ops/s |
| 50th percentile latency | term | 2.48851 | ms |
| 90th percentile latency | term | 2.98729 | ms |
| 99th percentile latency | term | 4.01516 | ms |
| 99.9th percentile latency | term | 50.5892 | ms |
| 100th percentile latency | term | 57.6077 | ms |
| 50th percentile service time | term | 1.61853 | ms |
| 90th percentile service time | term | 1.82886 | ms |
| 99th percentile service time | term | 2.15978 | ms |
| 99.9th percentile service time | term | 9.5199 | ms |
| 100th percentile service time | term | 56.8846 | ms |
| error rate | term | 0 | % |
| Min Throughput | phrase | 110.02 | ops/s |
| Mean Throughput | phrase | 110.04 | ops/s |
| Median Throughput | phrase | 110.04 | ops/s |
| Max Throughput | phrase | 110.07 | ops/s |
| 50th percentile latency | phrase | 2.60092 | ms |
| 90th percentile latency | phrase | 3.06541 | ms |
| 99th percentile latency | phrase | 3.74038 | ms |
| 99.9th percentile latency | phrase | 14.5582 | ms |
| 100th percentile latency | phrase | 18.6079 | ms |
| 50th percentile service time | phrase | 1.71315 | ms |
| 90th percentile service time | phrase | 1.90559 | ms |
| 99th percentile service time | phrase | 2.34588 | ms |
| 99.9th percentile service time | phrase | 13.7218 | ms |
| 100th percentile service time | phrase | 17.7622 | ms |
| error rate | phrase | 0 | % |
| Min Throughput | country_agg_uncached | 3.01 | ops/s |
| Mean Throughput | country_agg_uncached | 3.01 | ops/s |
| Median Throughput | country_agg_uncached | 3.01 | ops/s |
| Max Throughput | country_agg_uncached | 3.01 | ops/s |
| 50th percentile latency | country_agg_uncached | 130.727 | ms |
| 90th percentile latency | country_agg_uncached | 150.799 | ms |
| 99th percentile latency | country_agg_uncached | 160.816 | ms |
| 100th percentile latency | country_agg_uncached | 178.802 | ms |
| 50th percentile service time | country_agg_uncached | 129.429 | ms |
| 90th percentile service time | country_agg_uncached | 149.228 | ms |
| 99th percentile service time | country_agg_uncached | 159.495 | ms |
| 100th percentile service time | country_agg_uncached | 177.503 | ms |
| error rate | country_agg_uncached | 0 | % |
| Min Throughput | country_agg_cached | 98.89 | ops/s |
| Mean Throughput | country_agg_cached | 99.18 | ops/s |
| Median Throughput | country_agg_cached | 99.21 | ops/s |
| Max Throughput | country_agg_cached | 99.39 | ops/s |
| 50th percentile latency | country_agg_cached | 2.49958 | ms |
| 90th percentile latency | country_agg_cached | 3.8216 | ms |
| 99th percentile latency | country_agg_cached | 4.71775 | ms |
| 99.9th percentile latency | country_agg_cached | 5.29509 | ms |
| 100th percentile latency | country_agg_cached | 5.70463 | ms |
| 50th percentile service time | country_agg_cached | 1.57903 | ms |
| 90th percentile service time | country_agg_cached | 2.80845 | ms |
| 99th percentile service time | country_agg_cached | 3.3994 | ms |
| 99.9th percentile service time | country_agg_cached | 4.44264 | ms |
| 100th percentile service time | country_agg_cached | 4.48943 | ms |
| error rate | country_agg_cached | 0 | % |
| Min Throughput | scroll | 20.05 | pages/s |
| Mean Throughput | scroll | 20.07 | pages/s |
| Median Throughput | scroll | 20.06 | pages/s |
| Max Throughput | scroll | 20.08 | pages/s |
| 50th percentile latency | scroll | 204.928 | ms |
| 90th percentile latency | scroll | 209.259 | ms |
| 99th percentile latency | scroll | 218.198 | ms |
| 100th percentile latency | scroll | 218.331 | ms |
| 50th percentile service time | scroll | 202.573 | ms |
| 90th percentile service time | scroll | 206.679 | ms |
| 99th percentile service time | scroll | 214.707 | ms |
| 100th percentile service time | scroll | 216.775 | ms |
| error rate | scroll | 0 | % |
| Min Throughput | expression | 1.5 | ops/s |
| Mean Throughput | expression | 1.5 | ops/s |
| Median Throughput | expression | 1.5 | ops/s |
| Max Throughput | expression | 1.5 | ops/s |
| 50th percentile latency | expression | 243.385 | ms |
| 90th percentile latency | expression | 263.782 | ms |
| 99th percentile latency | expression | 268.557 | ms |
| 100th percentile latency | expression | 271.662 | ms |
| 50th percentile service time | expression | 241.65 | ms |
| 90th percentile service time | expression | 262.089 | ms |
| 99th percentile service time | expression | 267.104 | ms |
| 100th percentile service time | expression | 269.75 | ms |
| error rate | expression | 0 | % |
| Min Throughput | painless_static | 1.4 | ops/s |
| Mean Throughput | painless_static | 1.4 | ops/s |
| Median Throughput | painless_static | 1.4 | ops/s |
| Max Throughput | painless_static | 1.4 | ops/s |
| 50th percentile latency | painless_static | 264.972 | ms |
| 90th percentile latency | painless_static | 282.138 | ms |
| 99th percentile latency | painless_static | 294.578 | ms |
| 100th percentile latency | painless_static | 298.941 | ms |
| 50th percentile service time | painless_static | 263.489 | ms |
| 90th percentile service time | painless_static | 279.358 | ms |
| 99th percentile service time | painless_static | 292.5 | ms |
| 100th percentile service time | painless_static | 297.875 | ms |
| error rate | painless_static | 0 | % |
| Min Throughput | painless_dynamic | 1.4 | ops/s |
| Mean Throughput | painless_dynamic | 1.4 | ops/s |
| Median Throughput | painless_dynamic | 1.4 | ops/s |
| Max Throughput | painless_dynamic | 1.4 | ops/s |
| 50th percentile latency | painless_dynamic | 267.218 | ms |
| 90th percentile latency | painless_dynamic | 284.529 | ms |
| 99th percentile latency | painless_dynamic | 294.932 | ms |
| 100th percentile latency | painless_dynamic | 318.517 | ms |
| 50th percentile service time | painless_dynamic | 265.777 | ms |
| 90th percentile service time | painless_dynamic | 283.254 | ms |
| 99th percentile service time | painless_dynamic | 293.627 | ms |
| 100th percentile service time | painless_dynamic | 317.152 | ms |
| error rate | painless_dynamic | 0 | % |
| Min Throughput | decay_geo_gauss_function_score | 1 | ops/s |
| Mean Throughput | decay_geo_gauss_function_score | 1 | ops/s |
| Median Throughput | decay_geo_gauss_function_score | 1 | ops/s |
| Max Throughput | decay_geo_gauss_function_score | 1 | ops/s |
| 50th percentile latency | decay_geo_gauss_function_score | 307.989 | ms |
| 90th percentile latency | decay_geo_gauss_function_score | 315.452 | ms |
| 99th percentile latency | decay_geo_gauss_function_score | 320.052 | ms |
| 100th percentile latency | decay_geo_gauss_function_score | 340.011 | ms |
| 50th percentile service time | decay_geo_gauss_function_score | 305.711 | ms |
| 90th percentile service time | decay_geo_gauss_function_score | 312.513 | ms |
| 99th percentile service time | decay_geo_gauss_function_score | 317.589 | ms |
| 100th percentile service time | decay_geo_gauss_function_score | 336.846 | ms |
| error rate | decay_geo_gauss_function_score | 0 | % |
| Min Throughput | decay_geo_gauss_script_score | 1 | ops/s |
| Mean Throughput | decay_geo_gauss_script_score | 1 | ops/s |
| Median Throughput | decay_geo_gauss_script_score | 1 | ops/s |
| Max Throughput | decay_geo_gauss_script_score | 1 | ops/s |
| 50th percentile latency | decay_geo_gauss_script_score | 308.468 | ms |
| 90th percentile latency | decay_geo_gauss_script_score | 312.12 | ms |
| 99th percentile latency | decay_geo_gauss_script_score | 319.508 | ms |
| 100th percentile latency | decay_geo_gauss_script_score | 319.726 | ms |
| 50th percentile service time | decay_geo_gauss_script_score | 306.34 | ms |
| 90th percentile service time | decay_geo_gauss_script_score | 309.919 | ms |
| 99th percentile service time | decay_geo_gauss_script_score | 317.574 | ms |
| 100th percentile service time | decay_geo_gauss_script_score | 318.386 | ms |
| error rate | decay_geo_gauss_script_score | 0 | % |
| Min Throughput | field_value_function_score | 1.5 | ops/s |
| Mean Throughput | field_value_function_score | 1.51 | ops/s |
| Median Throughput | field_value_function_score | 1.51 | ops/s |
| Max Throughput | field_value_function_score | 1.51 | ops/s |
| 50th percentile latency | field_value_function_score | 100.511 | ms |
| 90th percentile latency | field_value_function_score | 103.967 | ms |
| 99th percentile latency | field_value_function_score | 121.622 | ms |
| 100th percentile latency | field_value_function_score | 122.2 | ms |
| 50th percentile service time | field_value_function_score | 98.7087 | ms |
| 90th percentile service time | field_value_function_score | 101.844 | ms |
| 99th percentile service time | field_value_function_score | 119.336 | ms |
| 100th percentile service time | field_value_function_score | 120.202 | ms |
| error rate | field_value_function_score | 0 | % |
| Min Throughput | field_value_script_score | 1.5 | ops/s |
| Mean Throughput | field_value_script_score | 1.5 | ops/s |
| Median Throughput | field_value_script_score | 1.5 | ops/s |
| Max Throughput | field_value_script_score | 1.51 | ops/s |
| 50th percentile latency | field_value_script_score | 137.987 | ms |
| 90th percentile latency | field_value_script_score | 140.154 | ms |
| 99th percentile latency | field_value_script_score | 152.326 | ms |
| 100th percentile latency | field_value_script_score | 161.77 | ms |
| 50th percentile service time | field_value_script_score | 136.351 | ms |
| 90th percentile service time | field_value_script_score | 138.457 | ms |
| 99th percentile service time | field_value_script_score | 150.885 | ms |
| 100th percentile service time | field_value_script_score | 159.668 | ms |
| error rate | field_value_script_score | 0 | % |
| Min Throughput | large_terms | 1.1 | ops/s |
| Mean Throughput | large_terms | 1.1 | ops/s |
| Median Throughput | large_terms | 1.1 | ops/s |
| Max Throughput | large_terms | 1.1 | ops/s |
| 50th percentile latency | large_terms | 545.665 | ms |
| 90th percentile latency | large_terms | 549.487 | ms |
| 99th percentile latency | large_terms | 557.167 | ms |
| 100th percentile latency | large_terms | 560.106 | ms |
| 50th percentile service time | large_terms | 538.917 | ms |
| 90th percentile service time | large_terms | 542.709 | ms |
| 99th percentile service time | large_terms | 550.557 | ms |
| 100th percentile service time | large_terms | 553.525 | ms |
| error rate | large_terms | 0 | % |
| Min Throughput | large_filtered_terms | 1.1 | ops/s |
| Mean Throughput | large_filtered_terms | 1.1 | ops/s |
| Median Throughput | large_filtered_terms | 1.1 | ops/s |
| Max Throughput | large_filtered_terms | 1.1 | ops/s |
| 50th percentile latency | large_filtered_terms | 548.928 | ms |
| 90th percentile latency | large_filtered_terms | 554.665 | ms |
| 99th percentile latency | large_filtered_terms | 562.814 | ms |
| 100th percentile latency | large_filtered_terms | 572.404 | ms |
| 50th percentile service time | large_filtered_terms | 542.257 | ms |
| 90th percentile service time | large_filtered_terms | 548.182 | ms |
| 99th percentile service time | large_filtered_terms | 555.781 | ms |
| 100th percentile service time | large_filtered_terms | 565.601 | ms |
| error rate | large_filtered_terms | 0 | % |
| Min Throughput | large_prohibited_terms | 1.1 | ops/s |
| Mean Throughput | large_prohibited_terms | 1.1 | ops/s |
| Median Throughput | large_prohibited_terms | 1.1 | ops/s |
| Max Throughput | large_prohibited_terms | 1.1 | ops/s |
| 50th percentile latency | large_prohibited_terms | 537.832 | ms |
| 90th percentile latency | large_prohibited_terms | 542.141 | ms |
| 99th percentile latency | large_prohibited_terms | 544.209 | ms |
| 100th percentile latency | large_prohibited_terms | 550.779 | ms |
| 50th percentile service time | large_prohibited_terms | 531.23 | ms |
| 90th percentile service time | large_prohibited_terms | 535.368 | ms |
| 99th percentile service time | large_prohibited_terms | 537.588 | ms |
| 100th percentile service time | large_prohibited_terms | 543.811 | ms |
| error rate | large_prohibited_terms | 0 | % |
| Min Throughput | desc_sort_population | 1.5 | ops/s |
| Mean Throughput | desc_sort_population | 1.51 | ops/s |
| Median Throughput | desc_sort_population | 1.51 | ops/s |
| Max Throughput | desc_sort_population | 1.51 | ops/s |
| 50th percentile latency | desc_sort_population | 60.2142 | ms |
| 90th percentile latency | desc_sort_population | 62.2713 | ms |
| 99th percentile latency | desc_sort_population | 82.2277 | ms |
| 100th percentile latency | desc_sort_population | 83.3576 | ms |
| 50th percentile service time | desc_sort_population | 58.5499 | ms |
| 90th percentile service time | desc_sort_population | 60.7134 | ms |
| 99th percentile service time | desc_sort_population | 80.5677 | ms |
| 100th percentile service time | desc_sort_population | 81.5889 | ms |
| error rate | desc_sort_population | 0 | % |
| Min Throughput | asc_sort_population | 1.5 | ops/s |
| Mean Throughput | asc_sort_population | 1.51 | ops/s |
| Median Throughput | asc_sort_population | 1.51 | ops/s |
| Max Throughput | asc_sort_population | 1.51 | ops/s |
| 50th percentile latency | asc_sort_population | 61.8712 | ms |
| 90th percentile latency | asc_sort_population | 64.1878 | ms |
| 99th percentile latency | asc_sort_population | 84.4655 | ms |
| 100th percentile latency | asc_sort_population | 84.7261 | ms |
| 50th percentile service time | asc_sort_population | 60.1245 | ms |
| 90th percentile service time | asc_sort_population | 62.2853 | ms |
| 99th percentile service time | asc_sort_population | 82.7414 | ms |
| 100th percentile service time | asc_sort_population | 82.7958 | ms |
| error rate | asc_sort_population | 0 | % |
| Min Throughput | asc_sort_with_after_population | 1.5 | ops/s |
| Mean Throughput | asc_sort_with_after_population | 1.51 | ops/s |
| Median Throughput | asc_sort_with_after_population | 1.51 | ops/s |
| Max Throughput | asc_sort_with_after_population | 1.51 | ops/s |
| 50th percentile latency | asc_sort_with_after_population | 74.7079 | ms |
| 90th percentile latency | asc_sort_with_after_population | 83.7405 | ms |
| 99th percentile latency | asc_sort_with_after_population | 98.7648 | ms |
| 100th percentile latency | asc_sort_with_after_population | 100.996 | ms |
| 50th percentile service time | asc_sort_with_after_population | 73.0636 | ms |
| 90th percentile service time | asc_sort_with_after_population | 82.1577 | ms |
| 99th percentile service time | asc_sort_with_after_population | 97.4383 | ms |
| 100th percentile service time | asc_sort_with_after_population | 99.6243 | ms |
| error rate | asc_sort_with_after_population | 0 | % |
| Min Throughput | desc_sort_geonameid | 6.02 | ops/s |
| Mean Throughput | desc_sort_geonameid | 6.02 | ops/s |
| Median Throughput | desc_sort_geonameid | 6.02 | ops/s |
| Max Throughput | desc_sort_geonameid | 6.03 | ops/s |
| 50th percentile latency | desc_sort_geonameid | 5.55858 | ms |
| 90th percentile latency | desc_sort_geonameid | 6.32429 | ms |
| 99th percentile latency | desc_sort_geonameid | 7.03976 | ms |
| 100th percentile latency | desc_sort_geonameid | 7.96389 | ms |
| 50th percentile service time | desc_sort_geonameid | 4.28917 | ms |
| 90th percentile service time | desc_sort_geonameid | 4.91764 | ms |
| 99th percentile service time | desc_sort_geonameid | 5.40451 | ms |
| 100th percentile service time | desc_sort_geonameid | 7.0389 | ms |
| error rate | desc_sort_geonameid | 0 | % |
| Min Throughput | desc_sort_with_after_geonameid | 6.01 | ops/s |
| Mean Throughput | desc_sort_with_after_geonameid | 6.01 | ops/s |
| Median Throughput | desc_sort_with_after_geonameid | 6.01 | ops/s |
| Max Throughput | desc_sort_with_after_geonameid | 6.02 | ops/s |
| 50th percentile latency | desc_sort_with_after_geonameid | 70.4754 | ms |
| 90th percentile latency | desc_sort_with_after_geonameid | 76.05 | ms |
| 99th percentile latency | desc_sort_with_after_geonameid | 95.7782 | ms |
| 100th percentile latency | desc_sort_with_after_geonameid | 95.9687 | ms |
| 50th percentile service time | desc_sort_with_after_geonameid | 69.3362 | ms |
| 90th percentile service time | desc_sort_with_after_geonameid | 74.731 | ms |
| 99th percentile service time | desc_sort_with_after_geonameid | 94.3695 | ms |
| 100th percentile service time | desc_sort_with_after_geonameid | 94.4154 | ms |
| error rate | desc_sort_with_after_geonameid | 0 | % |
| Min Throughput | asc_sort_geonameid | 6.02 | ops/s |
| Mean Throughput | asc_sort_geonameid | 6.02 | ops/s |
| Median Throughput | asc_sort_geonameid | 6.02 | ops/s |
| Max Throughput | asc_sort_geonameid | 6.03 | ops/s |
| 50th percentile latency | asc_sort_geonameid | 4.74601 | ms |
| 90th percentile latency | asc_sort_geonameid | 5.15122 | ms |
| 99th percentile latency | asc_sort_geonameid | 5.76906 | ms |
| 100th percentile latency | asc_sort_geonameid | 5.91034 | ms |
| 50th percentile service time | asc_sort_geonameid | 3.33382 | ms |
| 90th percentile service time | asc_sort_geonameid | 3.90223 | ms |
| 99th percentile service time | asc_sort_geonameid | 4.32505 | ms |
| 100th percentile service time | asc_sort_geonameid | 4.37321 | ms |
| error rate | asc_sort_geonameid | 0 | % |
| Min Throughput | asc_sort_with_after_geonameid | 6.01 | ops/s |
| Mean Throughput | asc_sort_with_after_geonameid | 6.01 | ops/s |
| Median Throughput | asc_sort_with_after_geonameid | 6.01 | ops/s |
| Max Throughput | asc_sort_with_after_geonameid | 6.02 | ops/s |
| 50th percentile latency | asc_sort_with_after_geonameid | 64.7787 | ms |
| 90th percentile latency | asc_sort_with_after_geonameid | 83.7871 | ms |
| 99th percentile latency | asc_sort_with_after_geonameid | 88.3394 | ms |
| 100th percentile latency | asc_sort_with_after_geonameid | 88.6091 | ms |
| 50th percentile service time | asc_sort_with_after_geonameid | 63.1986 | ms |
| 90th percentile service time | asc_sort_with_after_geonameid | 81.8991 | ms |
| 99th percentile service time | asc_sort_with_after_geonameid | 86.4036 | ms |
| 100th percentile service time | asc_sort_with_after_geonameid | 86.629 | ms |
| error rate | asc_sort_with_after_geonameid | 0 | % |