
16核64GB512GB通用型的3个数据节点实例基准性能指标
更新时间:2025-08-20
16核64GB512GB通用型的3个数据节点实例基准性能指标
使用ESRally工具对数据节点规格为16核64GB的BES集群实例(7.10.2版本)进行基准测试。
压测配置
| 项目 | 说明 |
|---|---|
| 实例配置 | 版本:BES集群实例(7.10.2版本) 数据节点规格:16核64GB 数据节点存储性能级别:增强型SSD_PL1 数据单节点存储空间:512GB 数据节点数量:3个 |
| ESRally配置 | 使用ESRally的默认配置tracks。 |
| 数据集 | 使用ESRally的预置数据集Geonames模拟测试场景,数据文档总数11396503。获取数据集,请查看ES Rally Hub获取。 |
| 分片数 | 主分片:6 副本数:0 |
| bulk_size | 每次批量操作提交5000个文档。 |
| bulk_indexing_clients | 同时执行批量索引操作的客户端数量为8个。 |
| index_append warmup time | 从默认的120s修改为30s,当集群配置高时,index_append在预热启动期间就完成了。 |
压测结果
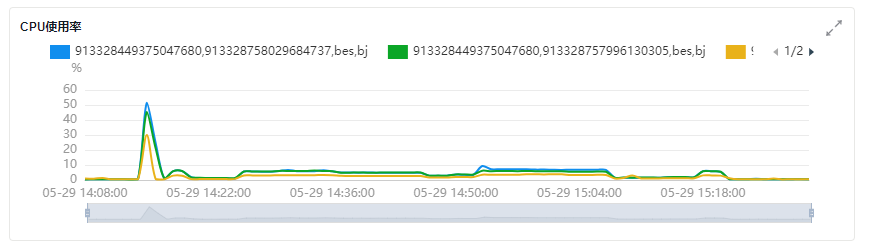
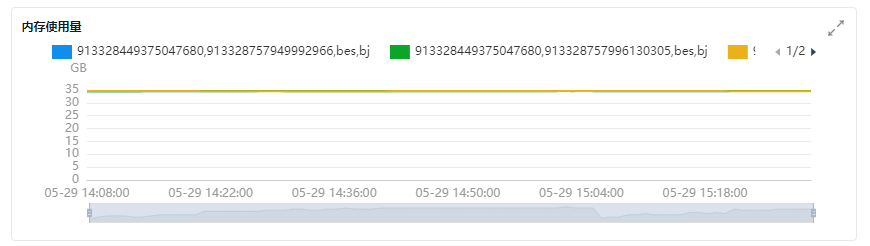
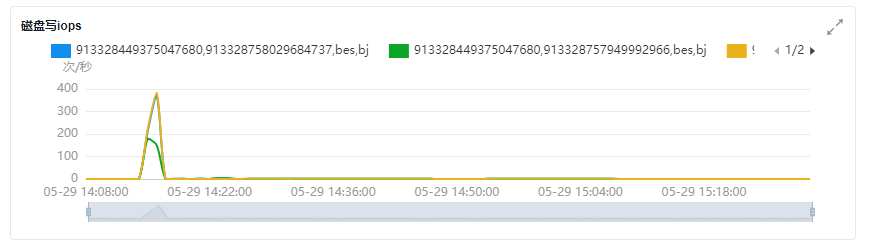
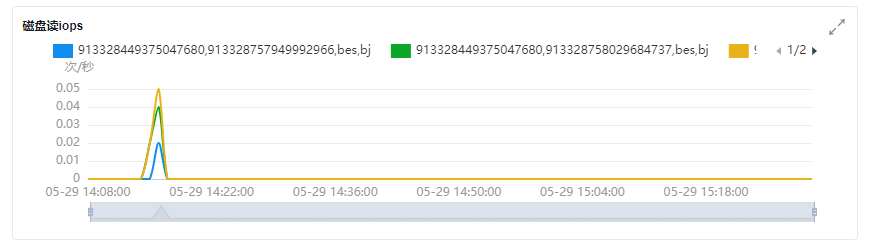
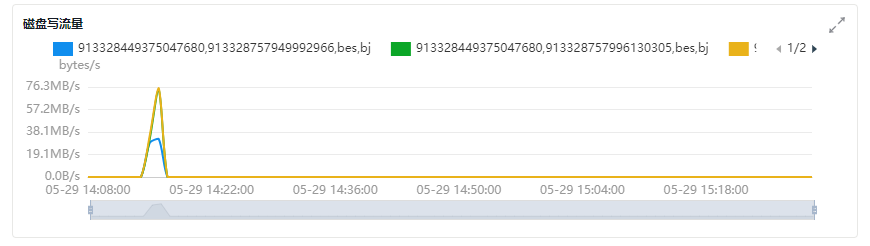
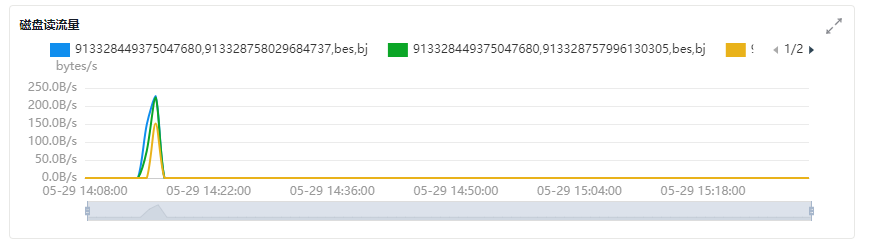
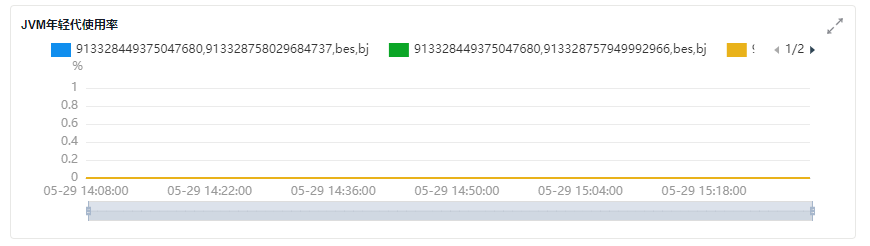
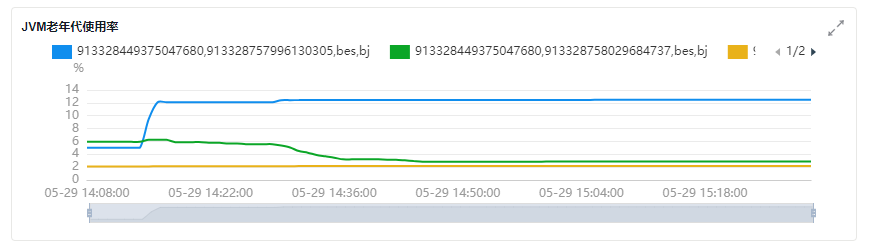
压测结果仅供参考,无法代表实际生产中写入查询情况,建议您结合业务生产数据进行压测。
主要压测指标结果
基准压测报告
| Metric | Task | Value | Unit |
|---|---|---|---|
| Cumulative indexing time of primary shards | 12.0343 | min | |
| Min cumulative indexing time across primary shards | 2.10367 | min | |
| Median cumulative indexing time across primary shards | 2.44152 | min | |
| Max cumulative indexing time across primary shards | 2.54422 | min | |
| Cumulative indexing throttle time of primary shards | 0 | min | |
| Min cumulative indexing throttle time across primary shards | 0 | min | |
| Median cumulative indexing throttle time across primary shards | 0 | min | |
| Max cumulative indexing throttle time across primary shards | 0 | min | |
| Cumulative merge time of primary shards | 3.5264 | min | |
| Cumulative merge count of primary shards | 34 | ||
| Min cumulative merge time across primary shards | 0.615117 | min | |
| Median cumulative merge time across primary shards | 0.6916 | min | |
| Max cumulative merge time across primary shards | 0.783883 | min | |
| Cumulative merge throttle time of primary shards | 0.917383 | min | |
| Min cumulative merge throttle time across primary shards | 0.16 | min | |
| Median cumulative merge throttle time across primary shards | 0.162583 | min | |
| Max cumulative merge throttle time across primary shards | 0.221383 | min | |
| Cumulative refresh time of primary shards | 0.72385 | min | |
| Cumulative refresh count of primary shards | 76 | ||
| Min cumulative refresh time across primary shards | 0.137933 | min | |
| Median cumulative refresh time across primary shards | 0.143717 | min | |
| Max cumulative refresh time across primary shards | 0.15445 | min | |
| Cumulative flush time of primary shards | 0.10835 | min | |
| Cumulative flush count of primary shards | 10 | ||
| Min cumulative flush time across primary shards | 0.014 | min | |
| Median cumulative flush time across primary shards | 0.0197833 | min | |
| Max cumulative flush time across primary shards | 0.0299667 | min | |
| Total Young Gen GC time | 1.947 | s | |
| Total Young Gen GC count | 327 | ||
| Total Old Gen GC time | 0 | s | |
| Total Old Gen GC count | 0 | ||
| Store size | 3.09734 | GB | |
| Translog size | 2.56114e-07 | GB | |
| Heap used for segments | 0.636745 | MB | |
| Heap used for doc values | 0.0364571 | MB | |
| Heap used for terms | 0.489899 | MB | |
| Heap used for norms | 0.0666504 | MB | |
| Heap used for points | 0 | MB | |
| Heap used for stored fields | 0.0437393 | MB | |
| Segment count | 85 | ||
| Total Ingest Pipeline count | 0 | ||
| Total Ingest Pipeline time | 0 | s | |
| Total Ingest Pipeline failed | 0 | ||
| Min Throughput | index-append | 233861 | docs/s |
| Mean Throughput | index-append | 241297 | docs/s |
| Median Throughput | index-append | 242239 | docs/s |
| Max Throughput | index-append | 247904 | docs/s |
| 50th percentile latency | index-append | 104.497 | ms |
| 90th percentile latency | index-append | 384.387 | ms |
| 99th percentile latency | index-append | 1171.61 | ms |
| 100th percentile latency | index-append | 1544.05 | ms |
| 50th percentile service time | index-append | 104.497 | ms |
| 90th percentile service time | index-append | 384.387 | ms |
| 99th percentile service time | index-append | 1171.61 | ms |
| 100th percentile service time | index-append | 1544.05 | ms |
| error rate | index-append | 0 | % |
| Min Throughput | index-stats | 90.03 | ops/s |
| Mean Throughput | index-stats | 90.05 | ops/s |
| Median Throughput | index-stats | 90.05 | ops/s |
| Max Throughput | index-stats | 90.1 | ops/s |
| 50th percentile latency | index-stats | 2.79773 | ms |
| 90th percentile latency | index-stats | 3.62359 | ms |
| 99th percentile latency | index-stats | 4.02021 | ms |
| 99.9th percentile latency | index-stats | 4.77639 | ms |
| 100th percentile latency | index-stats | 4.79167 | ms |
| 50th percentile service time | index-stats | 1.46091 | ms |
| 90th percentile service time | index-stats | 1.67085 | ms |
| 99th percentile service time | index-stats | 2.34065 | ms |
| 99.9th percentile service time | index-stats | 2.73045 | ms |
| 100th percentile service time | index-stats | 2.9983 | ms |
| error rate | index-stats | 0 | % |
| Min Throughput | node-stats | 90.04 | ops/s |
| Mean Throughput | node-stats | 90.08 | ops/s |
| Median Throughput | node-stats | 90.06 | ops/s |
| Max Throughput | node-stats | 90.2 | ops/s |
| 50th percentile latency | node-stats | 3.24468 | ms |
| 90th percentile latency | node-stats | 3.73432 | ms |
| 99th percentile latency | node-stats | 4.6546 | ms |
| 99.9th percentile latency | node-stats | 6.81514 | ms |
| 100th percentile latency | node-stats | 15.1143 | ms |
| 50th percentile service time | node-stats | 2.3205 | ms |
| 90th percentile service time | node-stats | 2.57523 | ms |
| 99th percentile service time | node-stats | 3.40415 | ms |
| 99.9th percentile service time | node-stats | 3.90179 | ms |
| 100th percentile service time | node-stats | 4.02071 | ms |
| error rate | node-stats | 0 | % |
| Min Throughput | default | 50.02 | ops/s |
| Mean Throughput | default | 50.04 | ops/s |
| Median Throughput | default | 50.04 | ops/s |
| Max Throughput | default | 50.07 | ops/s |
| 50th percentile latency | default | 3.13572 | ms |
| 90th percentile latency | default | 4.35137 | ms |
| 99th percentile latency | default | 4.7889 | ms |
| 99.9th percentile latency | default | 5.1395 | ms |
| 100th percentile latency | default | 10.2728 | ms |
| 50th percentile service time | default | 2.03777 | ms |
| 90th percentile service time | default | 2.30738 | ms |
| 99th percentile service time | default | 2.66234 | ms |
| 99.9th percentile service time | default | 4.02789 | ms |
| 100th percentile service time | default | 9.75839 | ms |
| error rate | default | 0 | % |
| Min Throughput | term | 100.03 | ops/s |
| Mean Throughput | term | 100.06 | ops/s |
| Median Throughput | term | 100.05 | ops/s |
| Max Throughput | term | 100.1 | ops/s |
| 50th percentile latency | term | 2.93054 | ms |
| 90th percentile latency | term | 3.44617 | ms |
| 99th percentile latency | term | 3.88855 | ms |
| 99.9th percentile latency | term | 4.81783 | ms |
| 100th percentile latency | term | 5.23642 | ms |
| 50th percentile service time | term | 2.01621 | ms |
| 90th percentile service time | term | 2.2517 | ms |
| 99th percentile service time | term | 2.82973 | ms |
| 99.9th percentile service time | term | 3.97545 | ms |
| 100th percentile service time | term | 4.20495 | ms |
| error rate | term | 0 | % |
| Min Throughput | phrase | 110.03 | ops/s |
| Mean Throughput | phrase | 110.04 | ops/s |
| Median Throughput | phrase | 110.04 | ops/s |
| Max Throughput | phrase | 110.06 | ops/s |
| 50th percentile latency | phrase | 3.08126 | ms |
| 90th percentile latency | phrase | 3.61041 | ms |
| 99th percentile latency | phrase | 53.9258 | ms |
| 99.9th percentile latency | phrase | 114.888 | ms |
| 100th percentile latency | phrase | 121.149 | ms |
| 50th percentile service time | phrase | 2.10698 | ms |
| 90th percentile service time | phrase | 2.40441 | ms |
| 99th percentile service time | phrase | 3.0833 | ms |
| 99.9th percentile service time | phrase | 18.6289 | ms |
| 100th percentile service time | phrase | 119.816 | ms |
| error rate | phrase | 0 | % |
| Min Throughput | country_agg_uncached | 3 | ops/s |
| Mean Throughput | country_agg_uncached | 3 | ops/s |
| Median Throughput | country_agg_uncached | 3 | ops/s |
| Max Throughput | country_agg_uncached | 3 | ops/s |
| 50th percentile latency | country_agg_uncached | 151.681 | ms |
| 90th percentile latency | country_agg_uncached | 170.235 | ms |
| 99th percentile latency | country_agg_uncached | 178.553 | ms |
| 100th percentile latency | country_agg_uncached | 183.564 | ms |
| 50th percentile service time | country_agg_uncached | 150.278 | ms |
| 90th percentile service time | country_agg_uncached | 169.046 | ms |
| 99th percentile service time | country_agg_uncached | 177.082 | ms |
| 100th percentile service time | country_agg_uncached | 181.96 | ms |
| error rate | country_agg_uncached | 0 | % |
| Min Throughput | country_agg_cached | 98.7 | ops/s |
| Mean Throughput | country_agg_cached | 99.04 | ops/s |
| Median Throughput | country_agg_cached | 99.08 | ops/s |
| Max Throughput | country_agg_cached | 99.28 | ops/s |
| 50th percentile latency | country_agg_cached | 2.63408 | ms |
| 90th percentile latency | country_agg_cached | 3.04244 | ms |
| 99th percentile latency | country_agg_cached | 3.52889 | ms |
| 99.9th percentile latency | country_agg_cached | 3.90273 | ms |
| 100th percentile latency | country_agg_cached | 4.0691 | ms |
| 50th percentile service time | country_agg_cached | 1.65862 | ms |
| 90th percentile service time | country_agg_cached | 1.86344 | ms |
| 99th percentile service time | country_agg_cached | 2.22166 | ms |
| 99.9th percentile service time | country_agg_cached | 2.60855 | ms |
| 100th percentile service time | country_agg_cached | 2.6347 | ms |
| error rate | country_agg_cached | 0 | % |
| Min Throughput | scroll | 20.05 | pages/s |
| Mean Throughput | scroll | 20.06 | pages/s |
| Median Throughput | scroll | 20.06 | pages/s |
| Max Throughput | scroll | 20.08 | pages/s |
| 50th percentile latency | scroll | 234.894 | ms |
| 90th percentile latency | scroll | 238.723 | ms |
| 99th percentile latency | scroll | 251.606 | ms |
| 100th percentile latency | scroll | 252.065 | ms |
| 50th percentile service time | scroll | 232.651 | ms |
| 90th percentile service time | scroll | 236.106 | ms |
| 99th percentile service time | scroll | 248.883 | ms |
| 100th percentile service time | scroll | 248.996 | ms |
| error rate | scroll | 0 | % |
| Min Throughput | expression | 1.5 | ops/s |
| Mean Throughput | expression | 1.5 | ops/s |
| Median Throughput | expression | 1.5 | ops/s |
| Max Throughput | expression | 1.5 | ops/s |
| 50th percentile latency | expression | 277.092 | ms |
| 90th percentile latency | expression | 283.323 | ms |
| 99th percentile latency | expression | 301.44 | ms |
| 100th percentile latency | expression | 304.69 | ms |
| 50th percentile service time | expression | 275.476 | ms |
| 90th percentile service time | expression | 281.42 | ms |
| 99th percentile service time | expression | 300.013 | ms |
| 100th percentile service time | expression | 303.609 | ms |
| error rate | expression | 0 | % |
| Min Throughput | painless_static | 1.4 | ops/s |
| Mean Throughput | painless_static | 1.4 | ops/s |
| Median Throughput | painless_static | 1.4 | ops/s |
| Max Throughput | painless_static | 1.4 | ops/s |
| 50th percentile latency | painless_static | 317.442 | ms |
| 90th percentile latency | painless_static | 334.858 | ms |
| 99th percentile latency | painless_static | 340.92 | ms |
| 100th percentile latency | painless_static | 341.893 | ms |
| 50th percentile service time | painless_static | 316.19 | ms |
| 90th percentile service time | painless_static | 333.574 | ms |
| 99th percentile service time | painless_static | 339.803 | ms |
| 100th percentile service time | painless_static | 340.474 | ms |
| error rate | painless_static | 0 | % |
| Min Throughput | painless_dynamic | 1.4 | ops/s |
| Mean Throughput | painless_dynamic | 1.4 | ops/s |
| Median Throughput | painless_dynamic | 1.4 | ops/s |
| Max Throughput | painless_dynamic | 1.4 | ops/s |
| 50th percentile latency | painless_dynamic | 315.694 | ms |
| 90th percentile latency | painless_dynamic | 321.423 | ms |
| 99th percentile latency | painless_dynamic | 337.969 | ms |
| 100th percentile latency | painless_dynamic | 342.168 | ms |
| 50th percentile service time | painless_dynamic | 314.424 | ms |
| 90th percentile service time | painless_dynamic | 319.92 | ms |
| 99th percentile service time | painless_dynamic | 336.644 | ms |
| 100th percentile service time | painless_dynamic | 340.635 | ms |
| error rate | painless_dynamic | 0 | % |
| Min Throughput | decay_geo_gauss_function_score | 1 | ops/s |
| Mean Throughput | decay_geo_gauss_function_score | 1 | ops/s |
| Median Throughput | decay_geo_gauss_function_score | 1 | ops/s |
| Max Throughput | decay_geo_gauss_function_score | 1 | ops/s |
| 50th percentile latency | decay_geo_gauss_function_score | 359.214 | ms |
| 90th percentile latency | decay_geo_gauss_function_score | 368.352 | ms |
| 99th percentile latency | decay_geo_gauss_function_score | 373.97 | ms |
| 100th percentile latency | decay_geo_gauss_function_score | 374.069 | ms |
| 50th percentile service time | decay_geo_gauss_function_score | 357.655 | ms |
| 90th percentile service time | decay_geo_gauss_function_score | 366.644 | ms |
| 99th percentile service time | decay_geo_gauss_function_score | 372.096 | ms |
| 100th percentile service time | decay_geo_gauss_function_score | 372.425 | ms |
| error rate | decay_geo_gauss_function_score | 0 | % |
| Min Throughput | decay_geo_gauss_script_score | 1 | ops/s |
| Mean Throughput | decay_geo_gauss_script_score | 1 | ops/s |
| Median Throughput | decay_geo_gauss_script_score | 1 | ops/s |
| Max Throughput | decay_geo_gauss_script_score | 1 | ops/s |
| 50th percentile latency | decay_geo_gauss_script_score | 363.106 | ms |
| 90th percentile latency | decay_geo_gauss_script_score | 365.481 | ms |
| 99th percentile latency | decay_geo_gauss_script_score | 374.609 | ms |
| 100th percentile latency | decay_geo_gauss_script_score | 376.065 | ms |
| 50th percentile service time | decay_geo_gauss_script_score | 361.383 | ms |
| 90th percentile service time | decay_geo_gauss_script_score | 363.777 | ms |
| 99th percentile service time | decay_geo_gauss_script_score | 373.431 | ms |
| 100th percentile service time | decay_geo_gauss_script_score | 375.085 | ms |
| error rate | decay_geo_gauss_script_score | 0 | % |
| Min Throughput | field_value_function_score | 1.5 | ops/s |
| Mean Throughput | field_value_function_score | 1.5 | ops/s |
| Median Throughput | field_value_function_score | 1.5 | ops/s |
| Max Throughput | field_value_function_score | 1.51 | ops/s |
| 50th percentile latency | field_value_function_score | 127.949 | ms |
| 90th percentile latency | field_value_function_score | 130.053 | ms |
| 99th percentile latency | field_value_function_score | 144.821 | ms |
| 100th percentile latency | field_value_function_score | 148.107 | ms |
| 50th percentile service time | field_value_function_score | 126.362 | ms |
| 90th percentile service time | field_value_function_score | 128.247 | ms |
| 99th percentile service time | field_value_function_score | 143.593 | ms |
| 100th percentile service time | field_value_function_score | 145.336 | ms |
| error rate | field_value_function_score | 0 | % |
| Min Throughput | field_value_script_score | 1.5 | ops/s |
| Mean Throughput | field_value_script_score | 1.5 | ops/s |
| Median Throughput | field_value_script_score | 1.5 | ops/s |
| Max Throughput | field_value_script_score | 1.51 | ops/s |
| 50th percentile latency | field_value_script_score | 163.99 | ms |
| 90th percentile latency | field_value_script_score | 172.615 | ms |
| 99th percentile latency | field_value_script_score | 185.59 | ms |
| 100th percentile latency | field_value_script_score | 188.832 | ms |
| 50th percentile service time | field_value_script_score | 162.292 | ms |
| 90th percentile service time | field_value_script_score | 171.111 | ms |
| 99th percentile service time | field_value_script_score | 183.541 | ms |
| 100th percentile service time | field_value_script_score | 187.705 | ms |
| error rate | field_value_script_score | 0 | % |
| Min Throughput | large_terms | 1.1 | ops/s |
| Mean Throughput | large_terms | 1.1 | ops/s |
| Median Throughput | large_terms | 1.1 | ops/s |
| Max Throughput | large_terms | 1.1 | ops/s |
| 50th percentile latency | large_terms | 596.243 | ms |
| 90th percentile latency | large_terms | 603.62 | ms |
| 99th percentile latency | large_terms | 620.6 | ms |
| 100th percentile latency | large_terms | 623.707 | ms |
| 50th percentile service time | large_terms | 589.628 | ms |
| 90th percentile service time | large_terms | 597.426 | ms |
| 99th percentile service time | large_terms | 614.262 | ms |
| 100th percentile service time | large_terms | 617.034 | ms |
| error rate | large_terms | 0 | % |
| Min Throughput | large_filtered_terms | 1.1 | ops/s |
| Mean Throughput | large_filtered_terms | 1.1 | ops/s |
| Median Throughput | large_filtered_terms | 1.1 | ops/s |
| Max Throughput | large_filtered_terms | 1.1 | ops/s |
| 50th percentile latency | large_filtered_terms | 599.322 | ms |
| 90th percentile latency | large_filtered_terms | 604.024 | ms |
| 99th percentile latency | large_filtered_terms | 617.841 | ms |
| 100th percentile latency | large_filtered_terms | 619.886 | ms |
| 50th percentile service time | large_filtered_terms | 592.66 | ms |
| 90th percentile service time | large_filtered_terms | 597.505 | ms |
| 99th percentile service time | large_filtered_terms | 610.958 | ms |
| 100th percentile service time | large_filtered_terms | 612.832 | ms |
| error rate | large_filtered_terms | 0 | % |
| Min Throughput | large_prohibited_terms | 1.1 | ops/s |
| Mean Throughput | large_prohibited_terms | 1.1 | ops/s |
| Median Throughput | large_prohibited_terms | 1.1 | ops/s |
| Max Throughput | large_prohibited_terms | 1.1 | ops/s |
| 50th percentile latency | large_prohibited_terms | 577.937 | ms |
| 90th percentile latency | large_prohibited_terms | 581.529 | ms |
| 99th percentile latency | large_prohibited_terms | 596.318 | ms |
| 100th percentile latency | large_prohibited_terms | 599.859 | ms |
| 50th percentile service time | large_prohibited_terms | 570.86 | ms |
| 90th percentile service time | large_prohibited_terms | 574.387 | ms |
| 99th percentile service time | large_prohibited_terms | 588.893 | ms |
| 100th percentile service time | large_prohibited_terms | 592.835 | ms |
| error rate | large_prohibited_terms | 0 | % |
| Min Throughput | desc_sort_population | 1.5 | ops/s |
| Mean Throughput | desc_sort_population | 1.51 | ops/s |
| Median Throughput | desc_sort_population | 1.51 | ops/s |
| Max Throughput | desc_sort_population | 1.51 | ops/s |
| 50th percentile latency | desc_sort_population | 58.0235 | ms |
| 90th percentile latency | desc_sort_population | 60.1249 | ms |
| 99th percentile latency | desc_sort_population | 85.2941 | ms |
| 100th percentile latency | desc_sort_population | 85.7457 | ms |
| 50th percentile service time | desc_sort_population | 56.389 | ms |
| 90th percentile service time | desc_sort_population | 58.1864 | ms |
| 99th percentile service time | desc_sort_population | 83.7822 | ms |
| 100th percentile service time | desc_sort_population | 83.955 | ms |
| error rate | desc_sort_population | 0 | % |
| Min Throughput | asc_sort_population | 1.5 | ops/s |
| Mean Throughput | asc_sort_population | 1.51 | ops/s |
| Median Throughput | asc_sort_population | 1.51 | ops/s |
| Max Throughput | asc_sort_population | 1.51 | ops/s |
| 50th percentile latency | asc_sort_population | 59.1134 | ms |
| 90th percentile latency | asc_sort_population | 60.5708 | ms |
| 99th percentile latency | asc_sort_population | 77.2832 | ms |
| 100th percentile latency | asc_sort_population | 89.8928 | ms |
| 50th percentile service time | asc_sort_population | 57.3594 | ms |
| 90th percentile service time | asc_sort_population | 59.0197 | ms |
| 99th percentile service time | asc_sort_population | 75.7874 | ms |
| 100th percentile service time | asc_sort_population | 88.1853 | ms |
| error rate | asc_sort_population | 0 | % |
| Min Throughput | asc_sort_with_after_population | 1.5 | ops/s |
| Mean Throughput | asc_sort_with_after_population | 1.51 | ops/s |
| Median Throughput | asc_sort_with_after_population | 1.51 | ops/s |
| Max Throughput | asc_sort_with_after_population | 1.51 | ops/s |
| 50th percentile latency | asc_sort_with_after_population | 79.5535 | ms |
| 90th percentile latency | asc_sort_with_after_population | 81 | ms |
| 99th percentile latency | asc_sort_with_after_population | 105.637 | ms |
| 100th percentile latency | asc_sort_with_after_population | 108.186 | ms |
| 50th percentile service time | asc_sort_with_after_population | 77.6818 | ms |
| 90th percentile service time | asc_sort_with_after_population | 79.3232 | ms |
| 99th percentile service time | asc_sort_with_after_population | 103.844 | ms |
| 100th percentile service time | asc_sort_with_after_population | 106.852 | ms |
| error rate | asc_sort_with_after_population | 0 | % |
| Min Throughput | desc_sort_geonameid | 6.02 | ops/s |
| Mean Throughput | desc_sort_geonameid | 6.02 | ops/s |
| Median Throughput | desc_sort_geonameid | 6.02 | ops/s |
| Max Throughput | desc_sort_geonameid | 6.03 | ops/s |
| 50th percentile latency | desc_sort_geonameid | 6.38591 | ms |
| 90th percentile latency | desc_sort_geonameid | 6.80141 | ms |
| 99th percentile latency | desc_sort_geonameid | 7.43864 | ms |
| 100th percentile latency | desc_sort_geonameid | 8.4132 | ms |
| 50th percentile service time | desc_sort_geonameid | 5.12179 | ms |
| 90th percentile service time | desc_sort_geonameid | 5.4492 | ms |
| 99th percentile service time | desc_sort_geonameid | 6.54057 | ms |
| 100th percentile service time | desc_sort_geonameid | 6.68928 | ms |
| error rate | desc_sort_geonameid | 0 | % |
| Min Throughput | desc_sort_with_after_geonameid | 6.01 | ops/s |
| Mean Throughput | desc_sort_with_after_geonameid | 6.01 | ops/s |
| Median Throughput | desc_sort_with_after_geonameid | 6.01 | ops/s |
| Max Throughput | desc_sort_with_after_geonameid | 6.02 | ops/s |
| 50th percentile latency | desc_sort_with_after_geonameid | 75.4583 | ms |
| 90th percentile latency | desc_sort_with_after_geonameid | 82.6942 | ms |
| 99th percentile latency | desc_sort_with_after_geonameid | 100.328 | ms |
| 100th percentile latency | desc_sort_with_after_geonameid | 107.778 | ms |
| 50th percentile service time | desc_sort_with_after_geonameid | 74.2668 | ms |
| 90th percentile service time | desc_sort_with_after_geonameid | 81.3509 | ms |
| 99th percentile service time | desc_sort_with_after_geonameid | 98.6706 | ms |
| 100th percentile service time | desc_sort_with_after_geonameid | 107.126 | ms |
| error rate | desc_sort_with_after_geonameid | 0 | % |
| Min Throughput | asc_sort_geonameid | 6.02 | ops/s |
| Mean Throughput | asc_sort_geonameid | 6.02 | ops/s |
| Median Throughput | asc_sort_geonameid | 6.02 | ops/s |
| Max Throughput | asc_sort_geonameid | 6.03 | ops/s |
| 50th percentile latency | asc_sort_geonameid | 5.44507 | ms |
| 90th percentile latency | asc_sort_geonameid | 5.92182 | ms |
| 99th percentile latency | asc_sort_geonameid | 8.5025 | ms |
| 100th percentile latency | asc_sort_geonameid | 12.0944 | ms |
| 50th percentile service time | asc_sort_geonameid | 4.12126 | ms |
| 90th percentile service time | asc_sort_geonameid | 4.62526 | ms |
| 99th percentile service time | asc_sort_geonameid | 7.17899 | ms |
| 100th percentile service time | asc_sort_geonameid | 10.7599 | ms |
| error rate | asc_sort_geonameid | 0 | % |
| Min Throughput | asc_sort_with_after_geonameid | 6.01 | ops/s |
| Mean Throughput | asc_sort_with_after_geonameid | 6.01 | ops/s |
| Median Throughput | asc_sort_with_after_geonameid | 6.01 | ops/s |
| Max Throughput | asc_sort_with_after_geonameid | 6.02 | ops/s |
| 50th percentile latency | asc_sort_with_after_geonameid | 70.3262 | ms |
| 90th percentile latency | asc_sort_with_after_geonameid | 73.0334 | ms |
| 99th percentile latency | asc_sort_with_after_geonameid | 97.0722 | ms |
| 100th percentile latency | asc_sort_with_after_geonameid | 99.2609 | ms |
| 50th percentile service time | asc_sort_with_after_geonameid | 69.095 | ms |
| 90th percentile service time | asc_sort_with_after_geonameid | 72.0477 | ms |
| 99th percentile service time | asc_sort_with_after_geonameid | 95.9471 | ms |
| 100th percentile service time | asc_sort_with_after_geonameid | 98.258 | ms |
| error rate | asc_sort_with_after_geonameid | 0 | % |