
8核16GB512GB计算型的3个数据节点实例基准性能测试
更新时间:2025-08-20
8核16GB 512GB计算型的3个数据节点实例基准性能测试
使用ESRally工具对数据节点规格为8核16GB的BES集群实例(7.10.2版本)进行基准测试。
压测配置
| 项目 | 说明 |
|---|---|
| 实例配置 | 版本:BES集群实例(7.10.2版本) 数据节点规格:8核16GB 数据节点存储性能级别:增强型SSD_PL1 数据单节点存储空间:512GB 数据节点数量:3个 |
| ESRally配置 | 使用ESRally的默认配置tracks。 |
| 数据集 | 使用ESRally的预置数据集Geonames模拟测试场景,数据集大小2.8GB,文档总数11396503。获取数据集,请查看ES Rally Hub获取。 |
| 分片数 | 主分片:6 副本数:0 |
| bulk_size | 每次批量操作提交5000个文档。 |
| bulk_indexing_clients | 同时执行批量索引操作的客户端数量为8个。 |
| index_append warmup time | 从默认的120s修改为30s,当集群配置高时,index_append在预热启动期间就完成了。 |
压测结果
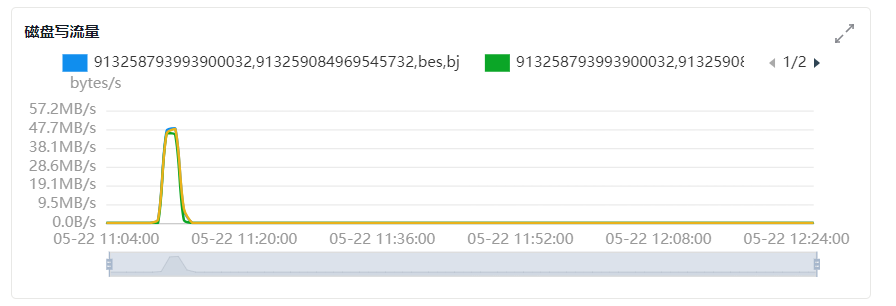
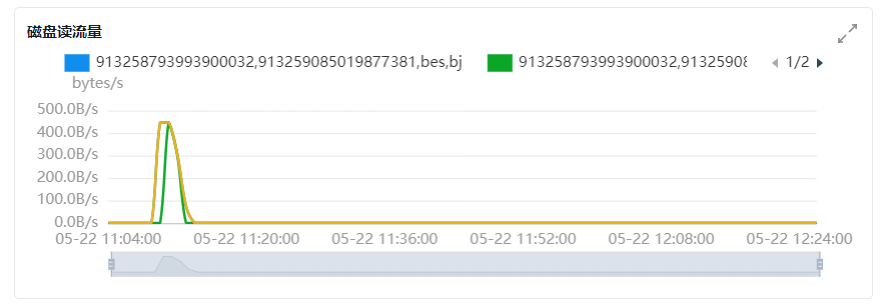
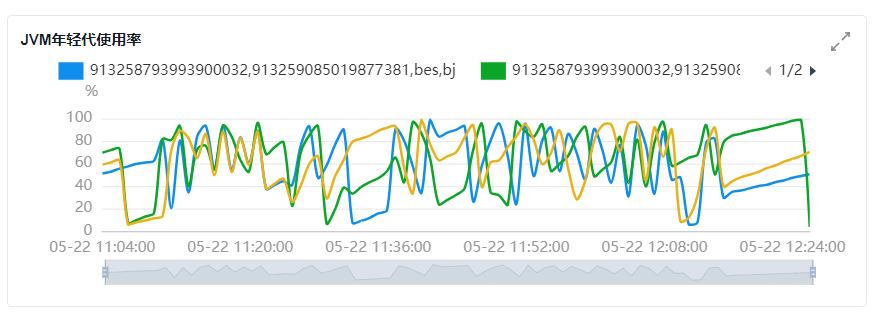
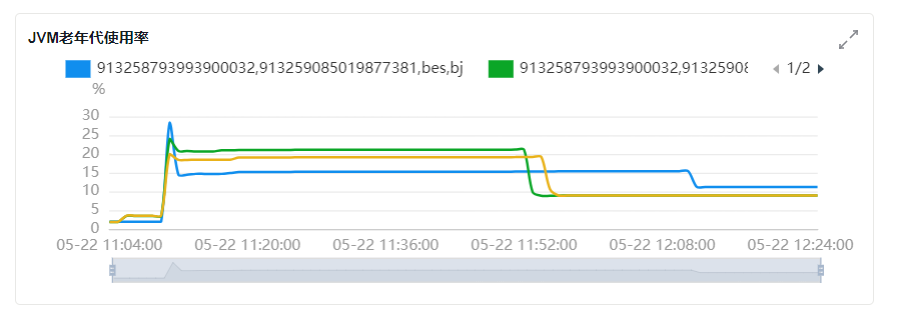
压测结果仅供参考,无法代表实际生产中写入查询情况,建议您结合业务生产数据进行压测。
主要压测指标结果
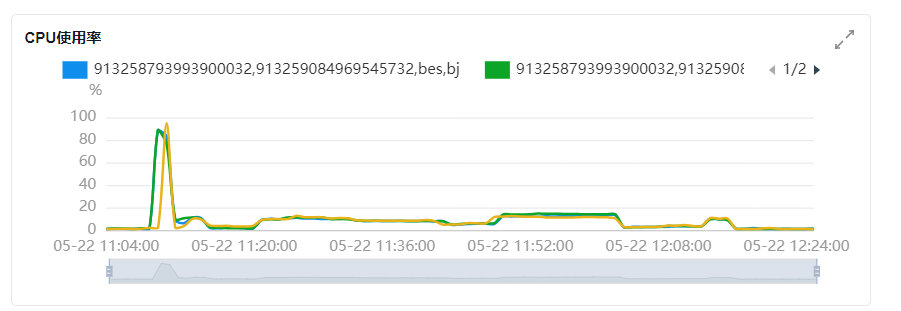
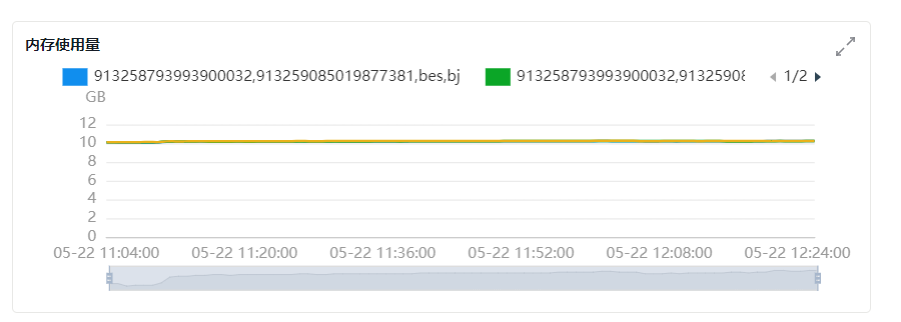
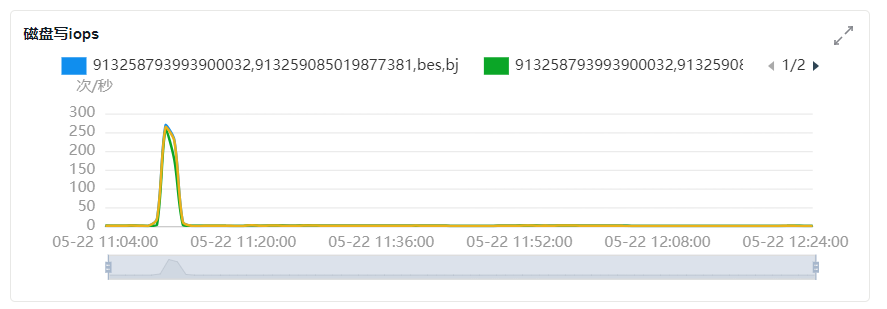
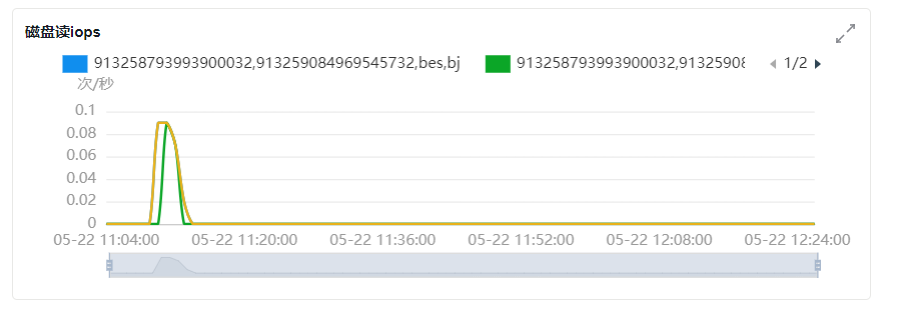
基准压测报告
| Metric | Task | Value | Unit |
|---|---|---|---|
| Cumulative indexing time of primary shards | 13.962 | min | |
| Min cumulative indexing time across primary shards | 2.09138 | min | |
| Median cumulative indexing time across primary shards | 2.96602 | min | |
| Max cumulative indexing time across primary shards | 3.00725 | min | |
| Cumulative indexing throttle time of primary shards | 0 | min | |
| Min cumulative indexing throttle time across primary shards | 0 | min | |
| Median cumulative indexing throttle time across primary shards | 0 | min | |
| Max cumulative indexing throttle time across primary shards | 0 | min | |
| Cumulative merge time of primary shards | 3.94532 | min | |
| Cumulative merge count of primary shards | 28 | ||
| Min cumulative merge time across primary shards | 0.716033 | min | |
| Median cumulative merge time across primary shards | 0.777367 | min | |
| Max cumulative merge time across primary shards | 0.891367 | min | |
| Cumulative merge throttle time of primary shards | 0.963583 | min | |
| Min cumulative merge throttle time across primary shards | 0.152167 | min | |
| Median cumulative merge throttle time across primary shards | 0.186617 | min | |
| Max cumulative merge throttle time across primary shards | 0.263517 | min | |
| Cumulative refresh time of primary shards | 1.00345 | min | |
| Cumulative refresh count of primary shards | 92 | ||
| Min cumulative refresh time across primary shards | 0.1888 | min | |
| Median cumulative refresh time across primary shards | 0.197067 | min | |
| Max cumulative refresh time across primary shards | 0.221383 | min | |
| Cumulative flush time of primary shards | 0.188783 | min | |
| Cumulative flush count of primary shards | 10 | ||
| Min cumulative flush time across primary shards | 0.0135667 | min | |
| Median cumulative flush time across primary shards | 0.0423833 | min | |
| Max cumulative flush time across primary shards | 0.0461333 | min | |
| Total Young Gen GC time | 5.371 | s | |
| Total Young Gen GC count | 1232 | ||
| Total Old Gen GC time | 0 | s | |
| Total Old Gen GC count | 0 | ||
| Store size | 3.02096 | GB | |
| Translog size | 2.56114e-07 | GB | |
| Heap used for segments | 0.62178 | MB | |
| Heap used for doc values | 0.0332794 | MB | |
| Heap used for terms | 0.479797 | MB | |
| Heap used for norms | 0.0652466 | MB | |
| Heap used for points | 0 | MB | |
| Heap used for stored fields | 0.043457 | MB | |
| Segment count | 84 | ||
| Total Ingest Pipeline count | 0 | ||
| Total Ingest Pipeline time | 0 | s | |
| Total Ingest Pipeline failed | 0 | ||
| Min Throughput | index-append | 157765 | docs/s |
| Mean Throughput | index-append | 170915 | docs/s |
| Median Throughput | index-append | 167959 | docs/s |
| Max Throughput | index-append | 189560 | docs/s |
| 50th percentile latency | index-append | 195.387 | ms |
| 90th percentile latency | index-append | 450.982 | ms |
| 99th percentile latency | index-append | 1269.04 | ms |
| 99.9th percentile latency | index-append | 1749.25 | ms |
| 100th percentile latency | index-append | 1960.89 | ms |
| 50th percentile service time | index-append | 195.387 | ms |
| 90th percentile service time | index-append | 450.982 | ms |
| 99th percentile service time | index-append | 1269.04 | ms |
| 99.9th percentile service time | index-append | 1749.25 | ms |
| 100th percentile service time | index-append | 1960.89 | ms |
| error rate | index-append | 0 | % |
| Min Throughput | index-stats | 90.03 | ops/s |
| Mean Throughput | index-stats | 90.05 | ops/s |
| Median Throughput | index-stats | 90.05 | ops/s |
| Max Throughput | index-stats | 90.1 | ops/s |
| 50th percentile latency | index-stats | 2.83893 | ms |
| 90th percentile latency | index-stats | 3.76465 | ms |
| 99th percentile latency | index-stats | 4.13091 | ms |
| 99.9th percentile latency | index-stats | 4.47985 | ms |
| 100th percentile latency | index-stats | 4.62963 | ms |
| 50th percentile service time | index-stats | 1.49531 | ms |
| 90th percentile service time | index-stats | 1.8023 | ms |
| 99th percentile service time | index-stats | 2.0215 | ms |
| 99.9th percentile service time | index-stats | 2.24679 | ms |
| 100th percentile service time | index-stats | 2.27332 | ms |
| error rate | index-stats | 0 | % |
| Min Throughput | node-stats | 89.77 | ops/s |
| Mean Throughput | node-stats | 90.07 | ops/s |
| Median Throughput | node-stats | 90.06 | ops/s |
| Max Throughput | node-stats | 90.28 | ops/s |
| 50th percentile latency | node-stats | 3.23979 | ms |
| 90th percentile latency | node-stats | 3.76533 | ms |
| 99th percentile latency | node-stats | 4.62058 | ms |
| 99.9th percentile latency | node-stats | 8.79175 | ms |
| 100th percentile latency | node-stats | 16.7832 | ms |
| 50th percentile service time | node-stats | 2.29505 | ms |
| 90th percentile service time | node-stats | 2.51091 | ms |
| 99th percentile service time | node-stats | 3.31319 | ms |
| 99.9th percentile service time | node-stats | 4.70312 | ms |
| 100th percentile service time | node-stats | 5.00144 | ms |
| error rate | node-stats | 0 | % |
| Min Throughput | default | 50.02 | ops/s |
| Mean Throughput | default | 50.04 | ops/s |
| Median Throughput | default | 50.04 | ops/s |
| Max Throughput | default | 50.06 | ops/s |
| 50th percentile latency | default | 3.11821 | ms |
| 90th percentile latency | default | 4.42541 | ms |
| 99th percentile latency | default | 4.69015 | ms |
| 99.9th percentile latency | default | 4.98554 | ms |
| 100th percentile latency | default | 5.08235 | ms |
| 50th percentile service time | default | 1.95288 | ms |
| 90th percentile service time | default | 2.1792 | ms |
| 99th percentile service time | default | 2.52395 | ms |
| 99.9th percentile service time | default | 3.02195 | ms |
| 100th percentile service time | default | 3.50996 | ms |
| error rate | default | 0 | % |
| Min Throughput | term | 100.02 | ops/s |
| Mean Throughput | term | 100.04 | ops/s |
| Median Throughput | term | 100.04 | ops/s |
| Max Throughput | term | 100.06 | ops/s |
| 50th percentile latency | term | 2.97326 | ms |
| 90th percentile latency | term | 3.48226 | ms |
| 99th percentile latency | term | 3.84898 | ms |
| 99.9th percentile latency | term | 9.62081 | ms |
| 100th percentile latency | term | 12.7532 | ms |
| 50th percentile service time | term | 1.97194 | ms |
| 90th percentile service time | term | 2.17499 | ms |
| 99th percentile service time | term | 2.61251 | ms |
| 99.9th percentile service time | term | 6.498 | ms |
| 100th percentile service time | term | 11.9398 | ms |
| error rate | term | 0 | % |
| Min Throughput | phrase | 110.02 | ops/s |
| Mean Throughput | phrase | 110.03 | ops/s |
| Median Throughput | phrase | 110.03 | ops/s |
| Max Throughput | phrase | 110.06 | ops/s |
| 50th percentile latency | phrase | 2.98059 | ms |
| 90th percentile latency | phrase | 3.45886 | ms |
| 99th percentile latency | phrase | 4.20316 | ms |
| 99.9th percentile latency | phrase | 14.7435 | ms |
| 100th percentile latency | phrase | 21.5945 | ms |
| 50th percentile service time | phrase | 1.99907 | ms |
| 90th percentile service time | phrase | 2.2445 | ms |
| 99th percentile service time | phrase | 2.91911 | ms |
| 99.9th percentile service time | phrase | 13.2573 | ms |
| 100th percentile service time | phrase | 20.1639 | ms |
| error rate | phrase | 0 | % |
| Min Throughput | country_agg_uncached | 3 | ops/s |
| Mean Throughput | country_agg_uncached | 3 | ops/s |
| Median Throughput | country_agg_uncached | 3 | ops/s |
| Max Throughput | country_agg_uncached | 3 | ops/s |
| 50th percentile latency | country_agg_uncached | 149.076 | ms |
| 90th percentile latency | country_agg_uncached | 157.751 | ms |
| 99th percentile latency | country_agg_uncached | 162.43 | ms |
| 100th percentile latency | country_agg_uncached | 163.716 | ms |
| 50th percentile service time | country_agg_uncached | 147.889 | ms |
| 90th percentile service time | country_agg_uncached | 156 | ms |
| 99th percentile service time | country_agg_uncached | 161.547 | ms |
| 100th percentile service time | country_agg_uncached | 162.731 | ms |
| error rate | country_agg_uncached | 0 | % |
| Min Throughput | country_agg_cached | 98.72 | ops/s |
| Mean Throughput | country_agg_cached | 99.06 | ops/s |
| Median Throughput | country_agg_cached | 99.09 | ops/s |
| Max Throughput | country_agg_cached | 99.3 | ops/s |
| 50th percentile latency | country_agg_cached | 2.81234 | ms |
| 90th percentile latency | country_agg_cached | 3.27198 | ms |
| 99th percentile latency | country_agg_cached | 3.70345 | ms |
| 99.9th percentile latency | country_agg_cached | 4.05661 | ms |
| 100th percentile latency | country_agg_cached | 4.45997 | ms |
| 50th percentile service time | country_agg_cached | 1.78307 | ms |
| 90th percentile service time | country_agg_cached | 2.01869 | ms |
| 99th percentile service time | country_agg_cached | 2.40292 | ms |
| 99.9th percentile service time | country_agg_cached | 3.47974 | ms |
| 100th percentile service time | country_agg_cached | 3.52695 | ms |
| error rate | country_agg_cached | 0 | % |
| Min Throughput | scroll | 20.05 | pages/s |
| Mean Throughput | scroll | 20.06 | pages/s |
| Median Throughput | scroll | 20.06 | pages/s |
| Max Throughput | scroll | 20.07 | pages/s |
| 50th percentile latency | scroll | 224.553 | ms |
| 90th percentile latency | scroll | 230.098 | ms |
| 99th percentile latency | scroll | 236.964 | ms |
| 100th percentile latency | scroll | 254.53 | ms |
| 50th percentile service time | scroll | 221.995 | ms |
| 90th percentile service time | scroll | 227.37 | ms |
| 99th percentile service time | scroll | 234.79 | ms |
| 100th percentile service time | scroll | 251.803 | ms |
| error rate | scroll | 0 | % |
| Min Throughput | expression | 1.5 | ops/s |
| Mean Throughput | expression | 1.5 | ops/s |
| Median Throughput | expression | 1.5 | ops/s |
| Max Throughput | expression | 1.5 | ops/s |
| 50th percentile latency | expression | 269.364 | ms |
| 90th percentile latency | expression | 276.925 | ms |
| 99th percentile latency | expression | 297.282 | ms |
| 100th percentile latency | expression | 303.19 | ms |
| 50th percentile service time | expression | 268.006 | ms |
| 90th percentile service time | expression | 275.478 | ms |
| 99th percentile service time | expression | 295.91 | ms |
| 100th percentile service time | expression | 301.678 | ms |
| error rate | expression | 0 | % |
| Min Throughput | painless_static | 1.4 | ops/s |
| Mean Throughput | painless_static | 1.4 | ops/s |
| Median Throughput | painless_static | 1.4 | ops/s |
| Max Throughput | painless_static | 1.4 | ops/s |
| 50th percentile latency | painless_static | 316.759 | ms |
| 90th percentile latency | painless_static | 325.201 | ms |
| 99th percentile latency | painless_static | 362.284 | ms |
| 100th percentile latency | painless_static | 371.81 | ms |
| 50th percentile service time | painless_static | 315.386 | ms |
| 90th percentile service time | painless_static | 323.56 | ms |
| 99th percentile service time | painless_static | 361.033 | ms |
| 100th percentile service time | painless_static | 370.653 | ms |
| error rate | painless_static | 0 | % |
| Min Throughput | painless_dynamic | 1.4 | ops/s |
| Mean Throughput | painless_dynamic | 1.4 | ops/s |
| Median Throughput | painless_dynamic | 1.4 | ops/s |
| Max Throughput | painless_dynamic | 1.4 | ops/s |
| 50th percentile latency | painless_dynamic | 312.26 | ms |
| 90th percentile latency | painless_dynamic | 316.634 | ms |
| 99th percentile latency | painless_dynamic | 324.82 | ms |
| 100th percentile latency | painless_dynamic | 359.638 | ms |
| 50th percentile service time | painless_dynamic | 310.871 | ms |
| 90th percentile service time | painless_dynamic | 315.494 | ms |
| 99th percentile service time | painless_dynamic | 322.884 | ms |
| 100th percentile service time | painless_dynamic | 357.735 | ms |
| error rate | painless_dynamic | 0 | % |
| Min Throughput | decay_geo_gauss_function_score | 1 | ops/s |
| Mean Throughput | decay_geo_gauss_function_score | 1 | ops/s |
| Median Throughput | decay_geo_gauss_function_score | 1 | ops/s |
| Max Throughput | decay_geo_gauss_function_score | 1 | ops/s |
| 50th percentile latency | decay_geo_gauss_function_score | 351.541 | ms |
| 90th percentile latency | decay_geo_gauss_function_score | 355.485 | ms |
| 99th percentile latency | decay_geo_gauss_function_score | 358.036 | ms |
| 100th percentile latency | decay_geo_gauss_function_score | 361.465 | ms |
| 50th percentile service time | decay_geo_gauss_function_score | 349.727 | ms |
| 90th percentile service time | decay_geo_gauss_function_score | 353.724 | ms |
| 99th percentile service time | decay_geo_gauss_function_score | 356.594 | ms |
| 100th percentile service time | decay_geo_gauss_function_score | 359.936 | ms |
| error rate | decay_geo_gauss_function_score | 0 | % |
| Min Throughput | decay_geo_gauss_script_score | 1 | ops/s |
| Mean Throughput | decay_geo_gauss_script_score | 1 | ops/s |
| Median Throughput | decay_geo_gauss_script_score | 1 | ops/s |
| Max Throughput | decay_geo_gauss_script_score | 1 | ops/s |
| 50th percentile latency | decay_geo_gauss_script_score | 356.908 | ms |
| 90th percentile latency | decay_geo_gauss_script_score | 359.112 | ms |
| 99th percentile latency | decay_geo_gauss_script_score | 363.265 | ms |
| 100th percentile latency | decay_geo_gauss_script_score | 364.061 | ms |
| 50th percentile service time | decay_geo_gauss_script_score | 355.026 | ms |
| 90th percentile service time | decay_geo_gauss_script_score | 357.59 | ms |
| 99th percentile service time | decay_geo_gauss_script_score | 361.629 | ms |
| 100th percentile service time | decay_geo_gauss_script_score | 362.214 | ms |
| error rate | decay_geo_gauss_script_score | 0 | % |
| Min Throughput | field_value_function_score | 1.5 | ops/s |
| Mean Throughput | field_value_function_score | 1.5 | ops/s |
| Median Throughput | field_value_function_score | 1.5 | ops/s |
| Max Throughput | field_value_function_score | 1.51 | ops/s |
| 50th percentile latency | field_value_function_score | 123.162 | ms |
| 90th percentile latency | field_value_function_score | 133.045 | ms |
| 99th percentile latency | field_value_function_score | 149.976 | ms |
| 100th percentile latency | field_value_function_score | 150.608 | ms |
| 50th percentile service time | field_value_function_score | 121.782 | ms |
| 90th percentile service time | field_value_function_score | 131.558 | ms |
| 99th percentile service time | field_value_function_score | 148.563 | ms |
| 100th percentile service time | field_value_function_score | 149.143 | ms |
| error rate | field_value_function_score | 0 | % |
| Min Throughput | field_value_script_score | 1.5 | ops/s |
| Mean Throughput | field_value_script_score | 1.5 | ops/s |
| Median Throughput | field_value_script_score | 1.5 | ops/s |
| Max Throughput | field_value_script_score | 1.51 | ops/s |
| 50th percentile latency | field_value_script_score | 155.57 | ms |
| 90th percentile latency | field_value_script_score | 158.957 | ms |
| 99th percentile latency | field_value_script_score | 162.297 | ms |
| 100th percentile latency | field_value_script_score | 171.065 | ms |
| 50th percentile service time | field_value_script_score | 154.36 | ms |
| 90th percentile service time | field_value_script_score | 157.404 | ms |
| 99th percentile service time | field_value_script_score | 160.578 | ms |
| 100th percentile service time | field_value_script_score | 168.834 | ms |
| error rate | field_value_script_score | 0 | % |
| Min Throughput | large_terms | 1.1 | ops/s |
| Mean Throughput | large_terms | 1.1 | ops/s |
| Median Throughput | large_terms | 1.1 | ops/s |
| Max Throughput | large_terms | 1.1 | ops/s |
| 50th percentile latency | large_terms | 484.578 | ms |
| 90th percentile latency | large_terms | 495.362 | ms |
| 99th percentile latency | large_terms | 518.507 | ms |
| 100th percentile latency | large_terms | 542.268 | ms |
| 50th percentile service time | large_terms | 477.213 | ms |
| 90th percentile service time | large_terms | 487.98 | ms |
| 99th percentile service time | large_terms | 509.848 | ms |
| 100th percentile service time | large_terms | 535.922 | ms |
| error rate | large_terms | 0 | % |
| Min Throughput | large_filtered_terms | 1.1 | ops/s |
| Mean Throughput | large_filtered_terms | 1.1 | ops/s |
| Median Throughput | large_filtered_terms | 1.1 | ops/s |
| Max Throughput | large_filtered_terms | 1.1 | ops/s |
| 50th percentile latency | large_filtered_terms | 493.048 | ms |
| 90th percentile latency | large_filtered_terms | 508.977 | ms |
| 99th percentile latency | large_filtered_terms | 523.258 | ms |
| 100th percentile latency | large_filtered_terms | 524.487 | ms |
| 50th percentile service time | large_filtered_terms | 486.102 | ms |
| 90th percentile service time | large_filtered_terms | 501.647 | ms |
| 99th percentile service time | large_filtered_terms | 515.519 | ms |
| 100th percentile service time | large_filtered_terms | 518.476 | ms |
| error rate | large_filtered_terms | 0 | % |
| Min Throughput | large_prohibited_terms | 1.1 | ops/s |
| Mean Throughput | large_prohibited_terms | 1.1 | ops/s |
| Median Throughput | large_prohibited_terms | 1.1 | ops/s |
| Max Throughput | large_prohibited_terms | 1.1 | ops/s |
| 50th percentile latency | large_prohibited_terms | 482.855 | ms |
| 90th percentile latency | large_prohibited_terms | 496.482 | ms |
| 99th percentile latency | large_prohibited_terms | 512.956 | ms |
| 100th percentile latency | large_prohibited_terms | 527.143 | ms |
| 50th percentile service time | large_prohibited_terms | 475.813 | ms |
| 90th percentile service time | large_prohibited_terms | 488.969 | ms |
| 99th percentile service time | large_prohibited_terms | 506.16 | ms |
| 100th percentile service time | large_prohibited_terms | 520.476 | ms |
| error rate | large_prohibited_terms | 0 | % |
| Min Throughput | desc_sort_population | 1.5 | ops/s |
| Mean Throughput | desc_sort_population | 1.51 | ops/s |
| Median Throughput | desc_sort_population | 1.51 | ops/s |
| Max Throughput | desc_sort_population | 1.51 | ops/s |
| 50th percentile latency | desc_sort_population | 57.536 | ms |
| 90th percentile latency | desc_sort_population | 71.9505 | ms |
| 99th percentile latency | desc_sort_population | 91.8661 | ms |
| 100th percentile latency | desc_sort_population | 100.124 | ms |
| 50th percentile service time | desc_sort_population | 55.7684 | ms |
| 90th percentile service time | desc_sort_population | 70.5174 | ms |
| 99th percentile service time | desc_sort_population | 90.3164 | ms |
| 100th percentile service time | desc_sort_population | 98.1669 | ms |
| error rate | desc_sort_population | 0 | % |
| Min Throughput | asc_sort_population | 1.5 | ops/s |
| Mean Throughput | asc_sort_population | 1.51 | ops/s |
| Median Throughput | asc_sort_population | 1.51 | ops/s |
| Max Throughput | asc_sort_population | 1.51 | ops/s |
| 50th percentile latency | asc_sort_population | 58.7567 | ms |
| 90th percentile latency | asc_sort_population | 60.5398 | ms |
| 99th percentile latency | asc_sort_population | 73.2742 | ms |
| 100th percentile latency | asc_sort_population | 73.6542 | ms |
| 50th percentile service time | asc_sort_population | 57.0029 | ms |
| 90th percentile service time | asc_sort_population | 58.714 | ms |
| 99th percentile service time | asc_sort_population | 71.6442 | ms |
| 100th percentile service time | asc_sort_population | 71.82 | ms |
| error rate | asc_sort_population | 0 | % |
| Min Throughput | asc_sort_with_after_population | 1.5 | ops/s |
| Mean Throughput | asc_sort_with_after_population | 1.51 | ops/s |
| Median Throughput | asc_sort_with_after_population | 1.51 | ops/s |
| Max Throughput | asc_sort_with_after_population | 1.51 | ops/s |
| 50th percentile latency | asc_sort_with_after_population | 80.2785 | ms |
| 90th percentile latency | asc_sort_with_after_population | 82.6272 | ms |
| 99th percentile latency | asc_sort_with_after_population | 94.4026 | ms |
| 100th percentile latency | asc_sort_with_after_population | 94.8459 | ms |
| 50th percentile service time | asc_sort_with_after_population | 78.5427 | ms |
| 90th percentile service time | asc_sort_with_after_population | 80.4041 | ms |
| 99th percentile service time | asc_sort_with_after_population | 92.8593 | ms |
| 100th percentile service time | asc_sort_with_after_population | 93.0199 | ms |
| error rate | asc_sort_with_after_population | 0 | % |
| Min Throughput | desc_sort_geonameid | 6.02 | ops/s |
| Mean Throughput | desc_sort_geonameid | 6.02 | ops/s |
| Median Throughput | desc_sort_geonameid | 6.02 | ops/s |
| Max Throughput | desc_sort_geonameid | 6.02 | ops/s |
| 50th percentile latency | desc_sort_geonameid | 7.92538 | ms |
| 90th percentile latency | desc_sort_geonameid | 8.42276 | ms |
| 99th percentile latency | desc_sort_geonameid | 10.2115 | ms |
| 100th percentile latency | desc_sort_geonameid | 11.1475 | ms |
| 50th percentile service time | desc_sort_geonameid | 6.5583 | ms |
| 90th percentile service time | desc_sort_geonameid | 6.89089 | ms |
| 99th percentile service time | desc_sort_geonameid | 8.7876 | ms |
| 100th percentile service time | desc_sort_geonameid | 10.0496 | ms |
| error rate | desc_sort_geonameid | 0 | % |
| Min Throughput | desc_sort_with_after_geonameid | 6.01 | ops/s |
| Mean Throughput | desc_sort_with_after_geonameid | 6.01 | ops/s |
| Median Throughput | desc_sort_with_after_geonameid | 6.01 | ops/s |
| Max Throughput | desc_sort_with_after_geonameid | 6.01 | ops/s |
| 50th percentile latency | desc_sort_with_after_geonameid | 75.2093 | ms |
| 90th percentile latency | desc_sort_with_after_geonameid | 86.6912 | ms |
| 99th percentile latency | desc_sort_with_after_geonameid | 90.4317 | ms |
| 100th percentile latency | desc_sort_with_after_geonameid | 93.5113 | ms |
| 50th percentile service time | desc_sort_with_after_geonameid | 73.79 | ms |
| 90th percentile service time | desc_sort_with_after_geonameid | 85.2085 | ms |
| 99th percentile service time | desc_sort_with_after_geonameid | 88.932 | ms |
| 100th percentile service time | desc_sort_with_after_geonameid | 92.6169 | ms |
| error rate | desc_sort_with_after_geonameid | 0 | % |
| Min Throughput | asc_sort_geonameid | 6.02 | ops/s |
| Mean Throughput | asc_sort_geonameid | 6.02 | ops/s |
| Median Throughput | asc_sort_geonameid | 6.02 | ops/s |
| Max Throughput | asc_sort_geonameid | 6.03 | ops/s |
| 50th percentile latency | asc_sort_geonameid | 5.94919 | ms |
| 90th percentile latency | asc_sort_geonameid | 6.45275 | ms |
| 99th percentile latency | asc_sort_geonameid | 7.60038 | ms |
| 100th percentile latency | asc_sort_geonameid | 7.97628 | ms |
| 50th percentile service time | asc_sort_geonameid | 4.61634 | ms |
| 90th percentile service time | asc_sort_geonameid | 4.87425 | ms |
| 99th percentile service time | asc_sort_geonameid | 6.38694 | ms |
| 100th percentile service time | asc_sort_geonameid | 6.79052 | ms |
| error rate | asc_sort_geonameid | 0 | % |
| Min Throughput | asc_sort_with_after_geonameid | 6.01 | ops/s |
| Mean Throughput | asc_sort_with_after_geonameid | 6.01 | ops/s |
| Median Throughput | asc_sort_with_after_geonameid | 6.01 | ops/s |
| Max Throughput | asc_sort_with_after_geonameid | 6.02 | ops/s |
| 50th percentile latency | asc_sort_with_after_geonameid | 70.0619 | ms |
| 90th percentile latency | asc_sort_with_after_geonameid | 81.3791 | ms |
| 99th percentile latency | asc_sort_with_after_geonameid | 89.1096 | ms |
| 100th percentile latency | asc_sort_with_after_geonameid | 90.5249 | ms |
| 50th percentile service time | asc_sort_with_after_geonameid | 68.8445 | ms |
| 90th percentile service time | asc_sort_with_after_geonameid | 80.2913 | ms |
| 99th percentile service time | asc_sort_with_after_geonameid | 87.9724 | ms |
| 100th percentile service time | asc_sort_with_after_geonameid | 88.9337 | ms |
| error rate | asc_sort_with_after_geonameid | 0 | % |